New Semester
Started
Get
50% OFF
Study Help!
--h --m --s
Claim Now
Question Answers
Textbooks
Find textbooks, questions and answers
Oops, something went wrong!
Change your search query and then try again
S
Books
FREE
Study Help
Expert Questions
Accounting
General Management
Mathematics
Finance
Organizational Behaviour
Law
Physics
Operating System
Management Leadership
Sociology
Programming
Marketing
Database
Computer Network
Economics
Textbooks Solutions
Accounting
Managerial Accounting
Management Leadership
Cost Accounting
Statistics
Business Law
Corporate Finance
Finance
Economics
Auditing
Tutors
Online Tutors
Find a Tutor
Hire a Tutor
Become a Tutor
AI Tutor
AI Study Planner
NEW
Sell Books
Search
Search
Sign In
Register
study help
mathematics
practice of statistics
The Practice Of Statistics 6th Edition Daren S. Starnes, Josh Tabor - Solutions
A study of child care enrolled 1364 infants and followed them through their sixth year in school. Later, the researchers published an article in which they stated that “the more time children spent in child care from birth to age 4½, the more adults tended to rate them, both at age 4½ and at
An educator wants to compare the effectiveness of computer software for teaching biology with that of a textbook presentation. She gives a biology pretest to each student in a group of high school juniors, then randomly divides them into two groups. One group uses the computer, and the other
Is fish good for the gut? Researchers tracked 22,000 male physicians for 22 years. Those who reported eating seafood of any kind at least 5 times per week had a 40% lower risk of colon cancer than those who said they ate seafood less than once a week. Explain how confounding makes it unreasonable
Some Internet service providers (ISPs) charge companies based on how much bandwidth they use in a month. One method that ISPs use to calculate bandwidth is to find the 95th percentile of a company’s usage based on samples of hundreds of 5-minute intervals during a month.a. Explain what “95th
Does the type of program people watch influence how much they eat? A total of 94 college students were randomly assigned to one of three treatments: watching 20 minutes of a Hollywood action movie (The Island), watching the same 20-minute excerpt of the movie with no sound, and watching 20 minutes
A study by Pamela Herd of the University of Wisconsin–Madison found a link between high school grades and health. Analyzing data from the Wisconsin Longitudinal Study, which has tracked the lives of thousands of Wisconsin high school graduates from the class of 1957, Herd found that students with
A simple random sample of 1200 adult Americans is selected, and each person is asked the following question: “In light of the huge national deficit, should the government at this time spend additional money to send humans to Mars?” Only 39% of those responding answered “Yes.” This surveya.
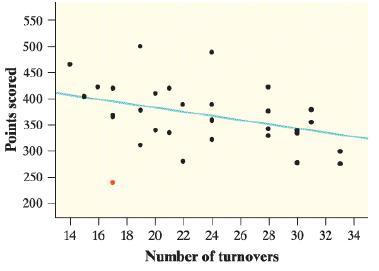
How many points do turnovers cost teams in the NFL? The scatterplot shows the relationship between x = number of turnovers and y = number of points scored by teams in the NFL during 2015, along with the least squares regression line ŷ = 460.2 − 4.084x.a. Interpret the slope of the regression
Suppose that 35% of the voters in a state are registered as Republicans, 40% as Democrats, and 25% as Independents. A newspaper wants to select a sample of 1000 registered voters to predict the outcome of the next election. If it randomly selects 350 Republicans, randomly selects 400 Democrats, and
A local news agency conducted a survey about unemployment by randomly dialing phone numbers during the work day until it gathered responses from 1000 adults in its state. In the survey, 19% of those who responded said they were not currently employed. In reality, only 6% of the adults in the state
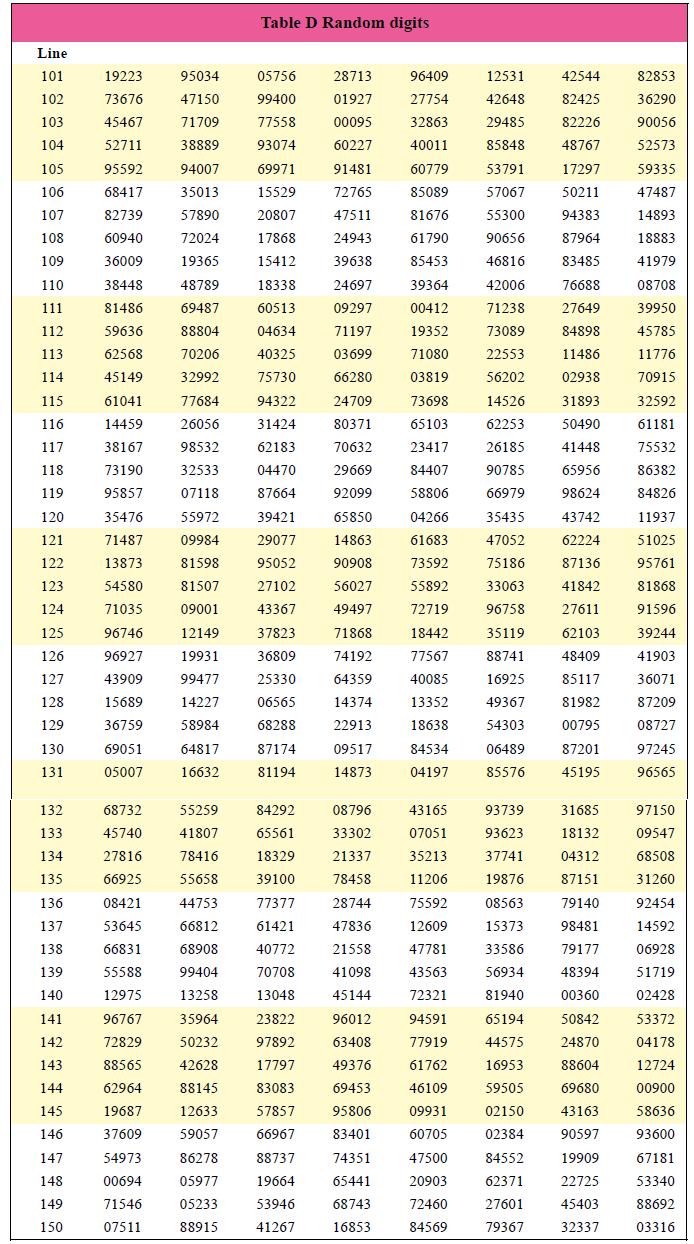
Your statistics class has 30 students. You want to ask an SRS of 5 students from your class whether they use a mobile device for the online quizzes. You label the students 01, 02, … , 30. You enter the table of random digits at this line:14459 26056 31424 80371 65103
To gather information about the validity of a new standardized test for 10th-grade students in a particular state, a random sample of 15 high schools was selected from the state. The new test was administered to every 10th-grade student in the selected high schools. What kind of sample is this?a. A
Comment on each of the following as a potential sample survey question. Is the question clear? Is it slanted toward a desired response?a. Which of the following best represents your opinion on gun control?i. The government should confiscate our guns.ii. We have the right to keep and bear arms.b. A
A popular website places opinion poll questions next to many of its news stories. Simply click your response to join the sample. One of the questions was “Do you plan to diet this year?” More than 30,000 people responded, with 68% saying “Yes.” Which of the following is true?a. About 68% of
Comment on each of the following as a potential sample survey question. Is the question clear? Is it slanted toward a desired response?a. “Some cell phone users have developed brain cancer. Should all cell phones come with a warning label explaining the danger of using cell phones?”b. “Do you
Marcos asked a random sample of 50 mall shoppers for their weight. Twenty-five of the shoppers were asked directly and the other 25 were asked anonymously by means of a “secret ballot.” The mean reported weight was 13 pounds heavier for the anonymous group. Explain why the two means are so
Two female statistics students asked a random sample of 60 high school boys if they have ever cried during a movie. Thirty of the boys were asked directly and the other 30 were asked anonymously by means of a “secret ballot.” When the responses were anonymous, 63% of the boys said “Yes,”
A study in El Paso, Texas, looked at seat belt use by drivers. Drivers were observed at randomly chosen convenience stores. After they left their cars, they were invited to answer questions that included questions about seat belt use. In all, 75% said they always used seat belts, yet only 61.5%
An SRS of 880 drivers was asked: “Recalling the last ten traffic lights you drove through, how many of them were red when you entered the intersections?” Of the 880 respondents, 171 admitted that at least one light had been red. A practical problem with this survey is that people may not give
A survey of drivers began by randomly sampling from all listed residential telephone numbers in the United States. Of 45,956 calls to these numbers, 5029 were completed. The goal of the survey was to estimate how far people drive, on average, per day. Describe how nonresponse might lead to bias in
A news organization wants to know what percent of U.S. residents support a “pathway to citizenship” for people who live in the United States illegally. The news organization randomly selects registered voters for the survey.Describe how undercoverage might lead to bias in this study. Explain
A total of 300 people participated in a free 12-week weight-loss course at a community health clinic. After one year, administrators emailed each of the 300 participants to see how much weight they had lost since the end of the course. Only 56 participants responded to the survey. The mean weight
The director of student life at a small college wants to know what percent of students eat regularly in the cafeteria. To find out, the director selects an SRS of 300 students who live in the dorms. Describe how undercoverage might lead to bias in this study. Explain the likely direction of the
A lumber company wants to estimate the proportion of trees in a large forest that are ready to be cut down. They use an aerial map to divide the forest into 200 equal-sized rectangles. Then they choose a random sample of 20 rectangles and examine every tree that’s in one of those rectangles.a.
Laying fiber-optic cable is expensive. Cable companies want to make sure that if they extend their lines to less dense suburban or rural areas, there will be sufficient demand so the work will be cost-effective. They decide to conduct a survey to determine the proportion of households in a rural
A hotel has 30 floors with 40 rooms per floor. The rooms on one side of the hotel face the water, while rooms on the other side face a golf course. There is an extra charge for the rooms with a water view. The hotel manager wants to select 120 rooms and survey the registered guest in each of the
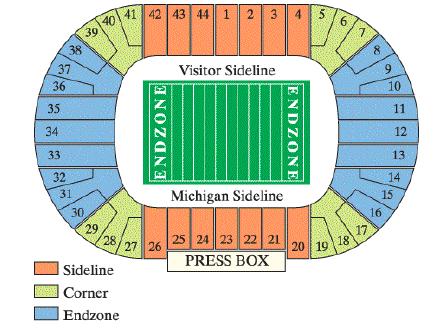
Michigan Stadium, also known as “The Big House,” seats over 100,000 fans for a football game. The University of Michigan Athletic Department wants to survey fans about concessions that are sold during games. Tickets are most expensive for seats on the sidelines. The cheapest seats are in the
At a party, there are 30 students over age 21 and 20 students under age 21. You choose at random 3 of those over 21 and separately choose at random 2 of those under 21 to interview about their attitudes toward alcohol. You have given every student at the party the same chance to be interviewed. Is
A corporation employs 2000 male and 500 female engineers. A stratified random sample of 200 male and 50 female engineers gives every individual in the population the same chance to be chosen for the sample. Is it an SRS? Explain your answer.
The director of student life at a university wants to estimate the proportion of undergraduate students who regularly park a car on campus. Describe how to select a stratified random sample of approximately 100 students. Explain your choice of strata and why stratified random sampling might be
Suppose 1000 iPhones are produced at a factory today. Management would like to ensure that the phones’ display screens meet their quality standards before shipping them to retail stores. Because it takes about 10 minutes to inspect an individual phone’s display screen, managers decide to
The owner of a large restaurant is considering a new “no tipping” policy and wants to survey a sample of employees. The policy would add 20% to the cost of food and beverages and the additional revenue would be distributed equally among servers and kitchen staff. Describe how to select a
On the west side of Rocky Mountain National Park, many mature pine trees are dying due to infestation by pine beetles. Scientists would like to use sampling to estimate the proportion of all pine trees in this area that have been infested.a. Explain why it wouldn’t be practical for scientists to
The local genealogical society in Coles County, Illinois, has compiled records on all 55,914 gravestones in cemeteries in the county for the years 1825 to 1985. Historians plan to use these records to learn about African Americans in Coles County’s history. They first choose an SRS of 395 records
To gather data on a 1200-acre pine forest in Louisiana, the U.S. Forest Service laid a grid of 1410 equally spaced circular plots over a map of the forest. A ground survey visited a sample of 10% of the plots.a. Explain how you would use a random number generator to choose an SRS of 141 plots. Your
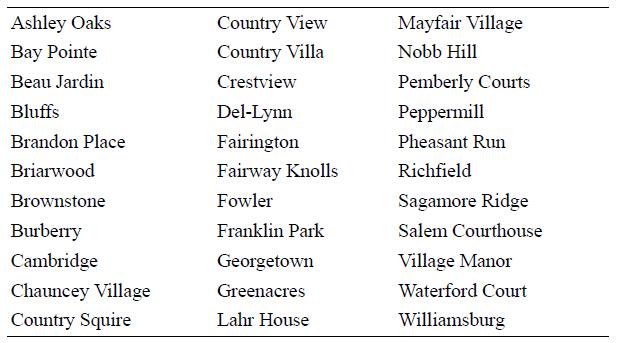
You are planning a report on apartment living in a college town. You decide to select three apartment complexes at random for in-depth interviews with residents.a. Explain how you would use a line of Table D to choose an SRS of 3 complexes from the following list.b. Use line 117 to select the
You want to ask a sample of high school students the question “How much do you trust information about health that you find on the Internet—a great deal, somewhat, not much, or not at all?” You try out this and other questions on a pilot group of 5 students chosen from your class.a. Explain
Many websites include customer reviews of products, restaurants, hotels, and so on. The manager of a hotel was upset to see that 26% of reviewers on a travel website gave the hotel “1 star”—the lowest possible rating. Explain how bias in the sampling method could affect the estimate.
Parade magazine posed the following question: “Should drivers be banned from using all cell phones?” Readers were encouraged to vote online at parade.com. The subsequent issue of Parade reported the results: 2407 (85%) said “Yes” and 410 (15%) said “No.”a. What type of sample did the
You may have seen the mall interviewer, clipboard in hand, approaching people passing by. Explain why even a large sample of mall shoppers would not provide a trustworthy estimate of the current unemployment rate in the city where the mall is located.
You are on the staff of a member of Congress who is considering a bill that would provide government-sponsored insurance for nursing-home care. You report that 1128 letters have been received on the issue, of which 871 oppose the legislation. “I’m surprised that most of my constituents oppose
The band director at a high school wants to estimate the percentage of parents who support a decrease in the budget for fine arts. Because many parents attend the school’s annual musical, the director surveys the first 30 parents who arrive at the show. Explain how bias in the sampling method
How much sleep do high school students get on a typical school night? A counselor designed a survey to find out. To make data collection easier, the counselor surveyed the first 100 students to arrive at school on a particular morning. These students reported an average of 7.2 hours of sleep on the
A department store mails a customer satisfaction survey to people who make credit card purchases at the store. This month, 45,000 people made credit card purchases. Surveys are mailed to 1000 of these people, chosen at random, and 137 people return the survey form. Identify the population and the
A large retailer prepares its customers’ monthly credit card bills using an automatic machine that folds the bills, stuffs them into envelopes, and seals the envelopes for mailing. Are the envelopes completely sealed? Inspectors choose 40 envelopes at random from the 1000 stuffed each hour for
In this project, your team will design and conduct an experiment to investigate the effects of response bias in surveys.82 You may choose the topic for your surveys, but you must design your experiment so that it can answer at least one of the following questions. Does the wording of a question
A high school’s student newspaper plans to survey local businesses about the importance of students as customers. From an alphabetical list of all local businesses, the newspaper staff chooses 150 businesses at random. Of these, 73 return the questionnaire mailed by the staff. Identify the
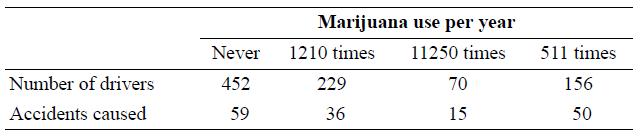
Researchers in New Zealand interviewed 907 drivers at age 21. They had data on traffic accidents and they asked the drivers about marijuana use. Here are data on the numbers of accidents caused by these drivers at age 19, broken down by marijuana use at the same age:a. Make a graph that displays
An archaeological dig turns up large numbers of pottery shards, broken stone tools, and other artifacts. Students working on the project classify each artifact and assign a number to it. The counts in different categories are important for understanding the site, so the project director chooses 2%
Suppose that the measurements of arm span and height were converted from centimeters to meters by dividing each measurement by 100. How will this conversion affect the values of r2 and s?a. r2 will increase, s will increase.b. r2 will increase, s will stay the same.c. r2will increase, s will
In its recent Fuel Economy Guide, the Environmental Protection Agency (EPA) gives data on 1152 vehicles. There are a number of outliers, mainly vehicles with very poor gas mileage or hybrids with very good gas mileage. If we ignore the outliers, however, the combined city and highway gas mileage of
Suppose that a tall child with arm span 120 cm and height 118 cm was added to the sample used in this study. What effect will this addition have on the correlation and the slope of the least-squares regression line?a. Correlation will increase, slope will increase.b. Correlation will increase,
One child in the Mumbai study had height 59 cm and arm span 60 cm. This child’s residual isa. −3.2 cm.b. −2.2 cm.c. −1.3 cm.d. 3.2 cm.e. 62.2 cm.Measurements on young children in Mumbai, India, found this least squares line for predicting y = height (in cm) from x = arm span (in cm):ŷ =
In addition to the regression line, the report on the Mumbai measurements says that r2 = 0.95. This suggests thata. Although arm span and height are correlated, arm span does not predict height very accurately.b. Height increases by √0.95 = 0.97 cm for each additional centimeter of arm span.c.
By looking at the equation of the least-squares regression line, you can see that the correlation between height and arm span isa. Greater than zero.b. Less than zero.c. 0.93.d. 6.4.e. Can’t tell without seeing the data.Measurements on young children in Mumbai, India, found this least squares
Each year, students in an elementary school take a standardized math test at the end of the school year. For a class of fourth-graders, the average score was 55.1 with a standard deviation of 12.3. In the third grade, these same students had an average score of 61.7 with a standard deviation of
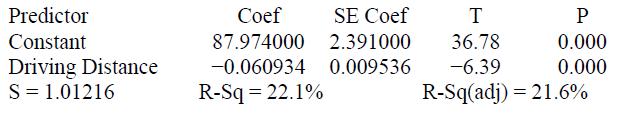
Using data from the LPGA tour, a regression analysis was performed using x = average driving distance and y = scoring average. Using the output from the regression analysis shown below, determine the equation of the least-squares regression line.a. ŷ = 87.974+2.391xb. ŷ = 87.974+1.01216xc. ŷ
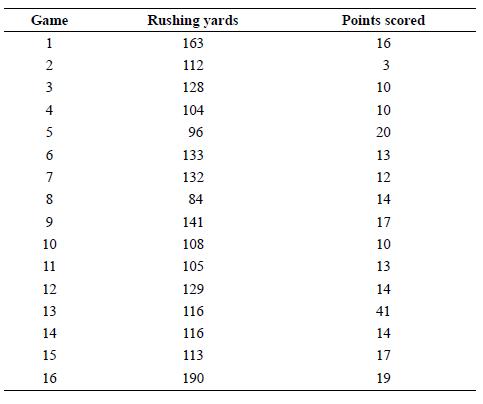
What is the relationship between rushing yards and points scored in the National Football League? The table gives the number of rushing yards and the number of points scored for each of the 16 games played by the Jacksonville Jaguars in a recent season.a. Make a scatterplot with rushing yards as
Which of the following is not a characteristic of the least-squares regression line?a. The slope of the least-squares regression line is always between – 1 and 1.b. The least-squares regression line always goes through the point (x¯,y¯) .c. The least-squares regression line minimizes the sum of
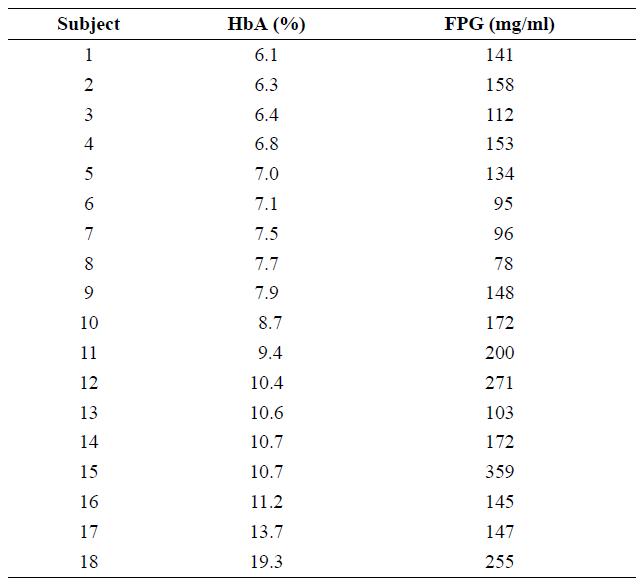
People with diabetes measure their fasting plasma glucose (FPG, measured in milligrams per milliliter) after fasting for at least 8 hours. Another measurement, made at regular medical checkups, is called HbA. This is roughly the percent of red blood cells that have a glucose molecule attached. It
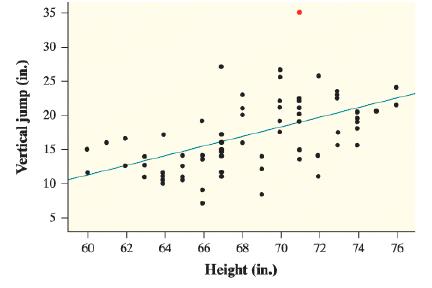
Haley, Jeff, and Nathan measured the height (in inches) and vertical jump (in inches) of 74 students at their school. Here is a scatterplot of the data, along with the least squares regression line. Jacob (highlighted in red) had a vertical jump of nearly 3 feet!a. Describe the influence that
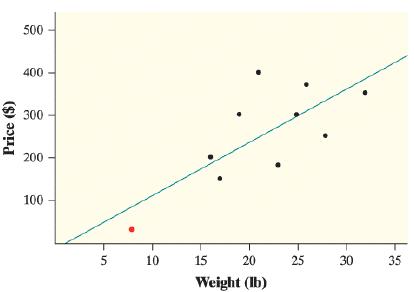
The scatterplot shows the weight (in pounds) and cost (in dollars) of 11 stand mixers. The mixer from Walmart (highlighted in red) was much lighter—and cheaper—than the other mixers.a. Describe what influence the highlighted point has on the equation of the least-squares regression line.b.
We expect that a baseball player who has a high batting average in the first month of the season will also have a high batting average the rest of the season. Using 66 Major League Baseball players from a recent season,33 a least-squares regression line was calculated to predict rest of-season
Some people think that the behavior of the stock market in January predicts its behavior for the rest of the year. Take the explanatory variable x to be the percent change in a stock market index in January and the response variable y to be the change in the index for the entire year. We expect a
We expect that students who do well on the midterm exam in a course will usually also do well on the final exam. Gary Smith of Pomona College looked at the exam scores of all 346 students who took his statistics class over a 10-year period. Assume that both the midterm and final exam were scored
The mean height of married American women in their early 20s is 64.5 inches and the standard deviation is 2.5 inches. The mean height of married men the same age is 68.5 inches with standard deviation 2.7 inches. The correlation between the heights of husbands and wives is about r = 0.5.a. Find the
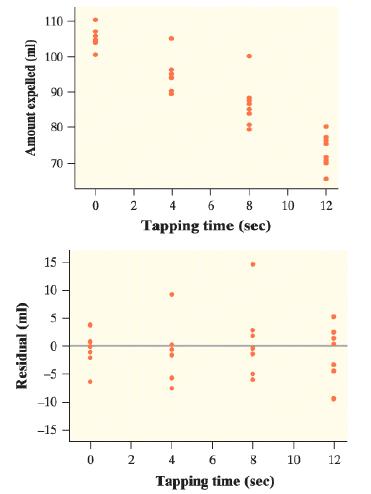
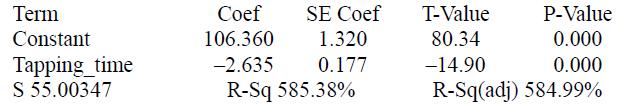
Kerry and Danielle wanted to investigate whether tapping on a can of soda would reduce the amount of soda expelled after the can has been shaken. For their experiment, they vigorously shook 40 cans of soda and randomly assigned each can to be tapped for 0 seconds, 4 seconds, 8 seconds, or 12
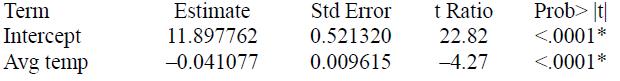
The average temperature (in degrees Fahrenheit) and average wind speed (in miles per hour) were recorded for 365 consecutive days at Chicago’s O’Hare International Airport. Here is computer output for a regression of y = average wind speed on x = average temperature:Summary of FitRSquare
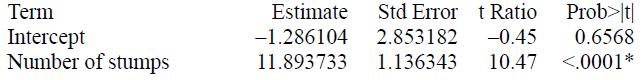
Do beavers benefit beetles? Researchers laid out 23 circular plots, each 4 meters in diameter, in an area where beavers were cutting down cottonwood trees. In each plot, they counted the number of stumps from trees cut by beavers and the number of clusters of beetle larvae. Ecologists believe that
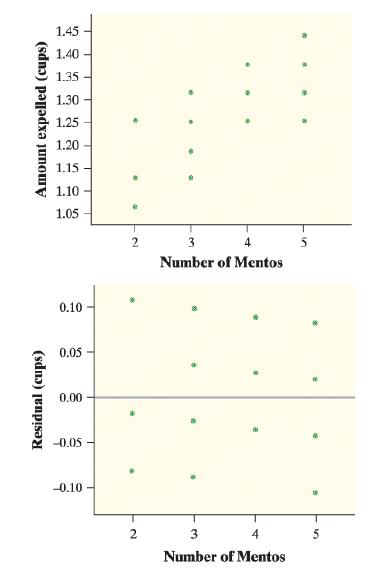
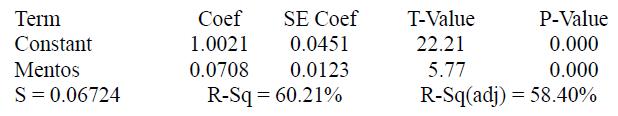
Mentos are dropped into a newly opened bottle of Diet Coke, carbon dioxide is released from the Diet Coke very rapidly, causing the Diet Coke to be expelled from the bottle. To see if using more Mentos causes more Diet Coke to be expelled, Brittany and Allie used twenty four 2-cup bottles of Diet
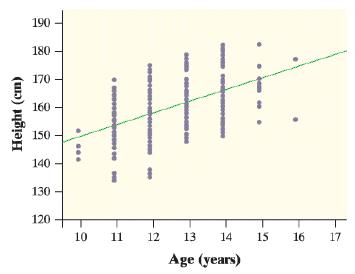
A random sample of 195 students was selected from the United Kingdom using the Census At School data selector. The age x (in years) and height y (in centimeters) were recorded for each student. Here is a scatterplot with the least-squares regression line ŷ = 106.1 + 4.21x. For this model, s =
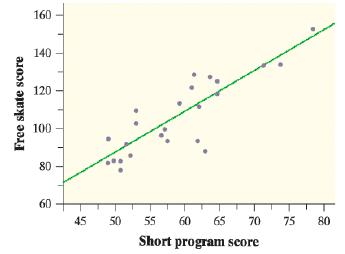
For many people, the women’s figure skating competition is the highlight of the Olympic Winter Games. Scores in the short program x and scores in the free skate y were recorded for each of the 24 skaters who competed in both rounds during the 2010 Winter Olympics in Vancouver, Canada.28 Here is a
In Exercise 44, we summarized the relationship between x = temperature in degrees Fahrenheit and y = chirps per minute for the striped ground cricket, with the regression line ŷ = –0.31 + 0.212x. For this model, technology gives s = 0.97 and r2 = 0.697.a. Interpret the value of s.b. Interpret
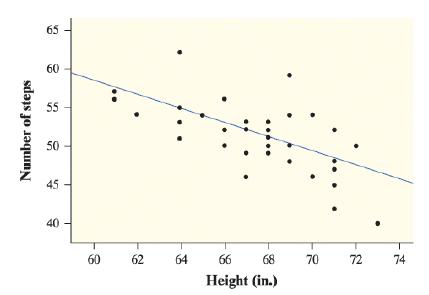
In Exercise 43, we summarized the relationship between x = height of a student (in inches) and y = number of steps required to walk the length of a school hallway, with the regression line ŷ = 113.6 − 0.921x . For this model, technology gives s = 3.50 and r2 = 0.399.a. Interpret the value of
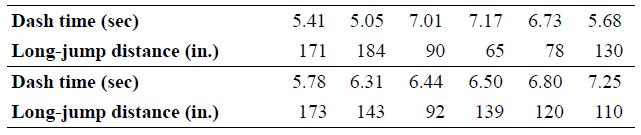
Refer to Exercise 52. Use technology to create a residual plot. Sketch the residual plot and explain what information it provides.Exercise 52.Here are the 40-yard-dash times (in seconds) and longjump distances (in inches) for a small class of 12 students: Dash time (sec) 5.41 5.05 7.01 7.17 6.73
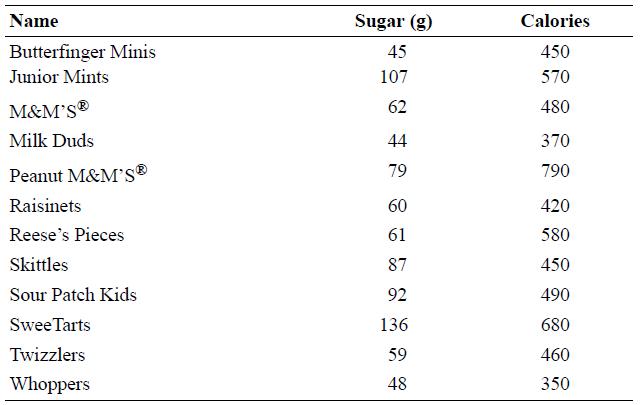
Refer to Exercise 51. Use technology to create a residual plot. Sketch the residual plot and explain what information it provides.Exercise 51. Is there a relationship between the amount of sugar (in grams) and the number of calories in movie-theater candy? Here are the data from a sample of 12
Is there a relationship between the amount of sugar (in grams) and the number of calories in movie-theater candy? Here are the data from a sample of 12 types of candy:a. Sketch a scatterplot of the data using sugar as the explanatory variable.b. Use technology to calculate the equation of the
Here are the 40-yard-dash times (in seconds) and longjump distances (in inches) for a small class of 12 students:a. Sketch a scatterplot of the data using dash time as the explanatory variable.b. Use technology to calculate the equation of the least-squares regression line for predicting the
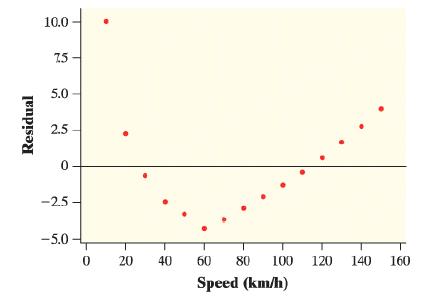
Refer to Exercise 48. Use the equation of the least-squares regression line and the residual plot to estimate the actual fuel consumption of the car when driving 20 kilometers per hour. Exercise 48.Exercise 9 (page 171) gives data on the fuel consumption y of a car at various speeds x. Fuel
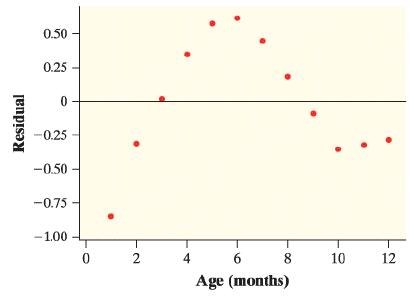
Refer to Exercise 47. Use the equation of the leastsquares regression line and the residual plot to estimate the actual mean weight of the infants when they were 1 month old.Exercise 47.A study of nutrition in developing countries collected data from the Egyptian village of Nahya. Researchers
A study of nutrition in developing countries collected data from the Egyptian village of Nahya. Researchers recorded the mean weight (in kilograms) for 170 infants in Nahya each month during their first year of life. A hasty user of statistics enters the data into software and computes the
Exercise 9 (page 171) gives data on the fuel consumption y of a car at various speeds x. Fuel consumption is measured in liters of gasoline per 100 kilometers driven, and speed is measured in kilometers per hour. A statistical software package gives the least-squares regression line ŷ = 11.058–
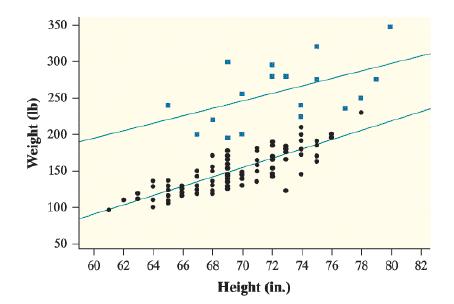
In Exercises 5 and 11, you described the relationship between height (in inches) and weight (in pounds) for Olympic track and field athletes. The scatterplot shows this relationship, along with two regression lines. The regression line for the shotput, hammer throw, and discus throw athletes (blue
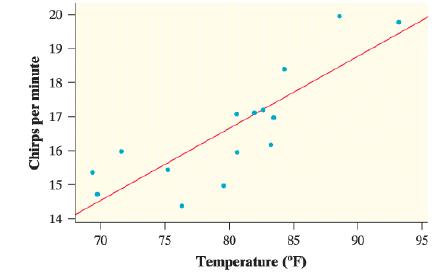
The scatterplot shows the relationship between x = temperature in degrees Fahrenheit and y = chirps per minute for the striped ground cricket, along with the regression line ŷ = −0.31+0.212x.
The scatterplot shows the relationship between x = height of a student (in inches) and y = number of steps required to walk the length of a school hallway, along with the regression line ŷ =113.6−0.921x.a. Calculate and interpret the residual for Kiana, who is 67 inches tall and took 49 steps
Refer to Exercise 38.a. Interpret the slope of the regression line.b. Does the value of the y intercept have meaning in this context? If so, interpret the y intercept. If not, explain why.Exercise 38.Joan is concerned about the amount of energy she uses to heat her home. The scatterplot shows the
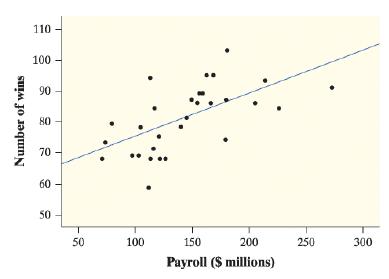
Refer to Exercise 37.a. Interpret the slope of the regression line.b. Does the value of the y intercept have meaning in this context? If so, interpret the y intercept. If not, explain why.Exercise 37.Earlier we investigated the relationship between x = payroll (in millions of dollars) and y =
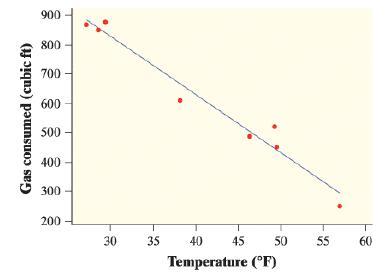
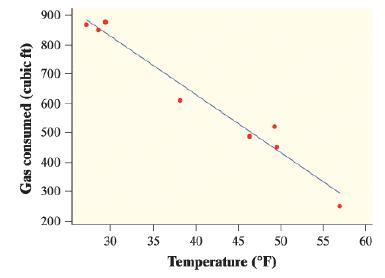
Refer to Exercise 38. During March, the average temperature was 46.4°F and Joan used an average of 490 cubic feet of gas per day. Calculate and interpret the residual for this month.Exercise 38.Joan is concerned about the amount of energy she uses to heat her home. The scatterplot shows the
Refer to Exercise 37. The Chicago Cubs won the World Series in 2016. They had 103 wins and spent $182 million on payroll. Calculate and interpret the residual for the Cubs.Exercise 37.Earlier we investigated the relationship between x = payroll (in millions of dollars) and y = number of wins for
Joan is concerned about the amount of energy she uses to heat her home. The scatterplot shows the relationship between x = mean temperature in a particular month and y = mean amount of natural gas used per day (in cubic feet) in that month, along with the regression line ŷ =1425−19.87x .a.
Earlier we investigated the relationship between x = payroll (in millions of dollars) and y = number of wins for Major League Baseball teams in 2016. Here is a scatterplot of the data, along with the regression line ŷ = 60.7 + 0.139x:a. Predict the number of wins for a team that spends $200
Fruit flies are used frequently in genetic research because of their quick reproductive cycle. The length of the thorax (in millimeters) for male fruit flies is approximately Normally distributed with a mean of 0.80 mm and a standard deviation of 0.08 mm.a. What proportion of male fruit flies have
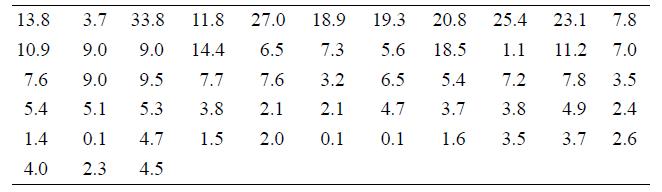
Here are the weights (in milligrams) of 58 diamonds from a nodule carried up to the earth’s surface in surrounding rock. These data represent a population of diamonds formed in a single event deep in the earth.Make a histogram to display the distribution of weight. Describe the distribution. 13.8
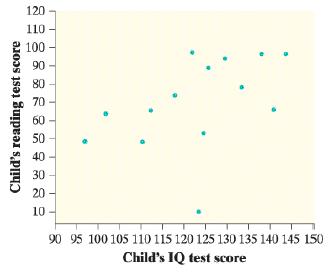
If we leave out the low outlier, the correlation for the remaining 13 points in the preceding figure is closest toa. −0.95.b. −0.65.c. 0.d. 0.65.e. 0.95.Select the best answer.
The scatterplot shows reading test scores against IQ test scores for 14 fifth-grade children. There is one low outlier in the plot. What effect does this low outlier have on the correlation?a. It makes the correlation closer to 1.b. It makes the correlation closer to 0 but still positive.c. It
If women always married men who were 2 years older than themselves, what would be the correlation between the ages of husband and wife?a. 2b. 1c. 0.5d. 0e. Can’t tell without seeing the dataSelect the best answer.
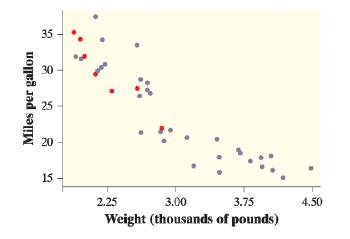
The following graph plots the gas mileage (in miles per gallon) of various cars from the same model year versus the weight of these cars (in thousands of pounds). The points marked with red dots correspond to cars made in Japan. From this plot, we may conclude thata. there is a positive association
In a scatterplot of the average price of a barrel of oil and the average retail price of a gallon of gas, you expect to seea. Very little association.b. A weak negative association.c. A strong negative association.d. A weak positive association.e. A strong positive association.Select the best
You have data for many years on the average price of a barrel of oil and the average retail price of a gallon of unleaded regular gasoline. If you want to see how well the price of oil predicts the price of gas, then you should make a scatterplot with ___________ as the explanatory variable.a. The
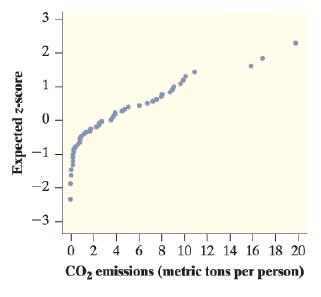
The following figure is a Normal probability plot of the emissions of carbon dioxide (CO2) per person in 48 countries.15 Use the graph to determine if this distribution of CO2 emissions is approximately Normal. 3 2 - -2 -3 0 2 4 6 8 10 12 14 16 18 20 CO2 emissions (metric tons per person) Expected
Showing 800 - 900
of 1147
1
2
3
4
5
6
7
8
9
10
11
12
Step by Step Answers