New Semester
Started
Get
50% OFF
Study Help!
--h --m --s
Claim Now
Question Answers
Textbooks
Find textbooks, questions and answers
Oops, something went wrong!
Change your search query and then try again
S
Books
FREE
Study Help
Expert Questions
Accounting
General Management
Mathematics
Finance
Organizational Behaviour
Law
Physics
Operating System
Management Leadership
Sociology
Programming
Marketing
Database
Computer Network
Economics
Textbooks Solutions
Accounting
Managerial Accounting
Management Leadership
Cost Accounting
Statistics
Business Law
Corporate Finance
Finance
Economics
Auditing
Tutors
Online Tutors
Find a Tutor
Hire a Tutor
Become a Tutor
AI Tutor
AI Study Planner
NEW
Sell Books
Search
Search
Sign In
Register
study help
mathematics
statistics economics accounting
Statistics For Economics Accounting And Business Studies 4th Edition Michael Barrow - Solutions
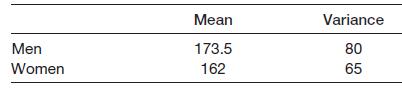
The heights of 10 men and 15 women were recorded, with the following results:Estimate the true difference between men’s and women’s heights. Use the 95% confidence level. Mean Variance Men 173.5 80 Women 162 65
Two samples were drawn, each from a Normally distributed population, with the following results:x̅1 = 45 s1 = 8 n1 = 12x̅2 = 52 s2 = 5 n2 = 18Estimate the difference between the population means, using the 95% confidence level.
A sample of 12 families in a town reveals an average income of £15 000 with standard deviation £6000. Why might you be hesitant about constructing a 95% confidence interval for the average income in the town?
A sample of 16 observations from a Normally distributed population yields a sample mean of 30 with standard deviation 5. Find the 95% confidence interval estimate of the population mean.
(a) A sample of 954 adults in early 1987 found that 23% of them held shares. Given a UK adult population of 41 million and assuming a proper random sample was taken, find the 95% confidence interval estimate for the number of shareholders in the UK.(b) A ‘similar’ survey the previous year had
67% out of 150 pupils from school A passed an exam; 62% of 120 pupils at school B passed. Estimate the 99% confidence interval for the true difference between the proportions passing the exam.
(a) A sample of 200 women from the labour force found an average wage of £6000 p.a. with standard deviation £2500. A sample of 100 men found an average wage of £8000 with standard deviation £1500. Estimate the true difference in wages between men and women.(b) A different survey, of men and
Given the sample datax̅1 = 25 x̅2 = 22s1 = 12 s2 = 18n1 = 80 n2 = 100estimate the true difference between the means with 95% confidence.
A political opinion poll questions 1000 people. Some 464 declare they will vote Conservative. Find the 95% confidence interval estimate for the Conservative share of the vote.
Given the sample data p = 0.4, n = 50, calculate the 99% confidence interval estimate of the true proportion.
A random sample of 100 record shops found that the average weekly sale of a particular record was 260 copies, with standard deviation of 96. Find the 95% confidence interval to estimate the true average sale for all shops. To compile the record chart it is necessary to know the correct average
Given the sample datax̅ = 40 s = 10 n = 36calculate the 99% confidence interval estimate of the true mean. If the sample size were 20, how would the method of calculation and width of the interval be altered?
Following the previous question, prove that the most precise unbiased estimate is obtained by setting w1 = w2 = . Minimise V(w1x1 + w2x2) with respect to w1 after substituting w2 = 1 − w1. You will need a knowledge of calculus to solve this.Previous questionA random sample of two observations, x1
A random sample of two observations, x1 and x2, is drawn from a population. Prove that w1x1 + w2x2 gives an unbiased estimate of the population mean as long as w1 + w2 = 1. Prove that E(w1x1 + w2x2) = μ.
Explain why an unbiased estimator is not always to be preferred to a biased one.
Explain the difference between an estimate and an estimator. Is it true that a good estimator always leads to a good estimate?
Is the 95% confidence interval (a) twice as wide, (b) more than twice as wide, (c) less than twice as wide, as the 47.5% interval? Explain your reasoning.
(a) Why is an interval estimate better than a point estimate?(b) What factors determine the width of a confidence interval?
Using a weekend’s football results from the Premier (or other) league, see if the number of goals per game can be adequately modelled by a Poisson process. First calculate the average number of goals per game for the whole league, then derive the distribution of goals per game using the Poisson
An extremely numerate newsagent (with a spreadsheet program, as you will need) is trying to work out how many copies of a newspaper he should order. The cost to him per copy is 15 pence, which he then sells at 45 pence. Sales are distributed Normally with an average daily sale of 250 and variance
This problem demonstrates the Central Limit Theorem at work. In your spreadsheet, use the =RAND() function to generate a random sample of 25 observations (I suggest entering this function in cells A4:A28, for example). Copy these cells across 100 columns, to generate 100 samples. In row 29,
A firm employing 100 workers has an average absenteeism rate of 4%. On a given day, what is the probability of (a) no workers, (b) one worker, (c) more than six workers being absent?
An experienced invoice clerk makes an error once in every 100 invoices, on average.(a) What is the probability of finding a batch of 100 invoices without error?(b) What is the probability of finding such a batch with more than two errors? Calculate the answers using both the Binomial and Poisson
A machine producing electronic circuits has an average failure rate of 15% (they’re difficult to make). The cost of making a batch of 500 circuits is £8400 and the good ones sell for £20 each. What is the probability of the firm making a loss on any one batch?
A coin is tossed ten times. Write down the distribution of the number of heads,(a) Exactly, using the Binomial distribution,(b) Approximately, using the Normal distribution.(c) Find the probability of four or more heads, using both methods. How accurate is the Normal method, with and without the
The average income of a country is known to be £10 000 with standard deviation £2500. A sample of 40 individuals is taken and their average income calculated.(a) What is the probability distribution of this sample mean?(b) What is the probability of the sample mean being over £10 500?(c) What is
Ten adults are selected at random from the population and their IQ measured.(a) What is the probability distribution of the sample average IQ?(b) What is the probability that the average IQ of the sample is over 110?(c) If many such samples were taken, in what proportion would you expect the
IQ (the intelligence quotient) is Normally distributed with mean 100 and standard deviation 16.(a) What proportion of the population has an IQ above 120?(b) What proportion of the population has IQ between 90 and 110?(c) In the past, about 10% of the population went to university. Now the
If x ~ N(10, 9) find(a) Pr(x > 12)(b) Pr(x < 7)(c) Pr(8 < x < 15)(d) Pr(x = 10).
Find the values of z which cut off(a) The top 10%(b) The bottom 15%(c) The middle 50% of the standard Normal distribution.
For the standard Normal variable z, find(a) Pr(z > 1.64)(b) Pr(z > 0.5)(c) Pr(z > −1.5)(d) Pr(−2 < z < 1.5)(e) Pr(z = −0.75).For (a) and (d), shade in the relevant areas on the graph you drew for Problem 3.11.Problem 3.11.Using equation (3.5) describing the Normal distribution
Repeat the previous Problem for the values μ = 2 and σ 2 = 3. Use values of x from −2 to +6 in increments of 1.Previous ProblemUsing equation (3.5) describing the Normal distribution and setting μ = 0 and σ 2 = 1, graph the distribution for the values x = −2, −1.5, −1, −0.5, 0, 0.5,
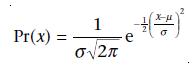
Using equation (3.5) describing the Normal distribution and setting μ = 0 and σ 2 = 1, graph the distribution for the values x = −2, −1.5, −1, −0.5, 0, 0.5, 1, 1.5, 2.Equation (3.5) Pr(x) 1 e Ov2n
The UK record for the number of children born to a mother is 39, 32 of them girls. Assuming the probability of a girl in a single birth is 0.5 and that this probability is independent of previous births:(a) Find the probability of 32 girls in 39 births (you’ll need a scientific calculator or a
A firm receives components from a supplier in large batches, for use in its production process. Production is uneconomic if a batch containing 10% or more defective components is used. The firm checks the quality of each incoming batch by taking a sample of 15 and rejecting the whole batch if more
If the probability of a boy in a single birth is 1/2 and is independent of the sex of previous babies then the number of boys in a family of 10 children follows a Binomial distribution with mean 5 and variance 2.5. In each of the following instances, describe how the distribution of the number of
Six dice are rolled and the number of sixes is noted. Calculate the probabilities of 0, 1, . . . , 6 sixes and graph the probability distribution.
Sketch the probability distribution for the number of accidents on the same stretch of road in one year. How and why does this differ from your previous answer?
Sketch the probability distribution for the number of accidents on a stretch of road in one day.
A train departs every half hour. You arrive at the station at a completely random moment. Sketch the probability distribution of your waiting time. What is your expected waiting time?
Sketch the probability distribution for the likely time of departure of a train. Locate the timetabled departure time on your chart.
Two dice are thrown and the absolute difference of the two scores recorded. Graph the resulting probability distribution and calculate its mean and variance. What is the probability that the absolute difference is 4 or more?
Two dice are thrown and the sum of the two scores is recorded. Draw a graph of the resulting probability distribution of the sum and calculate its mean and variance. What is the probability that the sum is 9 or greater?
This problem is tricky, but amusing. Three gunmen, A, B and C, are shooting at each other. The probabilities that each will hit what they aim at are respectively 1, 0.75, 0.5. They take it in turns to shoot (in alphabetical order) and continue until only one is left alive. Calculate the
There are 25 people at a party. What is the probability that there are at least two with a birthday in common? The complement is (much) easier to calculate.
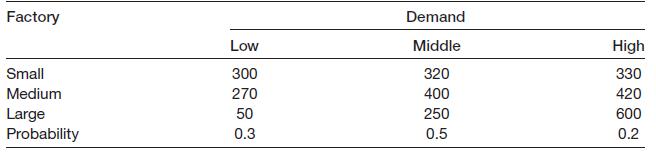
A firm can build a small, medium or large factory, with anticipated profits from each dependent upon the state of demand, as in the table below.(a) Which project should be chosen on the expected value criterion?(b) Which project should be chosen on the maximin and maximax criteria?(c) Which project
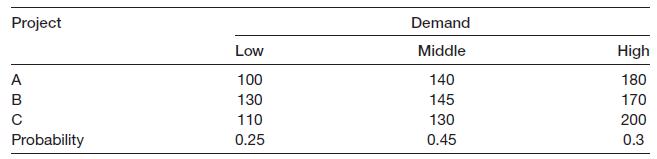
A firm has a choice of three projects, with profits as indicated below, dependent upon the state of demand.(a) Which project should be chosen on the expected value criterion?(b) Which project should be chosen on the maximin and maximax criteria?(c) Which project should be chosen on the minimax
A man is mugged and claims that the mugger had red hair. In police investigations of such cases, the victim was able correctly to identify the assailant’s hair colour 80% of the time. Assuming that 10% of the population have red hair, what is the probability that the assailant in this case did,
(a) Your initial belief is that a defendant in a court case is guilty with probability 0.5. A witness comes forward claiming he saw the defendant commit the crime. You know the witness is not totally reliable and tells the truth with probability p. Use Bayes’ theorem to calculate the posterior
A test for AIDS is 99% successful, i.e. if you are HIV+ it will detect it in 99% of all tests, and if you are not, it will again be right 99% of the time. Assume that about 1% of the population are HIV+. You take part in a random testing procedure, which gives a positive result. What is the
A coin is either fair or has two heads. You initially assign probabilities of 0.5 to each possibility. The coin is then tossed twice, with two heads appearing. Use Bayes’ theorem to work out the posterior probabilities of each possible outcome.
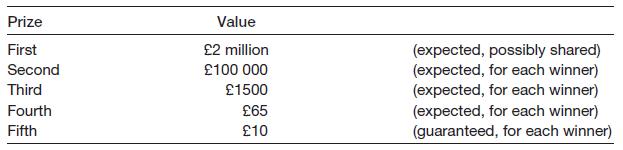
The UK national lottery works as follows. You choose six (different) numbers in the range 1 to 49. If all six come up in the draw (in any order) you win the first prize, expected to be around £2m (which could be shared if someone else chooses the six winning numbers).(a) What is your chance of
The French national lottery works as follows. Six numbers from the range 0 to 49 are chosen at random. If you have correctly guessed all six you win the first prize. What are your chances of winning if you are only allowed to choose six numbers? A single entry like this costs one euro. For 210
An important numerical calculation on a spacecraft is carried out independently by three computers. If all arrive at the same answer it is deemed correct. If one disagrees it is overruled. If there is no agreement then a fourth computer does the calculation and, if its answer agrees with any of the
Manchester United beat Liverpool 4–2 at soccer, but you do not know the order in which the goals were scored. Draw a tree diagram to display all the possibilities and use it to find (a) the probability that the goals were scored in the order L, MU, MU, MU, L, MU, and (b) the probability that the
Which of the following events are independent?(a) A student getting the first two questions correct in a multiple-choice exam.(b) A driver having an accident in successive years.(c) IBM and Dell earning positive profits next year.(d) Arsenal Football Club winning on successive weekends. How is the
Which of the following events are independent?(a) Two flips of a fair coin.(b) Two flips of a biased coin.(c) Rainfall on two successive days.(d) Rainfall on St Swithin’s day and rain one month later.
A four-engine plane can fly as long as at least two of its engines work. A two-engine plane flies as long as at least one engine works. The probability of an individual engine failure is 1 in 1000.(a) Would you feel safer in a four- or two-engine plane, and why? Calculate the probabilities of an
At another stall, you have to toss a coin numerous times. If a head does not appear in 20 tosses you win £1 billion. The entry fee for the game is £100.(a) What are your expected winnings?(b) Would you play?
‘Roll six sixes to win a Mercedes!’ is the announcement at a fair. You have to roll six dice. If you get six sixes you win the car, valued at £20 000. The entry ticket costs £1. What is your expected gain or loss on this game? The organisers of the fair have to take out insurance against the
A newspaper advertisement reads ‘The sex of your child predicted, or your money back!’ Discuss this advertisement from the point of view of (a) the advertiser and (b) the client.
In March 1994 a news item revealed that a London ‘gender’ clinic (which reportedly enables you to choose the sex of your child) had just set up in business. Of its first six births, two were of the ‘wrong’ sex. Assess this from a probability point of view.
Judy is 33, unmarried and assertive. She is a graduate in political science, and involved in union activities and anti-discrimination movements. Which of the following statements do you think is more probable?(a) Judy is a bank clerk.(b) Judy is a bank clerk, active in the feminist movement.
How might you estimate the probability of a corporation reneging on its bond payments?
How might you estimate the probability of Peru defaulting on its debt repayments next year?
(a) Translate the following odds to ‘probabilities’: 13/8, 2/1 on, 100/30.(b) In the 2.45 race at Plumpton on 18/10/94 the odds for the five runners were:Philips Woody ................................ 1/1Gallant Effort .................................. 5/2Satin Noir
‘Odds’ in horserace betting are defined as follows: 3/1 (three-to-one against) means a horse is expected to win once for every three times it loses; 3/2 means two wins out of five races; 4/5 (five to four on) means five wins for every four defeats, etc.(a) Translate the above odds into
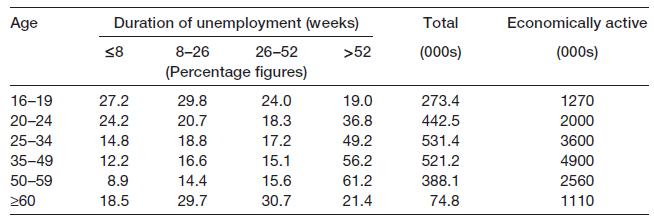
The following data give duration of unemployment by age, in July 1986.The ‘economically active’ column gives the total of employed (not shown) plus unemployed in each age category.(a) In what sense may these figures be regarded as probabilities? What does the figure 27.2 (top-left cell) mean
Given a standard pack of cards, calculate the following probabilities:(a) Drawing an ace;(b) Drawing a court card (i.e. jack, queen or king);(c) Drawing a red card;(d) Drawing three aces without replacement;(e) Drawing three aces with replacement.
Is the employment and unemployment experience of the UK economy worse than that of its competitors? Write a report on this topic in a similar manner to the project above. You might consider rates of unemployment in the UK and other countries; trends in unemployment in each of the countries; the
It has been claimed that, in spite of the UK government’s desire to see lower taxation, the level of taxation in 2000 was higher than in 1979. Is this claim correct? You should gather data which you think appropriate to the task, summarise it as necessary and write a brief report of your
Criticise the following statistical reasoning. Amongst arts graduates 10% fail to find employment. Amongst science graduates only 8% remain out of work. Therefore, science graduates are better than arts graduates. Imagine there are two types of job: popular and unpopular. Arts graduates tend to
Criticise the following statistical reasoning. The average price of a dwelling is £54 150. The average mortgage advance is £32 760. So purchasers have to find £21 390, that is, about 40% of the purchase price. On any basis that is an enormous outlay which young couples, in particular, who are
Demonstrate, using Σ notation, that V(kx) = k2V(x).
Demonstrate, using Σ notation, that E(x + k) = E(x) + k.
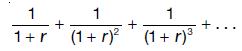
A bond is issued which promises to pay £400 per annum in perpetuity. How much is the bond worth now, if the interest rate is 5%? The sum of an infinite series of the formis 1/r, as long as r > 0.) 1 1 1. 1+r (1+ r) (1+ r)
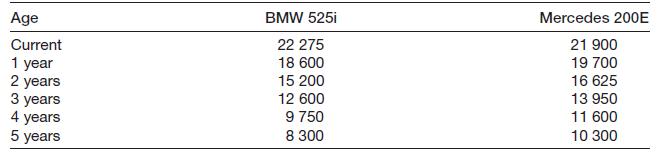
Depreciation of BMW and Mercedes cars is given in the following table:(a) Calculate the average rate of depreciation of each type of car.(b) Use the calculated depreciation rates to estimate the value of the car after 1, 2, etc. years of age. How does this match the actual values?(c) Graph the
A firm purchases for £30 000 a machine which is expected to last for 10 years, after which it will be sold for its scrap value of £3000. Calculate the average rate of depreciation per annum, and calculate the written-down value of the machine after one, two and five years.
(a) A government bond is issued, promising to pay the bearer £1000 in five years’ time. The prevailing market rate of interest is 7%. What price would you expect to pay now for the bond? What would its price be after two years? If, after two years, the market interest rate jumped to 10%, what
How would you expect the following time-series variables to look when graphed?(a) The price level.(b) The inflation rate.(c) The £/$ exchange rate.
How would you expect the following time-series variables to look when graphed? (e.g. Trended? Linear trend? Trended up or down? Stationary? Autocorrelated? Cyclical? Anything else?)(a) Nominal national income.(b) Real national income.(c) The nominal interest rate.
Using the data from Problem 1.14:(a) Calculate the average rate of growth of the series for dwellings.(b) Calculate the standard deviation around the average growth rate.(c) Does the series appear to be more or less volatile than the investment figures used in the chapter? Suggest reasons.Problem
Using the data from Problem 1.13:(a) Calculate the average rate of growth of the series.(b) Calculate the standard deviation around the average growth rate.(c) Does the series appear to be more or less volatile than the investment figures used in the chapter? Suggest reasons.Problem 1.13The
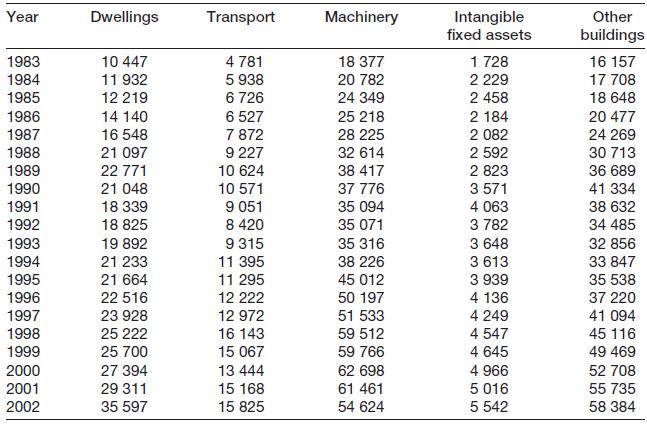
The table below shows the different categories of investment, 1983–2002.Use appropriate graphical techniques to analyse the properties of any one of the investment series. Comment upon the results. Year Dwellings Transport Machinery Intangible fixed assets Other buildings 1983 10 447 4 781 18 377
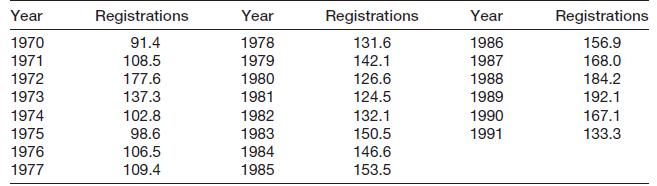
The following data show car registrations in the UK during 1970–91:(a) Draw a time-series graph of car registrations. Comment upon the main features of the series.(b) Draw time-series graphs of the change in registrations, the (natural) log of registrations, and the change in the ln. Comment upon
The average income of a group of people is £8000. 80% of the group have incomes within the range £6000–10 000. What is the minimum value of the standard deviation of the distribution?
On a test taken by 100 students, the average mark is 65, with variance 144. Student A scores 83, student B scores 47.(a) Calculate the z scores for these two students.(b) What is the maximum number of students with a score either better than A’s or worse than B’s?(c) What is the maximum number
Demonstrate that the weighted average calculation given in equation (1.9) in the text is equivalent to finding the total expenditure on education divided by the total number of pupils.Equation (1.9)0.444 × 890 + 0.389 × 1450 + 0.167 × 1910 = 1277.8
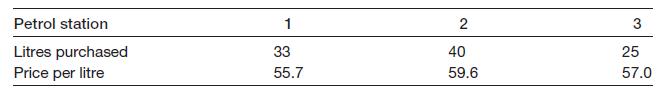
A motorist keeps a record of petrol purchases on a long journey, as follows:Calculate the average petrol price for the journey. Petrol station 1 2 3 Litres purchased Price per litre 33 40 25 55.7 59.6 57.0
Using the data from Problem 1.6:(a) Calculate the mean, median and mode of the distribution. Why do they differ?(b) Calculate the inter-quartile range, variance, standard deviation and coefficient of variation of the data.(c) Calculate the coefficient of skewness of the distribution.Problem 1.6The
Using the data from Problem 1.5:(a) Calculate the mean, median and mode of the distribution. Why do they differ?(b) Calculate the inter-quartile range, variance, standard deviation and coefficient of variation of the data.(c) Calculate the skewness of the distribution.(d) From what you have
The data below show the number of manufacturing plants in the UK in 1991/92 arranged according to employment:Number of employees ....................... Number of firms1– 95 ........................................................... 40910–
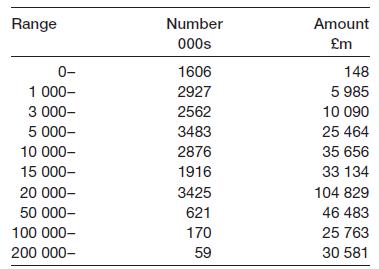
The distribution of marketable wealth in 1979 in the UK is shown in the table below (taken from Inland Revenue Statistics 1981, p. 105):Draw a bar chart and histogram of the data (assume the final class interval has a width of 200 000). Comment on the differences between the two. Comment on any
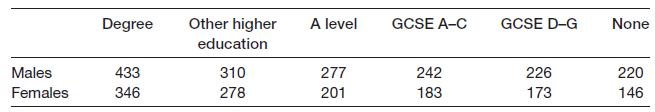
Using the data from Problem 1.2:(a) What is the premium, in terms of median earnings, of a degree over A levels? Does this differ between men and women?(b) Would you expect mean earnings to show a similar picture? What differences, if any, might you expect?Problem 1.2The data below show the median
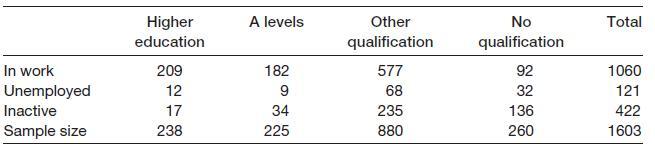
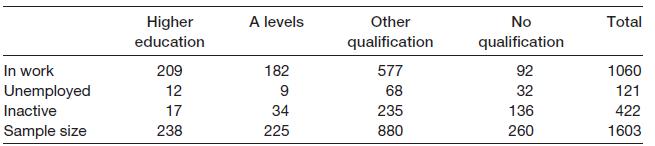
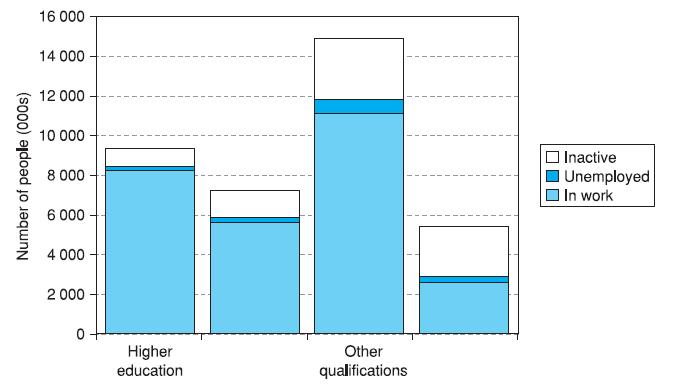
Using the data from Problem 1.1:(a) Which education category has the highest proportion of people in work? What is the proportion?(b) Which category of employment status has the highest proportion of people with a degree? What is the proportion?Problem 1.1The following data show the education and
The data below show the median weekly earnings (in £s) of those in full time employment in Great Britain in 1992, by category of education.(a) In what fundamental way do the data in this table differ from those in Problem 1.1?(b) Construct a bar chart showing male and female earnings by education
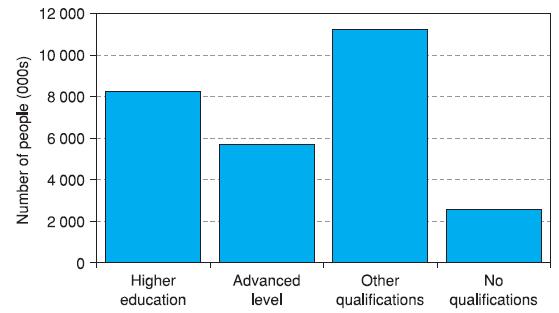
The following data show the education and employment status of women aged 20–29 (from the 1991 General Household Survey):(a) Draw a bar chart of the numbers in work in each education category. Can this be easily compared with the similar diagram for 2003 (Figure 1.1)?(b) Draw a stacked bar chart
Showing 100 - 200
of 197
1
2
Step by Step Answers