New Semester
Started
Get
50% OFF
Study Help!
--h --m --s
Claim Now
Question Answers
Textbooks
Find textbooks, questions and answers
Oops, something went wrong!
Change your search query and then try again
S
Books
FREE
Study Help
Expert Questions
Accounting
General Management
Mathematics
Finance
Organizational Behaviour
Law
Physics
Operating System
Management Leadership
Sociology
Programming
Marketing
Database
Computer Network
Economics
Textbooks Solutions
Accounting
Managerial Accounting
Management Leadership
Cost Accounting
Statistics
Business Law
Corporate Finance
Finance
Economics
Auditing
Tutors
Online Tutors
Find a Tutor
Hire a Tutor
Become a Tutor
AI Tutor
AI Study Planner
NEW
Sell Books
Search
Search
Sign In
Register
study help
statistics
elementary statistics a step by step approach
Elementary Statistics A Step By Step Approach 11th Edition Allan Bluman - Solutions
Find the \(P\)-value when the \(t\) test statistic is 2.983 , the sample size is 6 , and the test is two-tailed.
A physician claims that joggers' maximal volume oxygen uptake is greater than the average of all adults. A random sample of 15 joggers has a mean of 40.6 milliliters per kilogram \((\mathrm{ml} / \mathrm{kg})\) and a standard deviation of \(6 \mathrm{ml} / \mathrm{kg}\). If the average of all
A researcher claims, based on information obtained from the Harper's Index, that \(23 \%\) of Americans say that they dream in black and white. To test the claim, the researcher randomly selected 100 Americans and found that 28 said that they dreamed in black and white. At \(\alpha=0.05\), is there
A report stated that \(31.9 \%\) of babies are delivered by Caesarean section. A researcher believes that the percentage is less than \(31.9 \%\) in a large hospital. The researcher randomly selected 50 newborn infants and found that 13 were born by Caesarean section. At \(\alpha=0.01\), is there
A statistician read that at least \(77 \%\) of the population oppose replacing \(\$ 1\) bills with \(\$ 1\) coins. To see if this claim is valid, the statistician selected a random sample of 80 people and found that 55 were opposed to replacing the \(\$ 1\) bills. At \(\alpha=0.01\), test the claim
An attorney claims that more than \(25 \%\) of all lawyers advertise. A random sample of 200 lawyers in a certain city showed that 63 had used some form of advertising. At \(\alpha=0.05\), is there enough evidence to support the attorney's claim? Use the \(P\)-value method.
Find the critical chi-square value for 15 degrees of freedom when \(\alpha=0.05\) and the test is right-tailed.
Find the critical chi-square value for 10 degrees of freedom when \(\alpha=0.05\) and the test is left-tailed.
Find the critical chi-square values for 22 degrees of freedom when \(\alpha=0.05\) and a two tailed test is conducted.
A psychologist wishes to see if the variance in IQ of 10 counseling patients is less than the variance of the population, which is 225 . The variance of the IQs of the 10 patients was 206 . Test her claim at \(\alpha=0.05\).
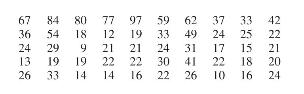
A hospital administrator believes that the standard deviation of the number of people using outpatient surgery per day is greater than 8 . A random sample of 15 days is selected. The data are shown. At \(\alpha=0.10\), is there enough evidence to support the administrator's claim? Assume the
A cigarette manufacturer wishes to test the claim that the variance of the nicotine content of its cigarettes is 0.644 . Nicotine content is measured in milligrams, and assume that it is normally distributed. A random sample of 20 cigarettes has a standard deviation of 1.00 milligram. At
Find the \(P\)-value when \(\chi^{2}=19.274, n=8\), and the test is right-tailed.
Find the \(P\)-value when \(\chi^{2}=3.823, n=13\), and the test is left-tailed.
A researcher knows from past studies that the standard deviation of the time it takes to inspect a car is 16.8 minutes. A random sample of 24 cars is selected and inspected. The standard deviation is 12.5 minutes. At \(\alpha=0.05\), can it be concluded that the standard deviation has changed? Use
A researcher read that the average amount of money stolen in a bank robbery is \(\$ 4330\). The researcher randomly selected 50 recent successful bank robberies and found that the average amount of money taken was \(\$ 4186\), and the standard deviation was \(\$ 362\). Is there enough evidence at
A researcher claims that adult hogs fed a special diet will have an average weight of 200 pounds. A random sample of 10 hogs has an average weight of 198.2 pounds and a standard deviation of 3.3 pounds. At \(\alpha=0.05\), can the claim be rejected? Also, find the \(95 \%\) confidence interval of
The Incredible Edible Egg company recently found that eating eggs does not increase a person’s blood serum cholesterol. Five hundred subjects participated in a study that lasted for 2 years. The participants were randomly assigned to either a no-egg group or a moderate-egg group. The blood serum
You recently received a job with a company that manufactures an automobile antitheft device.To conduct an advertising campaign for the product, you need to make a claim about the number of automobile thefts per year. Since the population of various cities in the United States varies, you decide to
A tobacco company claims that its best-selling cigarettes contain at most 40 mg of nicotine. This claim is tested at the 1% significance level by using the results of 15 randomly selected cigarettes.The mean is 42.6 mg and the standard deviation is 3.7 mg. Evidence suggests that nicotine is
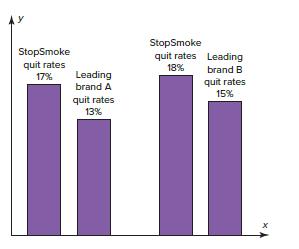
Assume you are part of a research team that compares products designed to help people quit smoking.Condor Consumer Products Company would like more specific details about the study to be made available to the scientific community. Review the following and then answer the questions about how you
Assume that you are working for the Consumer Protection Agency and have recently been getting complaints about the highway gas mileage of the new Dodge Caravans. Chrysler Corporation agrees to allow you to randomly select 40 of its new Dodge Caravans to test the highway mileage. Chrysler claims
Hypothesis testing and testing claims with confidence intervals are two different approaches that lead to the same conclusion. In the following activities, you will compare and contrast those two approaches.Assume you are working for the Consumer Protection Agency and have recently been getting
An adult has on average 5.2 liters of blood. Assume the variable is normally distributed and has a standard deviation of 0.3 . Find the percentage of people who have less than 5.4 liters of blood in their system.
Each month, an American household generates an average of 28 pounds of recyclable paper waste. Assume the variable is approximately normally distributed and the standard deviation is 2 pounds. If a household is selected at random, find the probability of its generatinga. Between 27 and 31 pounds
The average weight of the human male brain is 3.08 pounds. Assume the variable is approximately normally distributed, and the population standard deviation is 0.3 pounds. If 50 males are randomly selected, approximately how many will weigh less than 2.96 pounds?
To qualify for a police academy, candidates must score in the top \(10 \%\) on a general abilities test. Assume the test scores are normally distributed and the test has a mean of 200 and a standard deviation of 20. Find the lowest possible score to qualify.
For a medical study, a researcher wishes to select people in the middle \(60 \%\) of the population based on blood pressure. Assuming that blood pressure readings are normally distributed and the mean systolic blood pressure is 120 and the standard deviation is 8a. What is the blood pressure for
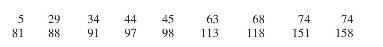
A survey of 18 high-tech firms showed the number of days' inventory they had on hand. Determine if the data are approximately normally distributed. 5 29 34 44 45 63 68 74 74 81 88 91 97 98 113 118 151 158
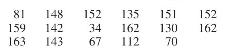
The data shown consist of the number of games played each year in the career of Baseball Hall of Famer Bill Mazeroski. Determine if the data are approximately normally distributed. 81 148 152 135 151 152 159 142 34 162 130 162 163 143 67 112 70
A. C. Neilsen reported that children between the ages of 2 and 5 watch an average of 25 hours of television per week. Assume the variable is normally distributed and the standard deviation is 3 hours. If 20 children between the ages of 2 and 5 are randomly selected, find the probability that the
A recent study found that an American skips breakfast on average 50 times a year. Assume the standard deviation is 4. If a random sample of 36 Americans is selected, find the probability that the mean of the sample is between 48 and 51 times.
The average time spent by construction workers who work on weekends is 7.93 hours (over 2 days). Assume the distribution is approximately normal and has a standard deviation of 0.8 hour.a. Find the probability that an individual who works at that trade works fewer than 8 hours on the weekend.b. If
It has been reported that last year \(25 \%\) of drivers have fallen asleep at the wheel. If 200 drivers are selected at random, find the probability that 62 will say that they have fallen asleep while driving.
Ten percent of Americans are allergic to ragweed. If a random sample of 200 people is selected, find the probability that 10 or more will be allergic to ragweed.
A recent survey found that \(40 \%\) of students in college change their major field at least once in their college careers. Find the probability that in a random sample of 100 college students, at most 36 will change their major in their careers.
When \(n=10\) and \(p=0.5\), use the binomial distribution table (Table A-2 in Appendix A) to find the probability that \(X=6\). Then use the normal approximation to find the probability that \(X=6\).
Many times in statistics it is necessary to see if a set of data values is approximately normally distributed. There are special techniques that can be used. One technique is to draw a histogram for the data and see if it is approximately bell-shaped. (Note; It does not have to be exactly symmetric
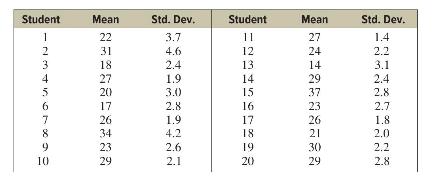
Twenty students from a statistics class each collected a random sample of times on how long it took students to get to class from their homes. All the sample sizes were 30. The resulting means are listed.1. The students noticed that everyone had different answers. If you randomly sample over and
Assume one of your favorite activities is mountain climbing. When you go mountain climbing, you have several safety devices to keep you from falling. You notice that attached to one of your safety hooks is a reliability rating of \(97 \%\). You estimate that throughout the next year you will be
Assume you are thinking about starting a Mensa chapter in your hometown, which has a population of about 10,000 people. You need to know how many people would qualify for Mensa, which requires an IQ of at least 130. You realize that IQ is normally distributed with a mean of 100 and a standard
A researcher wishes to estimate the number of times a person skips breakfast during the year. A random sample of 49 people had a mean of 50. Assume the population standard deviation is 2.6. Find the best point estimate of the mean and the \(95 \%\) confidence interval for the population mean.
A nutritionist wanted to find the average amount of candy consumed per year by adult Americans. The nutritionist selected a random sample of 60 adults to study. The sample mean was 23.9 pounds of candy consumed per year. Assume the population standard deviation is 4.8. Find the best point estimate
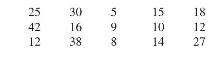
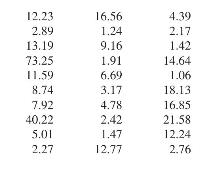
The following data represent a random sample of the assets (in millions of dollars) of 30 credit unions in southwestern Pennsylvania. Assume the population standard deviation is 14.405 . Find the \(90 \%\) confidence interval of the mean. 12.23 16.56 4.39 2.89 1.24 2.17 13.19 9.16 1.42 73.25 1.91
A sociologist wishes to estimate the average number of automobile thefts in a large city per day within 2 automobiles. He wishes to be \(99 \%\) confident, and from a previous study the standard deviation was found to be 4.2. How many days should he select to survey?
Find the \(t_{\alpha / 2}\) value for a \(95 \%\) confidence interval when the sample size is 22 .
A random sample of 16 cats had a mean life expectancy of 15.3 years. The standard deviation of the sample was 2.3 years. Assume the variable is normally distributed. Find the \(95 \%\) confidence interval of the population mean life expectancy of cats.
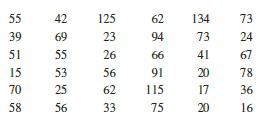
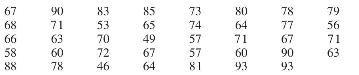
The data represent a random sample of the number of home fires started by candles for the past several years. (Data are from the National Fire Protection Association.) Find the \(99 \%\) confidence interval for the mean number of home fires started by candles each year.\[\begin{array}{lllllll}5460
A random sample of 150 assault victims in a large city found that 45 took no selfprotection actions against the criminal. Find \(\hat{p}\) and \(\hat{q}\), where \(\hat{p}\) is the proportion of victims who took no self-protection action against the criminal.
A survey conducted by Sallie Mae and Gallup of 1404 respondents found that 323 students paid for their education by student loans. Find the \(90 \%\) confidence interval of the true proportion of students who paid for their education by student loans.
A survey of 6000 adults found that \(58 \%\) say that they would take a ride in a fully selfdriving car. Find the \(90 \%\) confidence interval of the true proportion who said that they would take a ride in a self-driving car.
A researcher wishes to estimate, with \(95 \%\) confidence, the proportion of people who did not have a land line phone. A previous study shows that \(40 \%\) of those interviewed did not have a land line phone. The researcher wishes to be accurate within \(2 \%\) of the true proportion. Find the
assume that no previous study was done. Find the minimum sample size necessary to be accurate within \(2 \%\) of the true population.
Find the values for \(\chi_{\text {right }}^{2}\) and \(\chi_{\text {left }}^{2}\) for a \(90 \%\) confidence interval when \(n=25\).
A study of 30 automobile owners found that the standard deviation of the ages of their automobiles is 1.7 years. Find the \(95 \%\) confidence interval of the variance and standard deviation of the ages. Assume the variable is normally distributed.
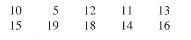
Find the \(90 \%\) confidence interval for the variance and standard deviation for the number of named storms per year in the Atlantic basin. A random sample of 10 years has been used. Assume the distribution is approximately normal. 10 5 12 11 13 15 19 18 14 16
Shown are the ages (in years) of the Presidents at the times of their deaths.1. Do the data represent a population or a sample?2. Select a random sample of 12 ages and find the variance and standard deviation,3. Find the \(95 \%\) confidence interval of the standard deviation.4. Find the standard
A researcher wishes to see if there is a difference between the dropout rate of students who attend two-year colleges and the dropout rate of students who attend four-year colleges. The researcher randomly selects 1000 students, ages 20-23, from each type of college and finds that the dropout rate
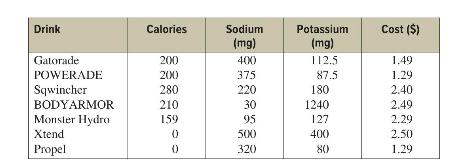
Assume you get a new job as a coach for a sports team, and one of your first decisions is to choose the sports drink that the team will use during practices and games. You obtain a Sports Report magazine so you can use your statistical background to help you make the best decision. The following
Assume you work for a corporation that makes facial tissues. The job you are presently working on requires you to decide how many tissues are to be put in the new automobile glove compartment boxes. Complete the following.1. How will you decide on a reasonable number of tissues to put in the
1. Do you feel that your population should be limited to a select group of workers such as government employees, hospital workers, teachers, fast-food workers, etc.?2. What type of sample would you use?3. How large a sample do you think you should have?4. Would you use a point estimate or an
State the null and alternative hypotheses for each conjecture.a. A researcher thinks that the average amount of sugar consumed by an adult is less than 147 pounds per year.b. A researcher feels that the average age a person gives up driving an automobile is greater than 85 years old.c. A researcher
Using Table A-4 in Appendix A, find the critical value(s) for each situation and draw the appropriate figure, showing the critical region.a. A left-tailed test with \(\alpha=0.10\).b. A two-tailed test with \(\alpha=0.02\).c. A right-tailed test with \(\alpha=0.005\).
A researcher believes that the average number of hours a person spends in traffic each year is more than the national average of 46 (Texas Transportation Institute). Assume the population standard deviation is 3.6 years. A random sample of 30 subjects is selected and the mean time of the sample is
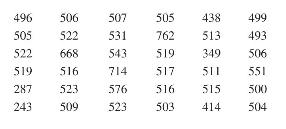
For a specific year, the average score on the SAT Math test was 515.* The variable is normally distributed, and the population standard deviation is 100. A school superintendent wishes to see if her students scored significantly below the national average on the test. She randomly selected 36
Construct a probability distribution for rolling a single die.
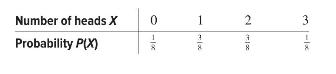
Represent graphically the probability distribution for the sample space for tossing three coins. Number of heads X Probability P(X) 0 2 -1x 3
A company employs 25 salespeople. During a randomly selected week, 5 people made 2 sales, 11 people made 3 sales, 6 people made 4 sales, and 3 people made 5 sales. Construct a probability distribution for the number of sales employees made for the week.
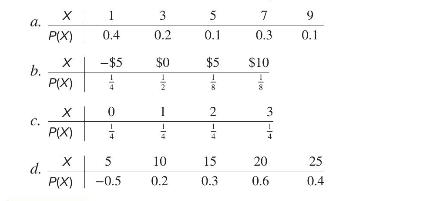
Determine whether each distribution is a probability distribution. X 1 3 5 7 9 a. P(X) 0.4 0.2 0.1 0.3 0.1 X -$5 $0 $5 $10 b. P(X) AP
Find the mean of the number of spots that appear when a die is tossed.
A very old water system in a manufacturing plant has 4 independent valves that have a \(50 \%\) chance of working correctly over a year. The valves are checked yearly to make sure a valve is either bad (B) or good (G). Find the mean number of good valves in the system.
If three coins are tossed, find the mean of the number of heads that occur.
Find the mean for the number of successful sales per person per week.
Compute the variance and standard deviation for the probability distribution.
A box contains 5 balls. Two are numbered 3, one is numbered 4, and two are numbered 5 . The balls are mixed and one is selected at random. After a ball is selected, its number is recorded. Then it is replaced. If the experiment is repeated many times, find the variance and standard deviation of the
On a randomly selected day, 25 people were found guilty of illegally selling various drugs. Nine had no prior sentences. Six had one prior sentence. Five had two prior sentences. Three had three prior sentences, and two had four prior sentences. Find the variance and standard deviation of the
One thousand tickets are sold at \(\$ 1\) each for a smart television valued at \(\$ 750\). What is the expected value of the gain if you purchase one ticket?
Poker chips are numbered \(\$ 1, \$ 5, \$ 10, \$ 20\), and \(\$ 50\). Four chips are numbered \(\$ 1\). Two chips are numbered \(\$ 5\). Two chips are numbered \(\$ 10\). One chip is numbered \(\$ 20\). One chip is numbered \(\$ 50\). If one chip is selected at random, find the expected value of
A financial adviser suggests that his client select one of two types of bonds in which to invest \(\$ 5000\). Bond \(X\) pays a return of \(4 \%\) and has a default rate of \(2 \%\). Bond \(Y\) has a \(2 \frac{1}{2} \%\) return and a default rate of \(1 \%\). Find the expected rate of return and
Decide whether each experiment is a binomial experiment. If not, state the reason why.a. Selecting 20 university students and recording their class rankb. Selecting 20 students from a university and recording if they live on campusc. Drawing five cards from a deck without replacement and recording
A coin is tossed 3 times. Find the probability of getting exactly two heads.
A survey found that 2 out of 5 households own a dog. If 10 households are selected at random, find the probability that exactly two households will own a dog.
A survey from Teenage Research Unlimited (Northbrook, Illinois) found that \(30 \%\) of teenage consumers receive their spending money from part-time jobs. If 5 teenagers are selected at random, find the probability that at least 3 of them will have part-time jobs.
Solve the problem in Example 5-16 by using Table A-2.Example 5-16A coin is tossed 3 times. Find the probability of getting exactly two heads.
Public Opinion reported that 5\% of Americans are afraid of being alone in a house at night. If a random sample of 20 Americans is selected, find these probabilities by using the binomial table in Appendix A.a. There are exactly 5 people in the sample who are afraid of being alone at night.b. There
A report from the Secretary of Health and Human Services stated that \(70 \%\) of single vehicle traffic fatalities that occur on weekend nights involve an intoxicated driver. If a random sample of 20 drivers is selected, find the probability that between 10 and 15 , inclusive, accidents involve
A coin is tossed 4 times. Find the mean, variance, and standard deviation of the number of heads that will be obtained.
An 8 -sided die (with numbers 1 through 8 on the faces) is rolled 480 times. Find the mean, variance, and standard deviation of the number of \(3 \mathrm{~s}\) that will be rolled.
The Sourcebook of Criminal Justice Statistics states that \(65 \%\) of Americans favor sentencing drunk drivers to jail even if they have not caused an accident. If a random number of 1000 individuals is selected, find the mean, variance, and standard deviation of the people who feel this way.
A random survey of Facebook users found that the probability a user visits the site on a daily basis are \(1,2,3\), or 4 times are \(0.4,0.3,0.25\), and 0.05 . If 8 customers are selected, find the probabilities that 3 will visit the site once, 2 will the site two times, 2 will visit the site three
A small airport coffee shop manager found that the probabilities a customer buys 0,1 , 2 , or 3 cups of coffee are \(0.3,0.5,0.15\), and 0.05 , respectively. If 8 customers enter the shop, find the probability that 2 will purchase something other than coffee, 4 will purchase 1 cup of coffee, 1 will
A box contains 4 white balls, 3 red balls, and 3 blue balls. A ball is selected at random, and its color is written down. It is replaced each time. Find the probability that if 5 balls are selected, 2 are white, 2 are red, and 1 is blue.
If there are 200 typographical errors randomly distributed in a 500-page manuscript, find the probability that a given page contains exactly 3 errors.
A sales firm receives, on average, 3 calls per hour on its toll-free number. For any given hour, find the probability that it will receive the following.a. At most 3 callsb. At least 3 callsc. 5 or more calls
If approximately \(2 \%\) of the people in a room of 200 people are left-handed, find the probability that exactly 5 people there are left-handed.
Ten people apply for a job as assistant manager of a restaurant. Five have completed college and five have not. If the manager selects 3 applicants at random, find the probability that all 3 are college graduates.
A recent survey found that 3 out of 10 dog owners said that their dogs were pudgy. If 5 dog owners are randomly selected, find the probability that exactly 2 will say that their dog is pudgy.
A lot of 12 compressor tanks is checked to see whether there are any defective tanks. Three tanks are checked for leaks. If 1 or more of the 3 is defective, the lot is rejected. Find the probability that the lot will be rejected if there are actually 3 defective tanks in the lot.
A die is rolled repeatedly. Find the probability of getting a 6 on the fourth roll.
In the United States, approximately \(42 \%\) of people have type A blood. If 4 people are selected at random, find the probability that the fourth person is the first one selected with type A blood.
Showing 100 - 200
of 1910
1
2
3
4
5
6
7
8
9
10
11
12
13
14
15
Last
Step by Step Answers