New Semester
Started
Get
50% OFF
Study Help!
--h --m --s
Claim Now
Question Answers
Textbooks
Find textbooks, questions and answers
Oops, something went wrong!
Change your search query and then try again
S
Books
FREE
Study Help
Expert Questions
Accounting
General Management
Mathematics
Finance
Organizational Behaviour
Law
Physics
Operating System
Management Leadership
Sociology
Programming
Marketing
Database
Computer Network
Economics
Textbooks Solutions
Accounting
Managerial Accounting
Management Leadership
Cost Accounting
Statistics
Business Law
Corporate Finance
Finance
Economics
Auditing
Tutors
Online Tutors
Find a Tutor
Hire a Tutor
Become a Tutor
AI Tutor
AI Study Planner
NEW
Sell Books
Search
Search
Sign In
Register
study help
statistics
elementary statistics a step by step approach
Elementary Statistics 9th Edition Neil A Weiss - Solutions
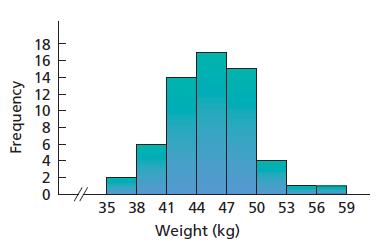
Malnutrition and Poverty. R. Reifen et al. studied various nutritional measures of Ethiopian school children and published their findings in the paper “Ethiopian-Born and Native Israeli School Children Have Different Growth Patterns” (Nutrition, Vol. 19, pp. 427–431). The study, conducted in
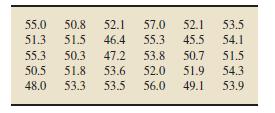
As reported by the U.S. Census Bureau in Educational Attainment in the United States, the percentage of adults each state and the District of Columbia who have completed a bachelor’s degree is provided on the WeissStats site. Applythe technology of your choice to construct a stem-and-leaf
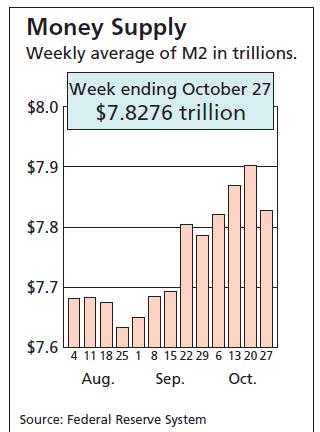
The Federal Reserve System publishes weekly figures of M2 money supply in the document Money Stock Measures. M2 includes such things as cash in circulation, deposits in checking accounts, nonbank traveler’s checks, accounts such as savings deposits, and money-market mutual funds. The following
In the Exercise, we have provided simple data sets for you to practice finding the descriptive measures discussed in this section. For each data set,a. Obtain the quartiles.b. Determine the interquartile range.c. Find the five-number summary.1, 2, 3, 4, 5
In the Exercise, we have provided simple data sets for you to practice finding the descriptive measures discussed in this section. For each data set,a. Obtain the quartiles.b. Determine the interquartile range.c. Find the five-number summary.1, 2, 3, 4, 1, 2, 3, 4
State pertinent properties of boxplots for symmetric, left skewed, and right-skewed distributions.
Give one reason why constructing and reading graphs and charts carefully is important
Suppose that a variable of a population has a reverse-J-shaped distribution and that two simple random samples are taken from the population.a. Would you expect the distributions of the two samples to have roughly the same shape? If so, what shape?b. Would you expect some variation in shape for the
Definea. Descriptive measures.b. Measures of center.c. Measures of variation.
In Exercises, we have provided simple data sets for you to practice the basics of finding measures of center. For each data set, determine thea. Mean b. Median. c. Mode(s).3, 5, 7
We have provided simple data sets for you to practice the basics of finding measures of center. For each data set, determine thea. Mean b. Median. c. Mode(s).2, 5, 0, −1
Consider these sample data: x1 = 12, x2 = 8, x3 = 9, x4 = 17.a. Find n. b. Compute Σxi. c. Determine x̄
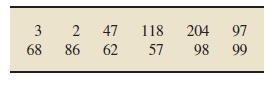
Each year, tornadoes that touch down are recorded by the Storm Prediction Center and published in Monthly Tornado Statistics. The following table gives the number of tornadoes that touched down in the United States during each month of one year. 3 2 47 118 68 86 62 57 204 97 98 99
The mean number of tornado touchdowns is calculated by first summing all 12 data values presented, which results in 941, and then dividing this sum by 12. Thus, the mean is 78.4. This figure is already rounded to one more decimal place than the original data. Calculating the median requires
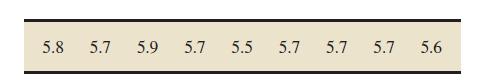
In Exercises, determine the range and sample standard deviation for each of the data sets. For the sample standard deviation, round each answer to one more decimal place than that used for the observations.In a study of the effects of radiation on amphibian embryos titled “Shedding Light on
In Exercises, determine the range and sample standard deviation for each of the data sets. For the sample standard deviation, round each answer to one more decimal place than that used for the observations.Each year, tornadoes that touch down are recorded by the Storm Prediction Center and
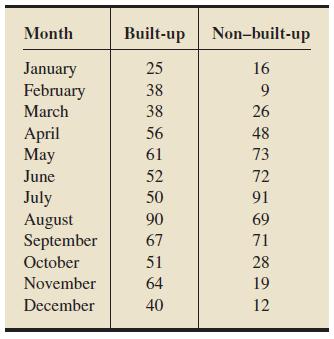
The Scottish Executive, Analytical Services Division Transport Statistics, compiles data on motorcycle casualties. During one year, monthly casualties resulting from motorcycle accidents in Scotland for built-up roads and non– built-up roads were as follows.a. Without doing any
In each of the Exercises, use the technology of your choice to determine and interpret the range and sample standard deviation for those data sets to which those concepts apply. If those concepts don’t apply, explain why. The Japan Automobile Manufacturer’s Association provides data on
Discuss the pros and cons of Chebyshev’s rule.
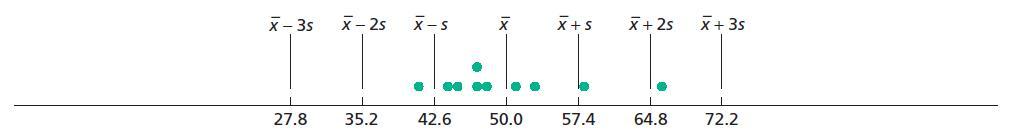
Consider the following data set.a. Draw a graph similar to Fig. 3.5.Fig. 3.5b. Compare the percentage of the observations that actually lie within two standard deviations to either side of the mean with that given by Chebyshev’s rule with k = 2.c. Repeat part (b) with k = 3. X-3s 27.8 x-2s X-S X
The quantitative data set under consideration has roughly a bell-shaped distribution. Apply the empirical rule to solve each exercise.The data set has size 50. Approximately how many observation lie within one standard deviation to either side of the mean?
In each of the Exercises, the quantitative data set under consideration has roughly a bell-shaped distribution. Apply the empirical rule to solve each exercise.The data set has 80 observations and has mean 30 and standard deviation 5. Approximately how many observations lie between 20 and 40?
The quantitative data set under consideration has roughly a bell-shaped distribution. Apply the empirical rule to solve each exercise.The data set has 250 observations and has mean 100 and standard deviation 16. Approximately how many observations lie between 52 and 148?
In each of the Exercises, the quantitative data set under consideration has roughly a bell-shaped distribution. Apply the empirical rule to solve each exercise.The data set has 150 observations and has mean 35 and standard deviation 4. Approximately how many observations lie between 31 and 39?
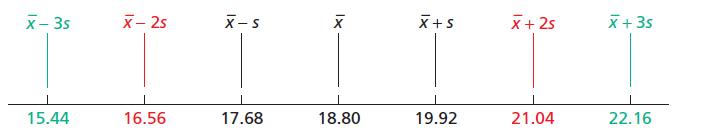
In each of the Exercises, the quantitative data set under consideration has roughly a bell-shaped distribution. For each exercise,a. Construct a graph similar to Fig. 3.8.b. Apply Property 1 of the empirical rule to make pertinent statements about the observations in the sample.c. Repeat part (b)
In each of the Exercises, the quantitative data set under consideration has roughly a bell-shaped distribution. For each exercise,a. Construct a graph similar to Fig. 3.8.b. Apply Property 1 of the empirical rule to make pertinent statements about the observations in the samplec. Repeat part (b)
In the Exercise, we have provided simple data sets for you to practice finding the descriptive measures discussed in this section. For each data set,a. Obtain the quartiles.b. Determine the interquartile range.c. Find the five-number summary.1, 2, 3, 4
Which measure of variation is preferred whena. The mean is used as a measure of center?b. The median is used as a measure of center?
Use the technology of your choice to perform the following tasks.a. Decide whether finding a regression line for the data is reasonable. If so, then also do parts (b)–(d).b. Obtain the coefficient of determination.c. Determine the percentage of variation in the observed values of the response
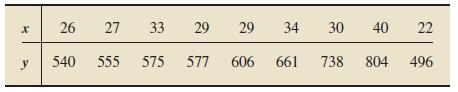
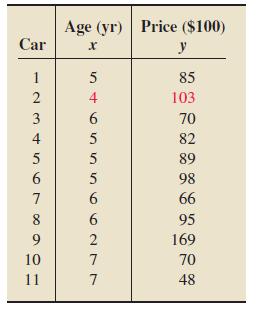
Following are the age and price data for Corvettes from Exercise 4.59:Use the technology of your choice to perform the following tasks.a. Decide whether finding a regression line for the data is reasonable. If so, then also do parts (b)–(d).b. Obtain the coefficient of determination.c. Determine
Following are the size and price data for custom homes from Exercises 4.60 and 4.100.Use the technology of your choice to perform the following tasks.a. Decide whether finding a regression line for the data is reasonable. If so, then also do parts (b)–(d).b. Obtain the coefficient of
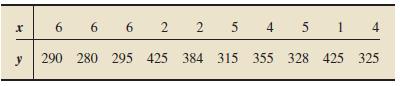
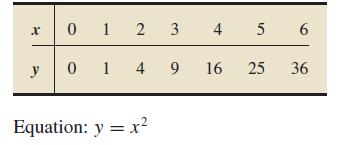
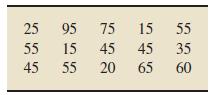
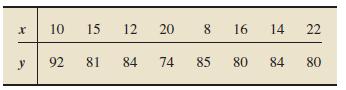
Perform the following tasks.a. Compute the linear correlation coefficient, r.b. Can you conclude from your answer in part (a) that the variables x and y are linearly related? Explain your answer.c. Draw a scatterplot for the data.d. Is use of the linear correlation coefficient as a descriptive
Determine and sketch the area under the standard normal curve that liesa. To the left of −3.02. b. To the right of 0.61.c. Between 1.11 and 2.75. d. between −2.06 and 5.02.e. Between −4.11 and −1.5.f. Either to the left of 1 or to the right of 3.
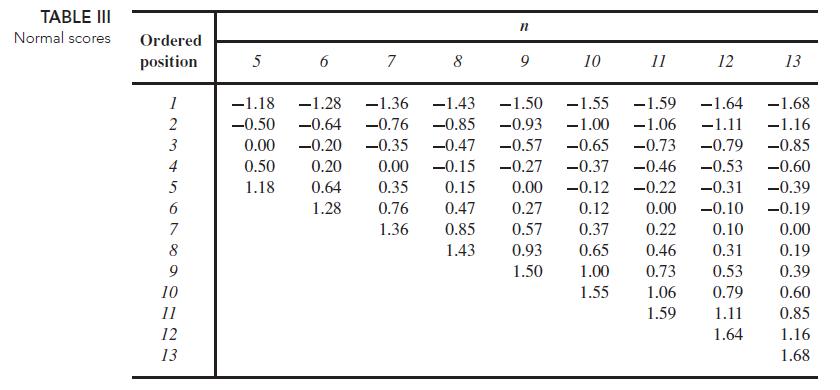
The Wireless Association collects data on cell phones and publishes the results in the Semi-annual Wireless Survey. A sample of 15 monthly cell phone bills gave the following data (to the nearest dollar).a. Use Table III in Appendix A to construct a normal probability plot of the given data.b. Use
In the article “Distribution of Oxygen in Surface Sediments from Central Sagami Bay, Japan: In Situ Measurements by Microelectrodes and Planar Optodes” R. Glud et al. explored the distributions of oxygen in surface sediments from central Sagami Bay. The oxygen distribution gives important
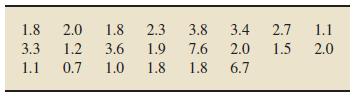
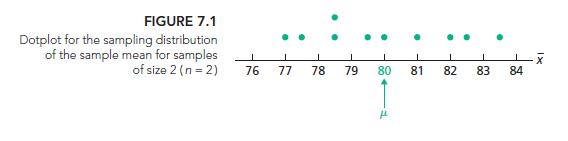
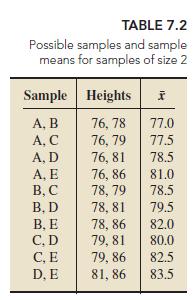
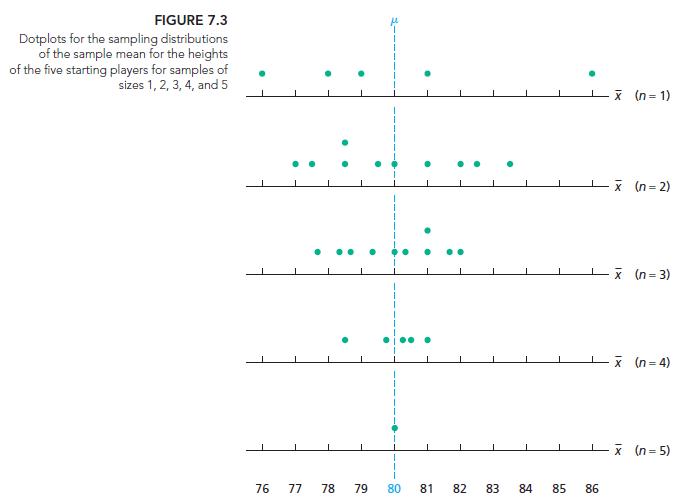
We have given population data for a variable. For each exercise, do the following tasks.a. Find the mean, μ, of the variable.b. For each of the possible sample sizes, construct a table similar to Table 7.2 and draw a dotdot plotr the sampling distribution of the sample mean similar to Fig. 7.1.c.
Refer to Exercise 9.22. Explain what each of the following would mean.a. Type I error b. Type II error c. Correct decision Now suppose that the results of carrying out the hypothesis test lead to nonrejection of the null hypothesis. Classify that conclusion by error type or as a correct
We have given the value obtained for the test statistic, z, in a one-mean z-test. We have also specified whether the test is two-tailed, left-tailed, or right-tailed. Determine the P-value in each case and decide whether, at the 5% significance level, the data provide sufficient evidence to reject
In a classic study, described by F. Yates in The Design and Analysis of Factorial Experiments (Commonwealth Bureau of Soils, Technical Communication No. 35), the effect on oat yield was compared for three different varieties of oats and four different concentrations of manure (0, 0.2, 0.4, and 0.6
In Exercise, we have drawn a smooth curve that represents a distribution. In each case, do the following:a. Identify the shape of the distribution with regard to modality.b. Identify the shape of the distribution with regard to symmetry (or non-symmetry).
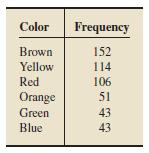
In the article “Sweetening Statistics—What M&M’s Can Teach Us” (Minitab Inc., August 2008), M. Paret and E. Martz discussed several statistical analyses that they performed on bags of M&Ms. The authors took a random sample of 30 small bags of peanutM&Msand obtained the following
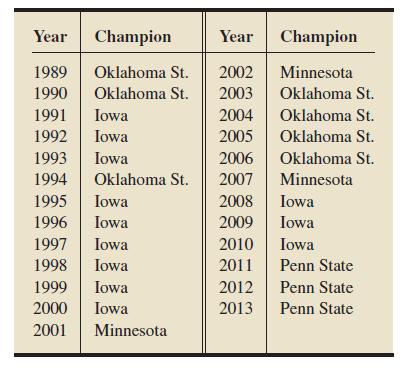
From NCAA.com—the official Web site for NCAA sports—we obtained the National Collegiate Athletic Association wrestling champions for the years 1989–2013 in the document “Championship History”. They are displayed in the following table.We have presented a frequency distribution of
Observing that the proportion of blue M&Ms in his bowl of candy appeared to be less than that of the other colors, R. Fricker, Jr., decided to compare the color distribution in randomly chosen bags of M&Ms to the theoretical distribution reported by M&M/MARS consumer affairs. Fricker
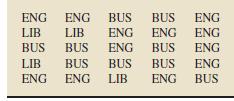
The following table provides data on college for the students in one section of the course Introduction to Computer Science during one semester at Arizona State University. In the table, we use the abbreviations BUS for Business, ENG for Engineering and Applied Sciences, and LIB for Liberal Arts
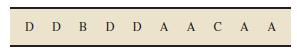
In Exercise, we have presented some simple qualitative data sets for practicing the concepts. For each data set,a. Determine a frequency distribution.b. Obtain a relative-frequency distribution.c. Draw a pie chart.d. Construct a bar chartIn one Winter Olympics, Michelle Kwan competed in the Short
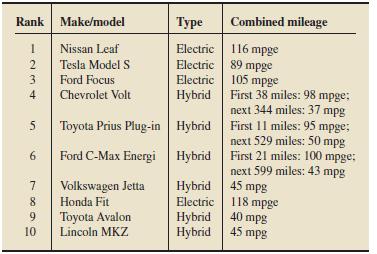
The following table presents information on the Kelley Blue Book’s “10 Best Green Cars of 2013.” Note that mpg and mpge are abbreviations for miles per gallon and miles per gallon equivalent, respectively. Identify the type of data provided by the information in each column of the
In Exercises, we have provided simple data sets for you to practice the basics of finding measures of center. For each data set, determine thea. Mean b. Medianc. Mode(s).3, 5, 7
The members of a population have been numbered 1–1000. A sample of size 20 is to be taken from the population, using stratified random sampling with proportional allocation. The strata are of sizes 300, 200, 400, and 100, where stratum #1 consists of the members of the population numbered
The members of a population have been numbered 1–100. A sample of size 30 is to be taken from the population, using cluster sampling. The clusters are of equal size 10, where cluster #1 consists of the members of the population numbered 1–10, cluster #2 consists of the members of the population
The members of a population have been numbered 1–50. A sample of size 20 is to be taken from the population, using cluster sampling. The clusters are of equal size 10, where cluster #1 consists of the members of the population numbered 1–10, cluster #2 consists of the members of the population
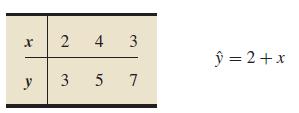
We repeat the information from exercise.a. Decide, at the 10% significance level, whether the data provide sufficient evidence to conclude that x is useful for predicting y.b. Find a 90% confidence interval for the slope of the population regression line. x 2 4 y نیا 3 5 7 j=2+x
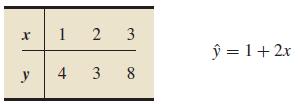
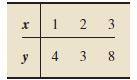
We repeat the data and provide the sample regression equations.a. Determine the standard error of the estimate.b. Construct a residual plot.c. Construct a normal probability plot of the residuals. X 1 2 3 4 3 8 y ŷ = 1 + 2x
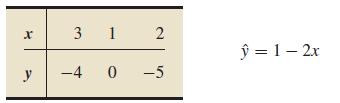
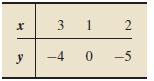
We repeat the data and provide the sample regression equations.a. Determine the standard error of the estimate.b. Construct a residual plot.c. Construct a normal probability plot of the residuals. X y 31 2 -4 0 -5 ŷ = 1-2x
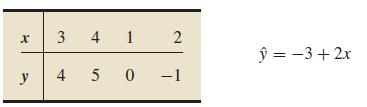
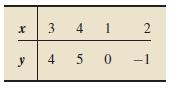
We repeat the data and provide the sample regression equations.a. Determine the standard error of the estimate.b. Construct a residual plot.c. Construct a normal probability plot of the residuals. 20 x 34 1 y 2 4 5 0 -1 y = -3 + 2x
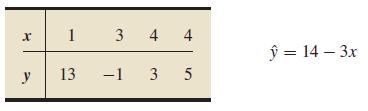
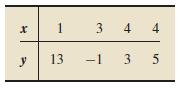
We repeat the data and provide the sample regression equations.a. Determine the standard error of the estimate.b. Construct a residual plot.c. Construct a normal probability plot of the residuals. X y TA 1 13 3 4 4 -1 3 5 ŷ = 14 - 3x
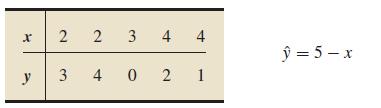
We repeat the data and provide the sample regression equations.a. Determine the standard error of the estimate.b. Construct a residual plot.c. Construct a normal probability plot of the residuals. x | 2 2 3 یا نیا 3 4 4 4021 x - 5 = ژ
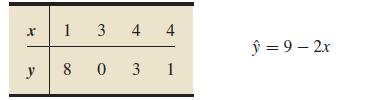
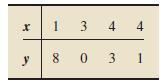
We repeat the data and provide the sample regression equations.a. Determine the standard error of the estimate.b. Construct a residual plot.c. Construct a normal probability plot of the residuals. x 1 3 4 4 803 y 1 ŷ = 9-2x
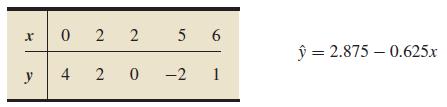
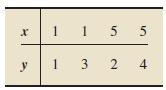
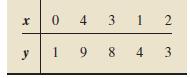
We repeat the data and provide the sample regression equations.a. Determine the standard error of the estimate.b. Construct a residual plot.c. Construct a normal probability plot of the residuals. y 022 5 6 2 0 -2 1 4 ŷ 2.875 0.625x
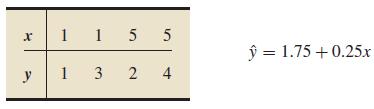
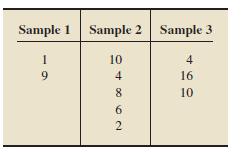
We repeat the data and provide the sample regression equations.a. Determine the standard error of the estimate.b. Construct a residual plot.c. Construct a normal probability plot of the residuals. x 1 1 y 1 3 5 5 324 ŷ = 1.75 +0.25x
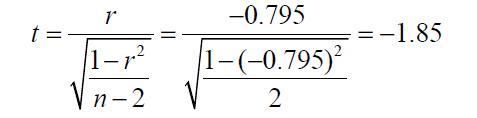
We repeat the data and specify an alternative hypothesis for a correlation t-test. For each exercise, decide, at the 10% significance level, whether the data provide sufficient evidence to reject the null hypothesis in favor of the alternative hypothesis. t= r 1-r Vn-2 -0.795 1-(-0.795)² 2 -1.85
The data from Exercise 14.34 for number of birdies during a tournament and final score for 63 women golfers are on the WeissStats site.Exercise 14.34How important are birdies (a score of one under par on a given hole) in determining the final total score of a woman golfer? From the U.S. Women’s
Name three common discrete probability distributions other than the binomial distribution.
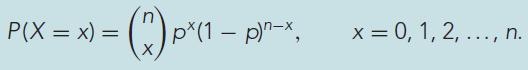
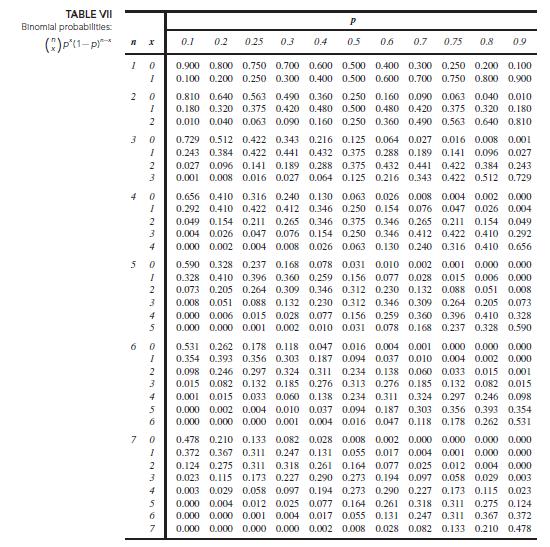
We have provided the number of trials and success probability for Bernoulli trials. Let X denote the total number of successes. Determine the required probabilities by using a. The binomial probability formula, Formula 5.4. Round your probability answers to three places.b. Table VII in
Exercises are intended solely to provide concrete illustrations of the sampling distribution of the sample mean. For that reason, the populations considered are unrealistically small. In each exercise, assume that sampling is without replacement. Repeat parts (b)–(e) of Exercise 7.11 for
Refer to Exercise 8.77.a. The mean number of days that 30 adolescents in substance abuse treatment used medical marijuana in the last 6 months was 105.43. Find a 95% confidence interval for μ based on that data.b. Compare the 95% confidence intervals obtained here and in Exercise 8.77(a) by
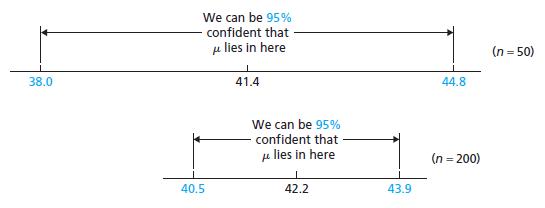
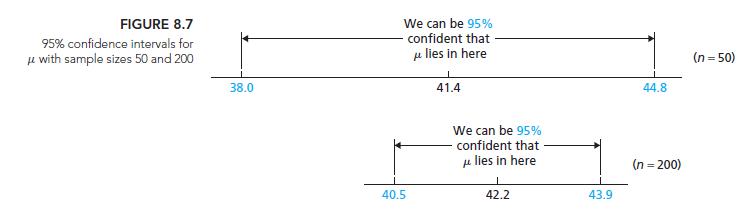
Refer to Exercise 8.78.a. The mean duration for a sample of 612 dives was 322 seconds. Find a 99% confidence interval for μ based on that data.b. Compare the 99% confidence intervals obtained here and in Exercise 8.78(b) by drawing a graph similar to Fig. 8.7 on page 327.c. Compare the
In each of Exercise, we have presented a confidence interval (CI) for the difference, μ1 − μ2, between two population means. Interpret each confidence interval.99% CI is from −10 to 5.
We have given a likely range for the observed value of a sample proportion P̂.a. Based on the given range, identify the educated guess that should be used for the observed value of P̂ to calculate the required sample size for a prescribed confidence level and margin of error.b. Identify the
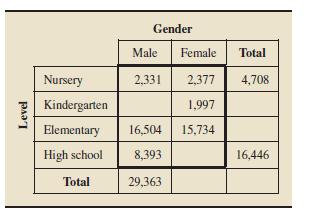
Refer to Exercise 12.48. For students below postsecondary, solve the following problems.a. Determine the conditional distribution of level for each gender.b. Determine the marginal distribution of level.c. Are the variables “gender” and “level” associated? Explain your answer.d. Find the
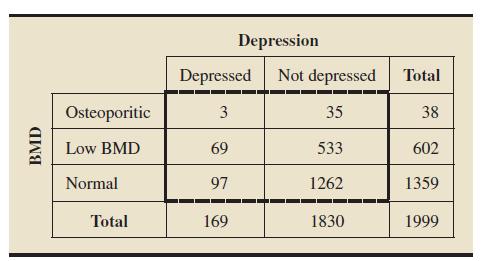
In the paper “Depression and Bone Mineral Density: Is There a Relationship in Elderly Asian Men?”, S. Wong et al. published the results of their study on bone mineral density (BMD) and depression for 1999 Hong Kong men aged 65 to 92 years. Here are the cross-classified data.At the 1%
A CNN/USA TODAY poll conducted by Gallup asked a sample of employed Americans the following question: “Which do you enjoy more, the hours when you are on your job, or the hours when you are not on your job?” The responses to this question were cross-tabulated against several characteristics,
Consider an F-curve with d f = (2, 14). Identify the degrees of freedom for the denominator.
Consider an F-curve with d f = (2, 14). Perform a chi-square test of independence. Determine F0.05.
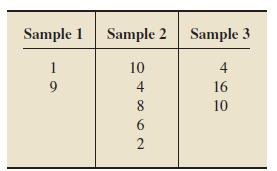
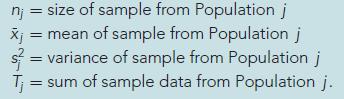
We have provided data from independent simple random samples from several populations. In each case, determine the following items.a. SSTR b. MSTR c. SSEd. MSE e. F Sample 1 1 9 Sample 2 Sample 3 10 4 4 16 8 10 6 2
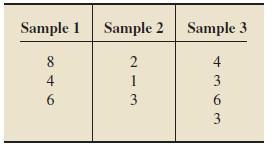
We have provided data from independent simple random samples from several populations. In each case, determine the following items.a. SSTR b. MSTR c. SSE d. MSE e. F Sample 1 Sample 2 Sample 3 8 2 4 4 3 6 213 3 63
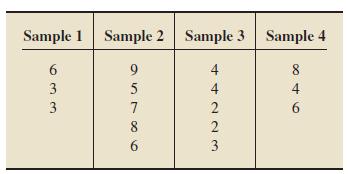
We have provided data from independent simple random samples from several populations. In each case, determine the following items.a. SSTR b. MSTR c. SSE d. MSE e. F Sample 1 Sample 2 Sample 3 Sample 4 6 9 3 ترا ترا 3 57865 6 44223 4 3 846
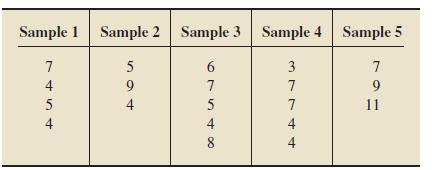
We have provided data from independent simple random samples from several populations. In each case, determine the following items.a. SSTR b. MSTR c. SSE d. MSE e. F Sample 1 Sample 2 Sample 3 Sample 4 Sample 5 7 9 11 74S+ 5 594 67548 37744
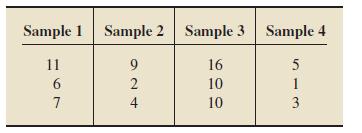
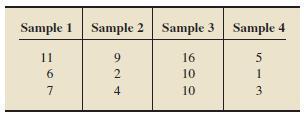
We have provided data from independent simple random samples from several populations. In each case, determine the following items.a. SSTR b. MSTR c. SSE d. MSE e. F Sample 1 Sample 2 Sample 3 Sample 4 11 16 5 6 10 7 10 924 513
True or false: If you know any two of the three sums of squares, SST, SSTR, and SSE, you can determine the remaining one. Explain your answer.
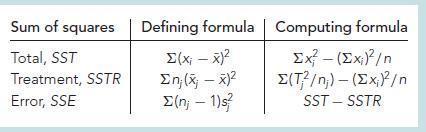
We provide data from independent simple random samples from several populations. In each case,a. Compute SST, SSTR, and SSE by using the computing formulas given in Formula 13.1b. Compare your results in part (a) for SSTR and SSE, where you employed the defining formulas.c. Construct a one-way
we provide data from independent simple random samples from several populations. In each case,a. Compute SST, SSTR, and SSE by using the computing formulas given in Formula 13.1b. Compare your results in part (a) for SSTR and SSE, where you employed the defining formulas.c. Construct a one-way
For a regression analysis, SST = 8291.0 and SSR = 7626.6.a. Obtain and interpret the coefficient of determination.b. Determine SSE.
In each of Exercise,a. Find the regression equation for the data points. Use the defining formulas in Definition 4.4 to obtain Sxx and Sxy.b. Graph the regression equation and the data points.The data points in Exercise 4.44 Exercise 4.44Line A: y = 1.5 + 0.5x, Line B: y = 1.125 + 0.375x Data
In each of Exercise,a. Find the regression equation for the data points. Use the defining formulas in Definition 4.4 to obtain Sxx and Sxy.b. Graph the regression equation and the data points.The data points in Exercise 4.45Exercise 4.45Line A: y = 3 − 0.6x, Line B: y = 4 − xData points:
The negative relation between study time and test score found in Exercise 4.63 has been discovered by many investigators. Provide a possible explanation for it.Exercise 4.63An instructor at Arizona State University asked a random sample of eight students to record their study times in a beginning
In Exercise 4.58, you determined a regression equation that relates the variable's percentage of investments in energy securities and tax efficiency for mutual fund portfolios.a. Should that regression equation be used to predict the tax efficiency of a mutual fund portfolio with 6.4% of its
In Exercise 4.59, you determined a regression equation that can be used to predict the price of a Corvette, given its age.a. Should that regression equation be used to predict the price of a 4-year-old Corvette? or a 10-year-old Corvette? Explain your answers.b. For which ages is the use of the
In the article “Graphs in Statistical Analysis” (American Statistician, Vol. 27, Issue 1, pp 17–21), F. Anscombe presented four sets of data points with almost identical basic statistical properties (means, standard deviations, regression lines, etc.) but quite different scatterplots. We have
In Table 4.2, we provided data on age and price for a sample of 11 Orion's between 2 and 7 years old. On the WeissStats site, we have given the ages and prices for a sample of 31 Orions between 1 and 11 years old. a. Obtain a scatterplot for the data.b. Is it reasonable to find a regression
In this section, we introduced a descriptive measure of the utility of the regression equation for making predictions.a. Identify the term and symbol for that descriptive measure.b. Provide an interpretation
A measure of the amount of variation in the observed values of the response variable not explained by the regression is the______. The mathematical abbreviation for it is ________.
In Exercises,a. Compute the three sums of squares, SST, SSR, and SSE, using the defining formulas.b. Verify the regression identity, SST = SSR + SSE.c. Compute the coefficient of determination.d. Determine the percentage of variation in the observed values of the response variable that is explained
In Exercises,a. Compute the three sums of squares, SST, SSR, and SSE, using the defining formulas.b. Verify the regression identity, SST = SSR + SSE.c. Compute the coefficient of determination.d. Determine the percentage of variation in the observed values of the response variable that is explained
In Exercises,a. Compute the three sums of squares, SST, SSR, and SSE, using the defining formulas.b. Verify the regression identity, SST = SSR + SSE.c. Compute the coefficient of determination.d. Determine the percentage of variation in the observed values of the response variable that is explained
In Exercises,a. Compute the three sums of squares, SST, SSR, and SSE, using the defining formulas.b. Verify the regression identity, SST = SSR + SSE.c. Compute the coefficient of determination.d. Determine the percentage of variation in the observed values of the response variable that is explained
In Exercises,a. Compute the three sums of squares, SST, SSR, and SSE, using the defining formulas.b. Verify the regression identity, SST = SSR + SSE.c. Compute the coefficient of determination.d. Determine the percentage of variation in the observed values of the response variable that is explained
In each of Exercise, fill in the blanks.A measure of total variation in the observed values of the response variable is the__________. The mathematical abbreviation for it is_______.
In Exercises,a. Compute the three sums of squares, SST, SSR, and SSE, using the defining formulas.b. Verify the regression identity, SST = SSR + SSE.c. Compute the coefficient of determination.d. Determine the percentage of variation in the observed values of the response variable that is explained
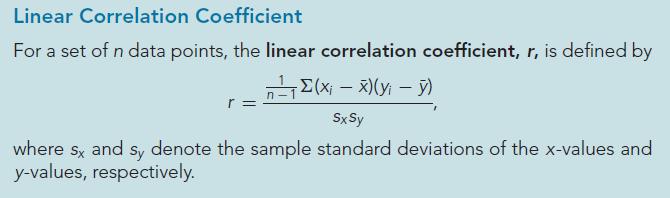
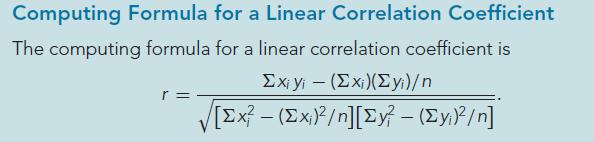
In the Exercise, determine the linear correlation coefficient by using.a. Definition 4.8 b. Formula 4.3 Compare your answers in parts (a) and (b). Linear Correlation Coefficient For a set of n data points, the linear correlation coefficient, r, is defined by ¹₁ Σ(x₁ - x)(y₁ - y) r
Fill in the blanks.A value of r close to ±1 indicates that there is a ________linear relationship between the variables.
Showing 500 - 600
of 1910
1
2
3
4
5
6
7
8
9
10
11
12
13
14
15
Last
Step by Step Answers