New Semester
Started
Get
50% OFF
Study Help!
--h --m --s
Claim Now
Question Answers
Textbooks
Find textbooks, questions and answers
Oops, something went wrong!
Change your search query and then try again
S
Books
FREE
Study Help
Expert Questions
Accounting
General Management
Mathematics
Finance
Organizational Behaviour
Law
Physics
Operating System
Management Leadership
Sociology
Programming
Marketing
Database
Computer Network
Economics
Textbooks Solutions
Accounting
Managerial Accounting
Management Leadership
Cost Accounting
Statistics
Business Law
Corporate Finance
Finance
Economics
Auditing
Tutors
Online Tutors
Find a Tutor
Hire a Tutor
Become a Tutor
AI Tutor
AI Study Planner
NEW
Sell Books
Search
Search
Sign In
Register
study help
statistics
elementary statistics a step by step approach
Elementary Statistics A Step By Step Approach 11th Edition Allan Bluman - Solutions
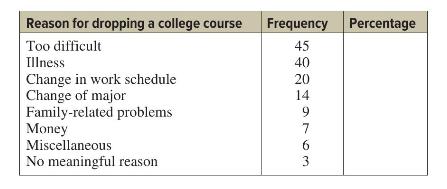
Use the following table to answer the questions.1. What is the variable under study? Is it a random variable?2. How many people were in the study?3. Complete the table.4. From the information given, what is the probability that a student will drop a class because of illness? Money? Change of
On March 28, 1979, the nuclear generating facility at Three Mile Island, Pennsylvania, began discharging radiation into the atmosphere. People exposed to even low levels of radiation can experience health problems ranging from very mild to severe, even causing death. A local newspaper reported that
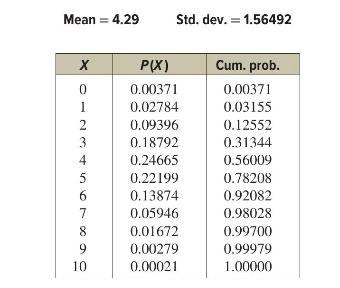
Health officials routinely check the sanitary condition of restaurants. Assume you visit a popular tourist spot and read on social media that in 3 out of every 7 restaurants checked, unsatisfactory health conditions were found. Assuming you are planning to eat out 10 times while you are there on
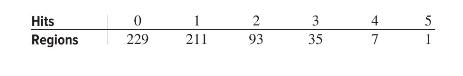
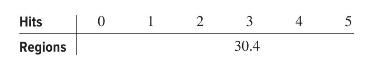
During the latter days of World War II, the Germans developed flying rocket bombs. These bombs were used to attack London. Allied military intelligence didn't know whether these bombs were fired at random or had a sophisticated aiming device. To determine the answer, they used the Poisson
Find the area under the standard normal distribution curve to the left of \(z=2.16\).
Find the area under the standard normal distribution curve to the right of \(z=-1.09\).
Find the area under the standard normal distribution curve between \(z=1.43\) and \(z=-1.87\).
Find the probability for each. (Assume this is a standard normal distribution.)a. \(P(0
Find the \(z\) value such that the area under the standard normal distribution curve between 0 and the \(z\) value is 0.2123 .
Assume you are at a carnival and decide to play one of the games. You spot a table where a person is flipping a coin, and since you have an understanding of basic probability, you believe that the odds of winning are in your favor. When you get to the table, you find out that all you have to do is
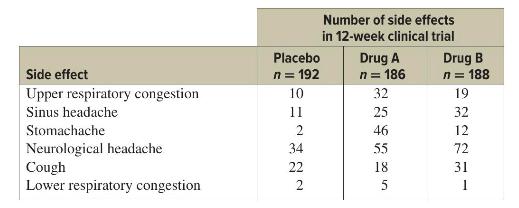
Assume that following an injury you received from playing your favorite sport, you obtain and read information on new pain medications. In that information you read of a study that was conducted to test the side effects of two new pain medications. Use the following table to answer the questions
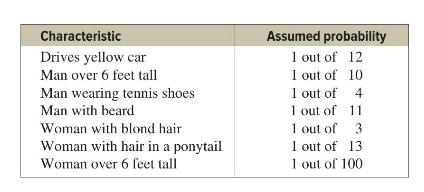
In July 1964, an elderly woman was mugged in Costa Mesa, California. In the vicinity of the crime a tall, bearded man sat waiting in a yellow car. Shortly after the crime was committed, a young, tall woman, wearing her blond hair in a ponytail, was seen running from the scene of the crime and
Garage door openers originally had a series of four on/off switches so that homeowners could personalize the frequencies that opened their garage doors. If all garage door openers were set at the same frequency, anyone with a garage door opener could open anyone else's garage door.1. Use a tree
One of the biggest problems for students when doing probability problems is to decide which formula or formulas to use. Another problem is to decide whether two events are independent or dependent. Use the following problem to help develop a better understanding of these concepts.Assume you are
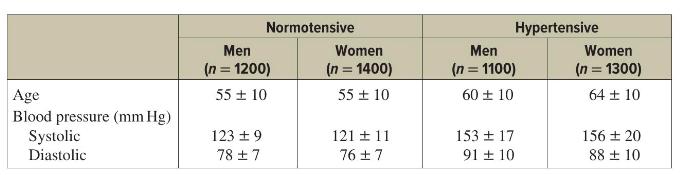
The table lists means and standard deviations. The mean is the number before the plus/minus, and the standard deviation is the number after the plus/minus. The results are from a study attempting to find the average blood pressure of older adults. Use the results to answer the questions.1. Apply
In an attempt to determine necessary dosages of a new drug (HDL) used to control sepsis, assume you administer varying amounts of HDL to 40 mice. You create four groups and label them low dosage, moderate dosage, large dosage, and very large dosage. The dosages also vary within each group. After
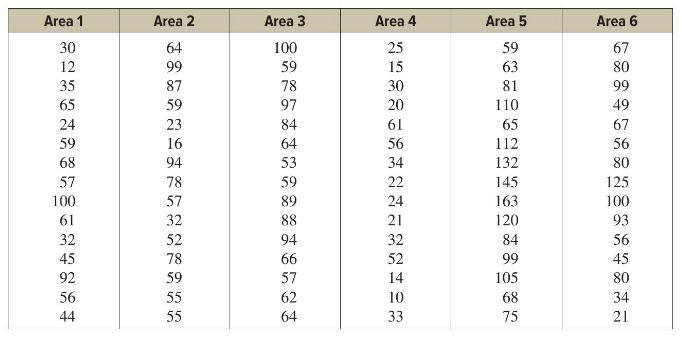
Assume you work for OSHA (Occupational Safety and Health Administration) and have complaints about noise levels from some of the workers at a state power plant. You charge the power plant with taking decibel readings at six different areas of the plant at different times of the day and week. The
Find the sample space for rolling two dice.
Find the sample space for drawing one card from an ordinary deck of cards.
A die is rolled three times and the number of spots obtained is noted as either odd \((1,3\), or 5\()\) or even \((2,4\), or 6\()\). Find the sample space for the experiment.
Use a tree diagram to find the sample space for the gender of three children in a family.
When two dice are rolled, find the probability that one die will show a three and the other die will show a six.
If a family has three children, find the probability that exactly two of the three children are boys.
A card is drawn from an ordinary well-shuffled deck. Find the probability of gettinga. A club.d. A king.b. A red card.e. A face cardc. The 7 of spades.
The black cards in an ordinary deck are removed; then the 26 red cards are well shuffled. One card is selected. Find the probability of getting a black card.
The black cards are removed from an ordinary deck of cards. The 26 red cards are well shuffled, and one card in selected. Find the probability that it is a red card.
Find the complement of each event:a. Selecting a month that has 30 daysb. Selecting a day of the week that begins with the letter \(\mathrm{S}\)c. Rolling two dice and getting a number whose sum is 7d. Selecting a letter of the alphabet (excluding y) that is a vowel
A study found that \(51 \%\) of workers drove 10 miles or less to work, \(27 \%\) drove 11 to 20 miles to work, and \(22 \%\) drove 21 or more miles to work. If a person is selected at random, find the probability that the person drives 11 or more miles to work.
In a sample of 50 people, 21 had type \(\mathrm{O}\) blood, 22 had type A blood, 5 had type B blood, and 2 had type AB blood. Set up a frequency distribution and find the following probabilities.a. A person has type \(\mathrm{O}\) blood.b. A person has type A or type B blood.c. A person has neither
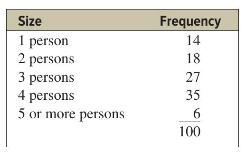
A recent random survey found the following distribution for the sizes of families of students in a junior college.If a student is selected at random from the sample, find each of the following probabilities:a. The student has a family size of 2 persons.b. The student has a family size of fewer
Determine whether the two events are mutually exclusive. Explain your answer.a. Randomly selecting a female student Randomly selecting a student who is a juniorb. Randomly selecting a person with type A blood Randomly selecting a person with type \(\mathrm{O}\) bloodc. Rolling a die and getting an
Determine which events are mutually exclusive when a single card is drawn at random from a deck of cards.a. Getting an ace and getting a queenb. Getting a jack and getting a clubc. Getting a face card and getting a fourd. Getting a diamond and getting a red card
In the United States there are 59 different species of mammals that are endangered, 75 different species of birds that are endangered, and 68 species of fish that are endangered. If one animal is selected at random, find the probability that it is either a mammal or a fish.
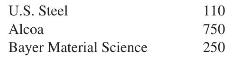
The corporate research and development centers for three local companies have the following numbers of employees:If a research employee is selected at random, find the probability that the employee is employed by U.S. Steel or Alcoa. U.S. Steel Alcoa Bayer Material Science 110 750 250
A survey of tennis players found that \(53 \%\) were white-collar workers (managers or supervisors), \(24 \%\) were students, \(12 \%\) were blue-collar workers, and \(11 \%\) were other types of workers. If a tennis player is selected at random, find the probability that the player is either a
A single card is drawn at random from an ordinary deck of cards. Find the probability that it is a seven or a black card.
In an animal shelter, there are 8 dogs and 10 cats that are available for adoption. Six of the dogs are females and 3 of the cats are females. If a dog or cat is adopted today, find the probability that it is a cat or a male.
On New Year's Eve, the probability of a person driving while intoxicated is 0.32 , the probability of a person having a driving accident is 0.09 , and the probability of a person having a driving accident while intoxicated is 0.06 . What is the probability of a person driving while intoxicated or
A coin is flipped and a die is rolled. Find the probability of getting a tail on the coin and a prime number \((2,3\), or 5\()\) on the die.
A card is drawn from a deck and replaced, and then a second card is drawn. Find the probability of getting a club and then a queen.
An urn contains 2 red balls, 5 blue balls, and 3 white balls. A ball is selected and its color is noted. Then it is replaced. A second ball is selected and its color is noted. Find the probability of each of these events.a. Selecting 3 blue ballsb. Selecting 1 white ball and then a red ballc.
For a recent year, it is estimated that \(36 \%\) of adults are overweight. If three adults are randomly selected, find the probability that all three will be overweight.
Approximately \(9 \%\) of men have a type of color blindness that prevents them from distinguishing between red and green. If 3 men are selected at random, find the probability that all of them will have this type of red-green color blindness.
For a specific year, \(5.2 \%\) of U.S. workers were unemployed. During that time, \(33 \%\) of those who were unemployed received unemployment benefits. If a person is selected at random, find the probability that the person received unemployment benefits and is unemployed.
A recent survey found that \(30 \%\) of the randomly selected adults smoke; of those, \(75 \%\) smoked their first cigarette before the age of 18. If an adult is selected at random, find the probability that the adult smoked their first cigarette before 18 years of age.
Three cards are drawn from an ordinary deck and not replaced. Find the probability of these events.a. Getting 3 jacksb. Getting an ace, a king, and a queen in orderc. Getting a club, a spade, and a heart in orderd. Getting 3 clubs
Box 1 contains 2 red balls and 1 blue ball. Box 2 contains 3 blue balls and 1 red ball. A coin is tossed. If it falls heads up, box 1 is selected and a ball is drawn. If it falls tails up, box 2 is selected and a ball is drawn. Find the probability of selecting a red ball.
A box contains black chips and white chips. A person selects two chips without replacement. If the probability of selecting a black chip and a white chip is \(\frac{15}{56}\) and the probability of selecting a black chip on the first draw is \(\frac{3}{8}\), find the probability of selecting the
The probability that Sam parks in a no-parking zone and gets a parking ticket is 0.06 , and the probability that Sam cannot find a legal parking space and has to park in the noparking zone is 0.20 . On Tuesday, Sam arrives at school and has to park in a no-parking zone. Find the probability that he
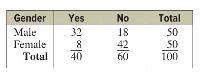
A recent survey asked 100 people if they thought women should handle household tasks. The results of the survey are shown.Find these probabilities.a. The respondent answered yes, given that the respondent was a female.b. The respondent was a male, given that the respondent answered no. Gender Yes
A person selects 3 cards from an ordinary deck and replaces each card after it is drawn. Find the probability that the person will get at least one heart.
A single die is rolled 5 times; find the probability of getting at least one 3 .
The Neckware Association of America reported that 3\% of ties sold in the United States are bow ties. If 4 customers who purchased a tie are randomly selected, find the probability that at least 1 purchased a bow tie.
A coin is tossed and a die is rolled. Find the number of outcomes for the sequence of events.
Students wishing to plan their education after high school can select from these categories:Type of school: University, four-year college, two-year college Major field: Business, education, psychology, health care, computer scienceLiving accommodations: On-campus, off-campusWork: Full-time,
There are four blood types, A, B, AB, and O. Blood can also be Rh+ and Rh-. Finally, a blood donor can be classified as either male or female. How many different ways can a donor's blood be labeled?
The first year the state of Pennsylvania issued railroad memorial license plates, the plates had a picture of a steam engine followed by four digits. Assuming that repetitions are allowed, how many railroad memorial plates could be issued?
A family has 4 children. How many different ways can they line up in a row for a photograph?
A business owner wishes to rank the top 3 locations selected from 5 locations for a business. How many different ways can she rank them?
A radio talk show host can select 3 of 6 special guests for the program. The order of appearance of the guests is important. How many different ways can the guests be selected?
A school musical director can select 2 musical plays to present next year. One play will be presented in the fall, and one play will be presented in the spring. If the music director has 9 plays to pick from, how many different possibilities are there?
How many permutations of the letters can be made from the word STATISTICS?
How many combinations of 4 objects are there, taken 2 at a time?
The director of Movies at the Park must select 4 movies from a total of 10 movies to show on Movie Night at the Park. How many different ways can the selections be made?
In a club there are 7 women and 5 men. A committee of 3 women and 2 men is to be chosen. How many different possibilities are there?
Find the probability of getting 4 aces when 5 cards are drawn from an ordinary deck of cards.
A box contains 24 integrated circuits, 4 of which are defective. If 4 are sold at random, find the following probabilities.a. Exactly 2 are defective.c. All are defective.b. None is defective.d. At least 1 is defective.
A student needs to select two topics to write two term papers for a course. There are 8 topics in economics and 11 topics in science. Find the probability that the student selects one topic in economics and one topic in science to complete the assignment.
In the Pennsylvania State Lottery, a person selects a three-digit number and repetitions are permitted. If a winning number is selected, find the probability that it will have all three digits the same.
There are 8 married couples in a tennis club. If two people are selected at random to plan the summer tournament, find the probability that they are married to each other.
The nine nations show the number of Internet users (in millions) for a recent year. Find the mean.54.9, \(\quad 326.4, \quad 123.0, \quad 90.0, \quad 111.9, \quad 70.7, \quad 87.3, \quad 657.6, \quad 289.5\)
The data show the systemwide sales (in millions) for U.S. franchises of a well-known donut store for a 5-year period. Find the mean.\[\begin{array}{lllll}\$ 221 & \$ 239 & \$ 262 & \$ 281 & \$ 318\end{array}\]
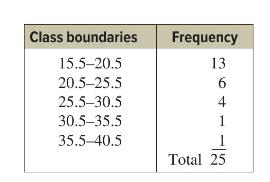
The frequency distribution shows the salaries (in million dollars) for a specific year of the top 25 CEOs in the United States. Find the mean. Class boundaries Frequency 15.5-20.5 13 20.5-25.5 6 25.5-30.5 4 30.5-35.5 1 35.5-40.5 Total 25
For a recent year, the number of visitors (in millions) to the top seven websites is shown. Find the median for the data.\[\text { 148, } 155, \quad 241, \quad 203, \quad 180, \quad 184, \quad 186\]
The number of tornadoes that have occurred in the United States over an 8 -year period is as follows. Find the median.\(684, \quad 764, \quad 656, \quad 702, \quad 856, \quad 1133, \quad 1132, \quad 1303\)
The maximum wind speeds in miles per hour for seven randomly selected areas are shown. Find the mode.\[72, \quad 68, \quad 70, \quad 74, \quad 77, \quad 68, \quad 53\]
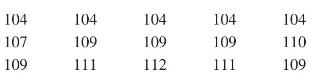
The data show the number of licensed nuclear reactors in the United States for a recent 15 -year period. Find the mode. 104 104 104 104 104 107 109 109 109 110 109 111 112 111 109
The data show the sizes of 8 major earthquakes in the world. Find the mode.\[\begin{array}{lll}7.3, & 6.6, & 6.1,\end{array} 7.6, \quad 9.1, \quad 8.6, \quad 6.3, \quad 7.0\]
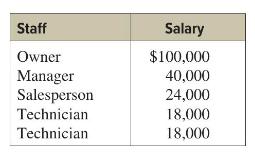
A small company consists of the owner, the manager, the salesperson, and two technicians, all of whose annual salaries are listed here. (Assume that this is the entire population.)Find the mean, median, and mode. Staff Salary Owner $100,000 Manager 40,000 Salesperson 24,000 Technician 18,000
The number of bank failures for a recent 5-year period is shown. Find the midrange.\[3,30,148,157,71\]
The number of successful space launches in five 10 -year periods in Russia is shown. Find the midrange.\[399,1028,1132,542,246\]
A student received an A in English Composition I (3 credits), a C in Introduction to Psychology (3 credits), a B in Biology I (4 credits), and a D in Physical Education ( 2 credits). Assuming \(A=4\) grade points, \(B=3\) grade points, \(C=2\) grade points, \(\mathrm{D}=1\) grade point, and
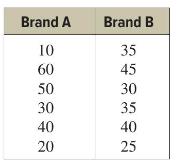
A testing lab wishes to test two experimental brands of outdoor paint to see how long each will last before fading. The testing lab makes 6 gallons of each paint to test. Since different chemical agents are added to each group and only six cans are involved, these two groups constitute two small
The number of cable modem connections in millions for a select 6-year period are shown. Find the range.\[55, \quad 38, \quad 14, \quad 46, \quad 60, \quad 51\]
The sulfur dioxide content of air pollution in millions of tons of five randomly selected cities is shown. Find the variance and standard deviation for the data.\[\begin{array}{lllll}11 & 90 & 33 & 49 & 27\end{array}\]
The sulfur dioxide content of the air in millions of tons in five randomly selected cities is shown. Find the variance and standard deviation for the data.\[\begin{array}{lllll}11 & 90 & 33 & 49 & 27\end{array}\]
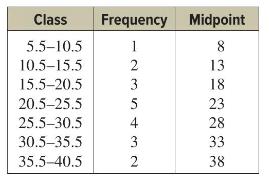
Find the sample variance and the sample standard deviation for the frequency distribution of the data shown. The data represent the number of miles that 20 runners ran during one week. Class Frequency Midpoint 5.5-10.5 10.5-15.5 15.5-20.5 20.5-25.5 25.5-30.5 30.5-35.5 35.5-40.5 1235 +32 8 13 18 23
The mean number of successful space launches for six 10-year periods for the United States is 311.6. The standard deviation is 174.2. The mean number of successful space launches for six 10-year periods for Russia is 669.4. The standard deviation is 390.9. Compute the coefficient of variation for
The mean speed for the five fastest wooden roller coasters is 69.16 miles per hour, and the variance is 2.76 . The mean height for the five tallest roller coasters is 177.80 feet, and the variance is 157.70 . Compare the variations of the two data sets.
The mean price of houses in a certain neighborhood is \(\$ 50,000\), and the standard deviation is \(\$ 10,000\). Find the price range for which at least \(75 \%\) of the houses will sell.
A survey of local companies found that the mean amount of travel allowance for couriers was \(\$ 0.25\) per mile. The standard deviation was \(\$ 0.02\). Using Chebyshev's theorem, find the minimum percentage of the data values that will fall between \(\$ 0.20\) and \(\$ 0.30\).
A man's blood level of chloride was \(104 \mathrm{mEq} / \mathrm{L}\) and the mean level for men is \(102 \mathrm{mEq} / \mathrm{L}\) with a standard deviation of \(2.8 \mathrm{mEq} / \mathrm{L}\). The chloride level in a woman is \(107 \mathrm{mEq} / \mathrm{L}\). The mean level of chloride for
In a recent study, the mean age at which men get married is said to be 26.4 years with a standard deviation of 2 years. The mean age at which women marry is 23.5 years with a standard deviation of 2.3 years. Find the relative positions for a man who marries at age 24 and a woman who marries at age
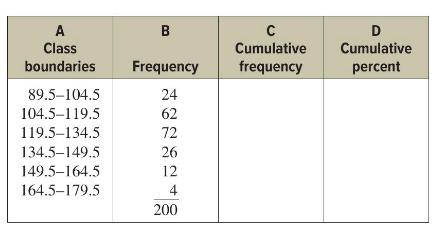
The frequency distribution for the systolic blood pressure readings (in millimeters of mercury, \(\mathrm{mm} \mathrm{Hg}\) ) of 200 randomly selected college students is shown here. Construct a percentile graph. A B C D Class Cumulative Cumulative boundaries Frequency frequency percent 89.5-104.5
The number of traffic violations recorded by a police department for a 10-day period is shown. Find the percentile rank of 16.\[\begin{array}{llllllllll}22 & 19 & 25 & 24 & 18 & 15 & 9 & 12 & 16 & 20\end{array}\]
The sodium levels in \(\mathrm{mEq} / \mathrm{L}\) for 9 students is shown. Find \(Q_{1}, Q_{2}\), and \(Q_{3}\).\[136,142,148,138,136,144,139,141,143\]
Check the following set for outliers: \(2,3,9,16,19,24,26,62\).
The amount of weed killer glyphosate, in parts per billion, found in a random sample of 10 beers is \(49.7,31.1,25.1,20.9,14.5,18.7,11.8,29.8,5.7,9.1\). Construct a box plot for the data.
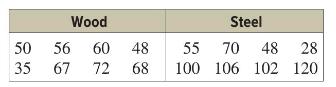
The data shown are the speeds in miles per hour of a sample of wooden roller coasters and a sample of steel roller coasters. Compare the distributions by using boxplots. Wood Steel 50 56 60 48 55 70 48 28 35 67 72 68 100 106 102 120
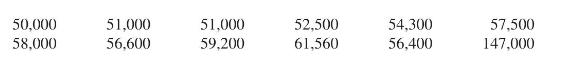
The following data represent salaries (in dollars) from a school district in Greenwood, South Carolina.1. First, assume you work for the school board in Greenwood and do not wish to raise taxes to increase salaries. Compute the mean, median, and mode, and decide which one would best support your
Showing 200 - 300
of 1910
1
2
3
4
5
6
7
8
9
10
11
12
13
14
15
Last
Step by Step Answers