New Semester
Started
Get
50% OFF
Study Help!
--h --m --s
Claim Now
Question Answers
Textbooks
Find textbooks, questions and answers
Oops, something went wrong!
Change your search query and then try again
S
Books
FREE
Study Help
Expert Questions
Accounting
General Management
Mathematics
Finance
Organizational Behaviour
Law
Physics
Operating System
Management Leadership
Sociology
Programming
Marketing
Database
Computer Network
Economics
Textbooks Solutions
Accounting
Managerial Accounting
Management Leadership
Cost Accounting
Statistics
Business Law
Corporate Finance
Finance
Economics
Auditing
Tutors
Online Tutors
Find a Tutor
Hire a Tutor
Become a Tutor
AI Tutor
AI Study Planner
NEW
Sell Books
Search
Search
Sign In
Register
study help
statistics
elementary statistics a step by step approach
Elementary Statistics 9th Edition Neil A Weiss - Solutions
In each Exercise,a. Use the technology of your choice to obtain boxplots for the data sets, using the same scale.b. Compare the data sets by using your results from part (a), paying special attention to center and variation.Anthropologists are still trying to unravel the mystery of the origins of
In Section 3.2, we analyzed the heights of the starting five players on each of two men’s college basketball teams. The heights, in inches, of the players on Team II are 67, 72, 76, 76, and 84. Regarding the five players as a population, solve the following problems.a. Compute the population
In Exercise, we have provided simple data sets for you to practice the basics of finding a.a. Population mean.b. Population standard deviation.3, 5, 7
In Exercise, we have provided simple data sets for you to practice the basics of finding a.a. Population mean.b. Population standard deviation.2, 5, 0, −1
Each year, thousands of high school students bound for college take the Scholastic Assessment Test (SAT). This test measures the verbal and mathematical abilities of prospective college students. Student scores are reported on a scale that ranges from a low of 200 to a high of 800. Summary results
For a linear equation y = b0 + b1x, identify thea. independent variable. b. dependent variable.c. slope. d. y-intercept.
In the Exercise, we give linear equations. For each equation,a. Find the y-intercept and slope.b. Determine whether the line slopes upward, slopes downward, or is horizontal, without graphing the equation.c. Use two points to graph the equation.y = −1 + 2x
In the Exercise, we give linear equations. For each equation,a. Find the y-intercept and slope.b. Determine whether the line slopes upward, slopes downward, or is horizontal, without graphing the equation.c. Use two points to graph the equation.y = 6 − 7x
In the Exercise, we give linear equations. For each equation,a. Find the y-intercept and slope.b. Determine whether the line slopes upward, slopes downward, or is horizontal, without graphing the equation.c. Use two points to graph the equation.y = −8 − 4x
In the Exercise, we give linear equations. For each equation,a. Find the y-intercept and slope. b. Determine whether the line slopes upward, slopes downward, or is horizontal, without graphing the equation.c. Use two points to graph the equation.y = 2
In the Exercise, we give linear equations. For each equation,a. Find the y-intercept and slope.b. Determine whether the line slopes upward, slopes downward, or is horizontal, without graphing the equation.c. Use two points to graph the equation.y = −3x
In the Exercise, we give linear equations. For each equation,a. Find the y-intercept and slope.b. Determine whether the line slopes upward, slopes downward, or is horizontal, without graphing the equation.c. Use two points to graph the equation.y = 1.5x
A positive linear relationship between two variables means that one variable tends to increase linearly as the other___________.
In the Exercise, we identify the y-intercepts and slopes, respectively, of lines. For each line,a. Determine whether it slopes upward, slopes downward, or is horizontal, without graphing the equation.b. Find its equation.c. Use two points to graph the equation.−2 and −3
A value of r close to ______________suggests at most a weak linear relationship between the variables.
In the Exercise, we identify the y-intercepts and slopes, respectively, of lines. For each line,a. Determine whether it slopes upward, slopes downward, or is horizontal, without graphing the equation.b. Find its equation.c. Use two points to graph the equation.0.4 and 1
In the Exercise, we identify the y-intercepts and slopes, respectively, of lines. For each line,a. Determine whether it slopes upward, slopes downward, or is horizontal, without graphing the equation.b. Find its equation.c. Use two points to graph the equation.0 and −0.5
In the Exercise, we identify the y-intercepts and slopes, respectively, of lines. For each line,a. Determine whether it slopes upward, slopes downward, or is horizontal, without graphing the equation.b. Find its equation.c. Use two points to graph the equation.−1.5 and 0
In the Exercise, we identify the y-intercepts and slopes, respectively, of lines. For each line,a. Determine whether it slopes upward, slopes downward, or is horizontal, without graphing the equation.b. Find its equation.c. Use two points to graph the equation.3 and 0
In the Exercise, we identify the y-intercepts and slopes, respectively, of lines. For each line,a. Determine whether it slopes upward, slopes downward, or is horizontal, without graphing the equation.b. Find its equation.c. Use two points to graph the equation.0 and 3
In each of Exercise,a. Find the y-intercept and slope of the specified linear equation.b. Explain what the y-intercept and slope represent in terms of the graph of the equation.c. Explain what the y-intercept and slope represent in terms relating to the application.0 and 3
In each of Exercise,a. Find the y-intercept and slope of the specified linear equation.b. Explain what the y-intercept and slope represent in terms of the graph of the equation.c. Explain what the y-intercept and slope represent in terms relating to the application.0 and 3Refer to Exercise 4.25.
In each Exercise,a. Find the y-intercept and slope of the specified linear equation.b. Explain what the y-intercept and slope represent in terms of the graph of the equation.c. Explain what the y-intercept and slope represent in terms relating to the application.0 and 3Refer to Exercise 4.26. The
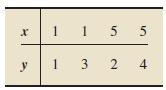
Line A: y = 1.5 + 0.5x, Line B: y = 1.125 + 0.375x Data points:In each of Exercise, we have presented two linear equations and a set of data points. For each exercise,a. Plot the data points and the first linear equation on one graph and the data points and the second linear equation on another.b.
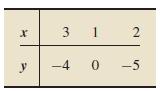
In each of Exercise,a. Find the regression equation for the data points. Use the defining formulas in Definition 4.4 to obtain Sxx and Sxy.b. Graph the regression equation and the data points.Line A: y = 1.5 + 0.5x, Line B: y = 1.125 + 0.375x Data points: x y 31 2 -4 0-5
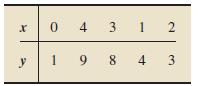
In each of Exercise,a. Find the regression equation for the data points. Use the defining formulas in Definition 4.4 to obtain Sxx and Sxy.b. Graph the regression equation and the data points. x y 0 4 3 1 1984 2 3 دیا
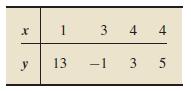
In each of Exercise,a. Find the regression equation for the data points. Use the defining formulas in Definition 4.4 to obtain Sxx and Sxy.b. Graph the regression equation and the data points. x 1 y 13 3 4 4 -1 3 5
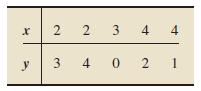
In each of Exercise,a. Find the regression equation for the data points. Use the defining formulas in Definition 4.4 to obtain Sxx and Sxy.b. Graph the regression equation and the data points. x 2 2 y 3 3 44 4021
In each of Exercise,a. Find the regression equation for the data points. Use the defining formulas in Definition 4.4 to obtain Sxx and Sxy.b. Graph the regression equation and the data points.The data points in Exercise 4.43Exercise 4.43The document Arizona Residential Property Valuation System,
A nationwide survey of 1000 U.S. adults, conducted in March 2013 by Rasmussen Reports (field work by Pulse Opinion Research, LLC), found that 50% of respondents favored a plan to break up the 12 megabanks, which then controlled about 69% of the banking industry.a. Identify the population and sample
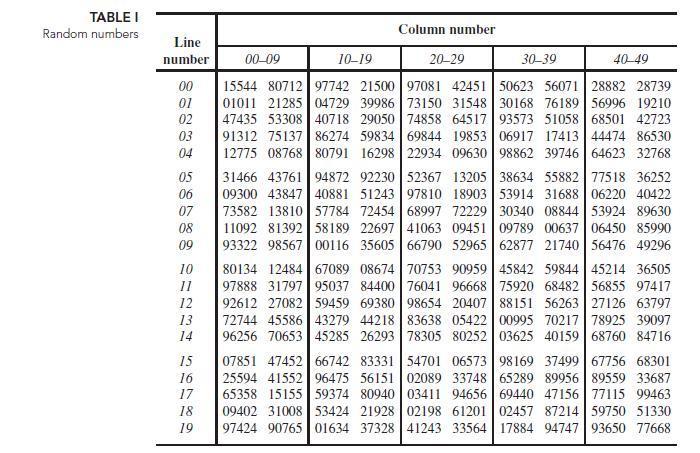
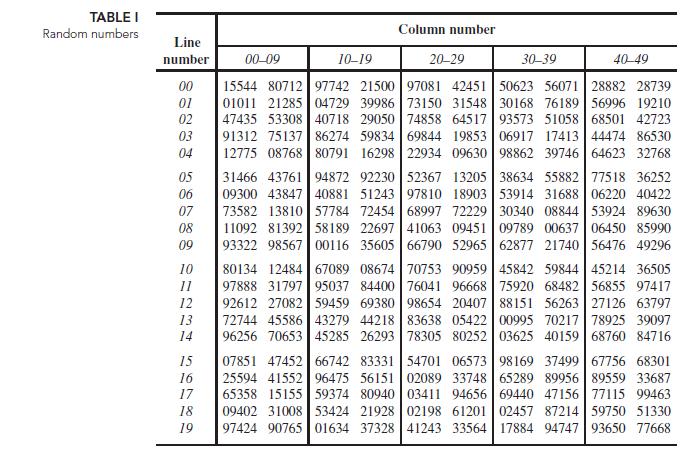
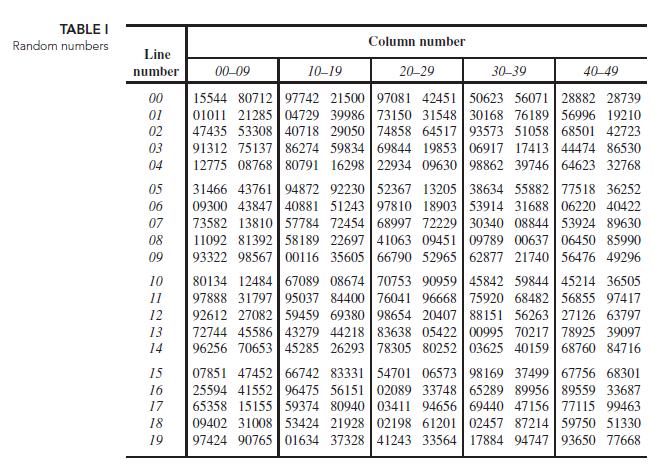
The members of a population are numbered 1–4.a. List the 6 possible samples (without replacement) of size 2 from this population.b. If an SRS of size 2 is taken from the population, what are the chances of selecting 2 and 3? Explain your answer.c. Use Table I in Appendix A to obtain an SRS of
The members of a population are numbered 1–90.a. Use Table I in Appendix A to obtain an SRS of size 5 from the population. Start at the two-digit number in line number 15 and column numbers 25−26, read down the column, up the next, and so on.b. If you have access to a random-number generator,
The members of a population are numbered 1–50.a. Use Table I in Appendix A to obtain an SRS of size 6 from the population. Start at the two-digit number in line number 10.b. If you have access to a random-number generator, use it to solve part (a). TABLE I Random
In the year 2000, an on-line poll was conducted overMemorial Day weekend that asked people what they were doing to observe the holiday. The choices were: (1) stay home and relax, (2) vacation outdoors over the weekend, or (3) visit a military cemetery. More than 22,000 people participated in the
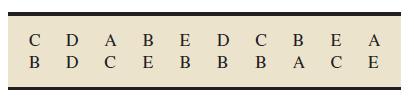
The Recording Industry Association of America provides data on the best-selling albums of all time. As of May 28, 2013, the top six best-selling albums of all time (U.S. sales only), are by the artists the Eagles (E), Michael Jackson (M), Pink Floyd (P), Led Zeppelin (L), AC/DC (A), and Billy Joel
Refer to Exercise 1.44.a. List the 15 possible samples (without replacement) of four artists that can be selected from the six.b. Describe a procedure for taking a simple random sample of four artists from the six.c. If a simple random sampling procedure is used to obtain four artists, what are the
Albums. Refer to Exercise 1.44. a. List the 20 possible samples (without replacement) of three artists that can be selected from the six.b. Describe a procedure for taking a simple random sample of three artists from the six.c. If a simple random sampling procedure is used to obtain three
From Wikipedia.com, we obtained the top seven major active social networking websites in the United States, excluding dating websites. Ranked according to registered users, as of April 2013, from most popular to least popular, they are Facebook (F), Twitter (T), Goggle+ (G), Habbo (H), LinkedIn
Each year, Fortune Magazine publishes an article titled “The International 500” that provides a ranking by sales of the top 500 firms outside the United States. Suppose that you want to examine various characteristics of successful firms. Further suppose that, for your study, you decide to take
Casselman looked at the natural-hazards risk index of megacities to evaluate potential loss from catastrophes such as earthquakes, storms, and volcanic eruptions. Urban areas have more to lose from natural perils, technological risks, and environmental hazards than rural areas. The top 10
In the article, “Ghost of Speciation Past'', T. Kocher looked at the origins of a diverse flock of cichlid fishes in the lakes of southeast Africa. Suppose that you wanted to select a sample from the hundreds of species of cichlid fishes that live in the lakes of southeast Africa. If you took a
The National Agricultural Statistics Service (NASS) conducts studies of the number of acres devoted to farms in each county of the United States. Suppose that we divide the United States into the four census regions (Northeast, North Central, South, and West), take a simple random sample of
In one of his books, Ted Sorenson, Special Counsel to President John F. Kennedy, presents an intimate biography of the extraordinary man. According to Sorenson, Kennedy “read every fiftieth letter of the thirty thousand comings weekly to the White House.” What type of sampling design was
In the article, “Non-probability Sampling Designs for Litigation Surveys, J. Jacoby and.Handlin discussed the controversy about whether nonprobability samples are acceptable as evidence in litigation. The authors randomly selected 26 journals from a list of 1285 scholarly journals in the social
In the article, “Reasons for Non-uptake of Measles, Mumps, and Rubella Catch Up Immunization in a Measles Epidemic and Side Effects of the Vaccine” (British Medical Journal, Vol. 310, pp. 1629–1632), R. Roberts et al. discussed a follow-up survey to examine why almost 10,000 children, ages
In Exercise 1.49, you used simple random sampling to obtain a sample of 10 firms from Fortune Magazine’s list of “The International 500.”a. Use systematic random sampling to accomplish that same task.b. Which method is easier: simple random sampling or systematic random sampling?c. Does it
In the game of keno, 20 balls are selected at random from 80 balls numbered 1–80. In Exercise 1.48 on page 16, you used simple random sampling to simulate one game of keno. a. Use systematic random sampling to obtain a sample of 20 of the 80 balls.b. Which method is easier: simple random
There are 435 representatives in the 113th session of the U.S. House of Representatives. On the website www.house.gov, you can find an alphabetized list of the 435 congresspersons. In 2013, the first representative listed is Robert Aderholt, a Republican from Alabama, and the last representative
The Terri Schiavo Case. In the early part of 2005, the Terri Schiavo case received national attention as her husband sought to have life support removed, and her parents sought to maintain that life support. The courts allowed the life support to be removed, and her death ensued. A Harris Poll of
In simple random sampling, it is also true that each member of the population is equally likely to be selected, the chance for each member being equal to the sample size divided by the population size.a. Under what circumstances is that fact also true for systematic random sampling? Explain your
In a designed experiment,a. What are the experimental units?b. If the experimental units are humans, what term is often used in place of experimental unit?
Define each of the following terms in the context of experimental design.a. Response variable b. Factorc. Levels d. Treatments
In a designed experiment, there are two factors. One factor has m levels and the other factor has n levels. Determine the number of treatments.
Prozac (fluoxetine hydrochloride), a product of Eli Lilly and Company, is used for the treatment of depression, obsessive–compulsive disorder (OCD), and bulimia nervosa. An issue of the magazine Arthritis Today contained an advertisement reporting on the “. . . treatment-emergent adverse events
In the journal article “Cardiac- Resynchronization Therapy with or without an Implantable Defibrillator in Advanced Chronic Heart Failure” (New England Journal of Medicine, Vol. 350, pp. 2140–2150), M. Bristow et al. reported the results of a study of methods for treating patients who had
Give an example, other than those presented in this section, of aa. Qualitative variable.b. Discrete, quantitative variable.c. Continuous, quantitative variable.
In a current newspaper or magazine, find two examples of graphs that might be misleading. Explain why you think the graphs are potentially misleading.
In Exercises, we have provided simple data sets for you to practice finding the descriptive measures discussed in this section. For each data set, a. Obtains the quartiles.b. Determines the interquartile range.c. Finds the five-number summary.1, 2, 3, 4, 1, 2, 3, 4
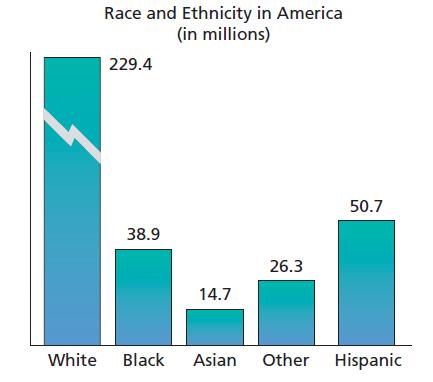
The U.S. Census Bureau publishes data on the population of the United States by race and Hispanic origin in American Community Survey. From that document, we constructed the following bar chart. Note that people who are Hispanic may be of any race, and people in each race group may be either
Patients who undergo chronic hemodialysis often experience severe anxiety. Videotapes of progressive relaxation exercises were shown to one group of patients and neutral videotapes to another group. Then both groups took the State-Trait Anxiety Inventory, a psychiatric questionnaire used to measure
Identify and sketch three distribution shapes that are symmetric.
The National Association of Colleges and Employers (NACE) compiles information on salary offers to new college graduates and publishes the results in Salary Survey.State whether the investigation in question is an observational study or a designed experiment. Justify your answer in each case.
The members of a population are numbered 1−5.a. List the 10 possible samples (without replacement) of size 3 from this population.b. If an SRS of size 3 is taken from the population, what are the chances of selecting 1, 3, and 5? Explain your answer.c. Use Table I in Appendix A to obtain an SRS
Regarding simple random sampling:a. What is simple random sampling?b. What is a simple random sample?c. Identify two forms of simple random sampling and explain the difference between the two.
Regarding probability sampling:a. What is it?b. Does probability sampling always yield a representative sample? Explain your answer.c. Identify some advantages of probability sampling.
In the special report, “Bitter Pill: Why Medical Bills Are Killing Us”, S. Brill presented an in-depth investigation of hospital billing practices that reveals why U.S. health care spending is out of control. One of the many statistics provided in the report is that, during the period from 1998
In “Effects of Plant Density on Tomato Yields in Western Nigeria” (Experimental Agriculture, Vol. 12(1), pp. 43–47), B. Adelana reported on the effect of tomato variety and planting density on yield. Four tomato varieties (Harvester, Pusa Early Dwarf, Ife No. 1, and Ibadan Local) were grown
In an on-line press release, ABCNews.com reported that “. . . 73 percent of Americans. . . favor a law that would require every gun sold in the United States to be test-fired first, so law enforcement would have its fingerprint in case it were ever used in a crime.”a. Do you think that the
In its Summer 2013 Animal Action Report, the National Anti-Vivisection Society stated that “59% of Americans between the ages of 18 and 29 oppose medicaltesting on animals.” The percentage of 59% was computed from sample data.a. Identify the population under consideration.b. Identify the sample
Explain the effect on the margin of error and hence the effect on the accuracy of estimating a population mean by a sample mean.Decreasing the confidence level while keeping the same sample size.
Answer true or false to each statement concerning a confidence interval for a population mean. Give reasons for your answers.The confidence interval can be obtained if you know only the margin of error and the sample mean.
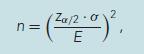
Formula 8.2 provides a method for computing the sample size required to obtain a confidence interval with a specified confidence level and margin of error. The number resulting from the formula should be rounded up to the nearest whole number.a. Why do we want a whole number?b. Why do we round up
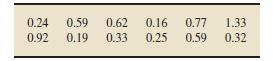
Cadmium, a heavy metal, is toxic to animals. Mushrooms, however, are able to absorb and accumulate cadmium at high concentrations. The Czech and Slovak governments have set a safety limit for cadmium in dry vegetables at 0.5 part per million (ppm). M. Melgar et al. measured the cadmium levels in a
We provide a sample mean, sample size, population standard deviation, and confidence level. In each case, perform the following tasks:a. Use the one-mean z-interval procedure to find a confidence interval for the mean of the population from which the sample was drawn.b. Obtain the margin of error
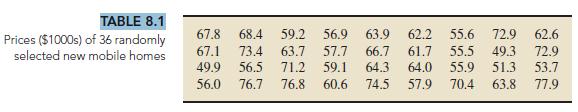
Recall that a simple random sample of 36 new mobile homes yielded the prices, in thousands of dollars, shown in Table 8.1 on page shown below. We found the mean of those prices to be $63.28 thousand.a. Use this information and Procedure 8.1 on page shown below to find a 95% confidence interval for
J. McWhorter et al. of the College of Health Sciences at the University of Nevada, Las Vegas, studied physical therapy students during their graduate-school years. The researchers were interested in the fact that, although graduate physical-therapy students are taught the principles of fitness,
In the paper “Persistent Pulmonary Hypertension of the Neonate and Asymmetric Growth Restriction” M. Williams et al. reported on a study of characteristics of neonates. Infants treated for pulmonary hypertension, called the PH group, were compared with those not so treated, called the control
You found a 90% confidence interval for the mean number of tongue flicks per 20 minutes for all juvenile common lizards to be from 456.4 to 608.0. Obtain the margin of error bya. Taking half the length of the confidence interval.b. Using Formula 8.1.Formula 8.1The margin of error for the estimate
You found a 99% confidence interval of $2.03 million to $2.51 million for the mean gross earnings of all Rolling Stones concerts.a. Determine the margin of error, E.b. Explain the meaning of E in this context in terms of the accuracy of the estimate.c. Find the sample size required to have a margin
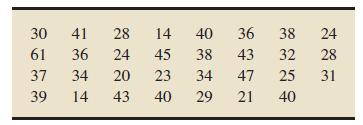
Light-emitting diodes (LEDs) and compact fluorescent lights (CFLs) are lightbulbs that are supposed to last up to fifty times longer than old fashioned incandescent lightbulbs and also use less energy. Consumer Reports sampled eighteen different 60-watt LED and CFL lightbulbs. The following table
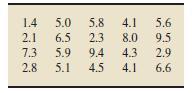
The Professional Golfer’s Association of America (PGA) organizes golf tournaments for professional golfers. The following table lists the longest drives, in yards, recorded during a PGA tournament for a random sample of 26 golfers. Use the technology of your choice to decide whether applying the
Consider again the problem of estimating the mean age, μ, of all people in the civilian labor force. In Example 8.7, on shown below. we found that a sample size of 2250 is required to have a margin of error of 0.5 years and a 95% confidence level. Suppose that, due to financial constraints, the
Consider again the problem of estimating the mean age, μ, of all people in the civilian labor force. In Example 8.7 shown below, we found that a sample size of 2250 is required to have a margin of error of 0.5 year and a 95% confidence level. Suppose that, due to financial constraints, the largest
Suppose that a simple random sample is taken from a normal population having a standard deviation of 10 for the purpose of obtaining a 95% confidence interval for the mean of the population.a. If the sample size is 4, obtain the margin of error.b. Repeat part (a) for a sample size of 16.c. Can you
Acity planner working on bikeways designs a questionnaire to obtain information about local bicycle commuters. One of the questions asks how long it takes the rider to pedal from home to his or her destination. A sample of local bicycle commuters yields the following times, in minutes.a. Find a 90%
Another type of confidence interval is called a one-sided confidence interval. A one-sided confidence interval provides either a lower confidence bound or an upper confidence bound for the parameter in question. You are asked to examine one-sided confidence intervals.Refer to Exercise 8.130.a. Find
In a Singapore edition of Business Times, diamond pricing was explored. The price of a diamond is based on the diamond’s weight, color, and clarity. A simple random sample of 18 one-half-carat diamonds had the following prices, in dollars.a. Apply the t-interval procedure to these data to find a
In the U.S. court system, a defendant is assumed innocent until proven guilty. Suppose that you regard a court trial as a hypothesis test with null and alternative hypothesesH0: Defendant is innocent.Ha: Defendant is guilty.a. Explain the meaning of a Type I error.b. Explain the meaning of a Type
Fill in the blank.Surveys that combine one or more of simple random sampling, systematic random sampling, cluster sampling, and stratified sampling employ what is called_______ sampling.
Fill in the blank.Ideally, in stratified sampling, the members of each stratum should be _________relative to the characteristic under consideration.
Fill in the blank.Ideally, in cluster sampling, each cluster should_______ the entire population.
Fill in the blank.Systematic random sampling is easier to execute than simple random sampling and usually provides comparable results. The exception is the presence of some kind of____________ in the listing of the members of the population.
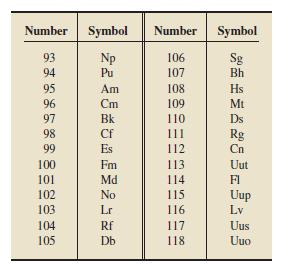
In the article “Element Hunters” R. Dunn reports about the search for new undiscovered elements. Since 1940, scientists have been synthesizing elements one by one. The firstwas neptunium (Np), element number 93. There are, as of this writing, a total of 26 new synthetic elements. The following
Oftentimes, an accurate and complete list of the population is unavailable. In such cases, one or more groups will be omitted from the sampling process because they are not listed as part of the population. This type of bias is called undercoverage.a. Explain why a sample survey of households will
When responses are not obtained from some of the individuals in the sample because either those individuals cannot be reached or refuse to participate, we have nonresponse bias.a. Discuss some of the dangers of nonresponse.b. Many sample surveys that are reported in the media have response rates as
When the behavior of the interviewer or respondent results in inaccurate responses, we have response bias.a. Explain why a survey question “Do you smoke marijuana” might result in response bias?b. Provide some additional survey situations that might be conducive to response bias.c. Provide some
In the paper “Cardiac-Resynchronization Therapy with or without an Implantable Defibrillator in Advanced Chronic Heart Failure” (New England Journal of Medicine, Vol. 350, pp. 2140–2150), M. Bristow et al. reported the results of a study of methods for treating patients who had advanced heart
In the article by P. Ridker et al. titled “A Randomized Trial of Low-dose Aspirin in the Primary Prevention of Cardiovascular Disease in Women” (New England Journal of Medicine, Vol. 352, pp. 1293–1304), the researchers noted that “We randomly assigned 39,876 initially healthy women 45
In the article, “One’s Sex, Sleep, and Posttraumatic Stress Disorder” I. Kobayashi et al. study the relationship between one’s sex, sleep patterns, and post-traumatic stress disorder (PTSD) after trauma exposure. The authors report that women have a higher lifetime prevalence of PTSD
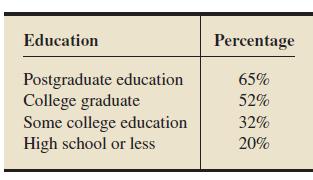
In an article titled “Who has designs on your student’s minds?”, author G. Brumfiel postulated that support for Darwinism increases with level of education. The following table provides percentages of U.S. adults, by educational level, who believe that evolution is a scientific theory well
Showing 800 - 900
of 1910
First
2
3
4
5
6
7
8
9
10
11
12
13
14
15
16
Last
Step by Step Answers