New Semester
Started
Get
50% OFF
Study Help!
--h --m --s
Claim Now
Question Answers
Textbooks
Find textbooks, questions and answers
Oops, something went wrong!
Change your search query and then try again
S
Books
FREE
Study Help
Expert Questions
Accounting
General Management
Mathematics
Finance
Organizational Behaviour
Law
Physics
Operating System
Management Leadership
Sociology
Programming
Marketing
Database
Computer Network
Economics
Textbooks Solutions
Accounting
Managerial Accounting
Management Leadership
Cost Accounting
Statistics
Business Law
Corporate Finance
Finance
Economics
Auditing
Tutors
Online Tutors
Find a Tutor
Hire a Tutor
Become a Tutor
AI Tutor
AI Study Planner
NEW
Sell Books
Search
Search
Sign In
Register
study help
business
biostatistics
Applied Biostatistics For The Health Sciences 2nd Edition Richard J. Rossi - Solutions
Use the data in bodyfat-tr.xlsx and bodyfat-val.xlsx to fit and validate the multiple regression model relating Weight to Neck, Chest, Hip, Forearm, and Wrist.
Use the data in bodyfat-tr.xlsx and bodyfat-val.xlsx to fit and validate the multiple regression model relating PCTBF to Neck, Chest, Hip, Forearm, and Wrist.
In the article “Inequalities in Life Expectancy Among US Counties, 1980 to 2014”published in JAMA Internal Medicine (Lindgren,2017), the authors reported the four models shown in Table 9.40 for the response variable life expectancy at birth. Use the information in Table 9.40 to answer the
Use the Body Fat data set with Weight as the response variable and Age, Height, Neck, Chest, Abdomen, Thigh, Ankle, Biceps, and Forearm as the explanatory variables to answer the following:(a) Fit the full model and check the regression assumptions.(b) Apply the BIC variable selection procedure and
Use the Body Fat data set with Density as the response variable and Age, Height, Neck, Chest, Abdomen, Thigh, Ankle, Biceps, and Forearm as the explanatory variables to answer the following:(a) Fit the full model and check the regression assumptions.(b) Apply the BIC variable selection procedure
Use the Body Fat data set with Weight as the response variable and Age, Height, Neck, Chest, Abdomen, Knee, Ankle, Biceps, and Forearm as the explanatory variables to answer the following:(a) Fit the full model and check the regression assumptions.(b) Apply the maximum ????2 adj variable selection
For the Body Fat data set, with Weight as the response variable and Age (X1), Height(X2), Neck (X3), Chest (X4), Abdomen (X5), Knee (X6), Ankle (X7), Biceps (X8), and Forearm (X9) as the explanatory variables, use the information in Table 9.39 to answer the following questions assuming the full
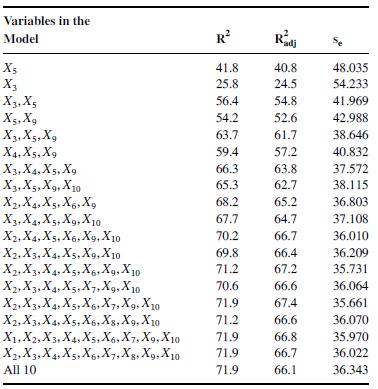
Use the information given in Table 9.38 with ???????????????????? = 1208 and ???? = 234 to answer the following questions.(a) Determine the value of SSE for each of the 11 models that were fit.(b) Determine the BIC value for each of the 11 models that were fit.(c) Which model has the highest BIC
In the article “ Glucose metabolism and coronary heart disease in patients with normal glucose tolerance” published in the Journal of the American Medical Association,(Sasso et al., 2004) used a stepwise regression procedure to model the response variable Duke Myocardial Jeopardy Score as a
Use the variable selection summary output given in Table 9.37 for 10 screening explanatory variables on a data set having ???? = 70 observations to answer the following:(a) Which of the 10 explanatory variables has the highest correlation with the response variable? Explain.(b) If any two models
What is the formula used for computing BIC?
After applying a variable selection procedure for screening the explanatory variables, what is the procedure used for selecting the final model?
Why is it inappropriate to simply apply a variable selection procedure and accept the model that best satisfies the selection criterion as the final model?
Why must a good fitting full model be found before applying a variable selection procedure?
What is an(a) overfit model? (b) underfit model?
In the article “Association of Sickle Cell Trait With Hemoglobin A1???? in African Americans” published in JAMA (Lacy, et al., 2017), the authors the results of a study on hemoglobin A1???? and glucose concentrations for African Americans with and with out sickle cell trait (SCT). The model was
In the article “Sensitivity to reward and body mass index: evidence for a nonlinear relationship” published in Appetite (Davis and Fox, 2008), the authors reported the ANOV table given in Table 9.35 for the multiple regression model SR = ????0 + ????1SEX + ????2B + ????3B2 + ????4SEX×B +
In the article “Gender and parenting significantly affect work hours of recent dermatology program graduates” published in the Archives of Dermatology (Jacobson et al., 2004), the authors reported the results given in Table 9.34 for a regression model to predict the number of hours per week
In the article “Age as a prognostic factor for complications of major head and neck surgery” published in the Archives of Otolaryngology – Head & Neck Surgery (Boruk et al., 2005), the authors reported the results given in Table 9.33 for a regression model to predict the hospital length of
Using the interaction model as the full model, determine which models will need to be fit when testing whether or not(a) the dummy variable is needed in the regression model.(b) the interaction model is a better fitting model than the no-interaction model?
Suppose a dummy variable multiple regression model is fit with a single dummy variable ???? and a single explanatory variable ????. If the resulting fitted model is ˆ???? = 239.8− 42.7???? + 19.2???? − 2.6????????, determine the(a) determine the equation of the fitted regression line for Z =
For a dummy variable multiple regression model based on the dummy variables ????1 and ????2 and a single quantitative explanatory variable ????(a) write down the equation of the interaction model.(b) determine the slope of the regression line when ????1 = ????2 = 1 for the interaction model.(c)
For a dummy variable multiple regression model based on one dummy variable and three explanatory variables write down the equation of the(a) no-interaction model.(b) interaction model.
In the Birth Weight data set the variable Race is a categorical variable that takes on the values 1, 2 and 3. If Race = 1 is used to represent a white mother, Race = 2 represents a black mother, and Race = 3 represents a mother of any other ethnicity, create two dummy variables that could be used
How many dummy variables are needed to account for a categorical variable with(a) four different categories?(b) five different categories?(c) three different categories?
What is a dummy variable?
Using the Body Fat data set,(a) regress Density on the explanatory variables Height, Neck, Abdomen, Hip, Biceps, Forearm, and Wrist.(b) regress Density on the explanatory variables Height, Neck, Abdomen, and Hip.(c) determine the importance of the explanatory variables Biceps, Forearm, and Wrist
Using the Body Fat data set,(a) regress Weight on the explanatory variables Height, Neck, Abdomen, Hip, Biceps, Forearm, and Wrist.(b) regress Weight on the explanatory variables Height, Neck, Abdomen, and Hip.(c) determine the importance of the explanatory variables Biceps, Forearm, and Wrist for
The ANOV table given in Table 9.31 resulted from fitting the multiple regression model ???? = ????0 + ????1????1 +⋯+ ????9????9 + ????, and the ANOV table in Table 9.32 resulted from fitting the reduced model that excluded the explanatory variables ????7,????8, and????9. Use the information in
The ANOV table given in Table 9.29 resulted from fitting the multiple regression model ???? = ????0+????1????1+⋯+????9????9+????, and the ANOV table in Table 9.30 resulted from fitting the reduced model that excluded the explanatory variables ????6,????7,????8, and ????9.Use the information in
For the regression model ???? = ????0 + ????1????1 +⋯+ ????????+1????????+1 +⋯+ ???????????????? + ????, what is the test statistic for testing ????0 ∶ ????????+1 = ????????+2 = ⋯ = ???????? = 0?
What is the procedure for testing the importance of two or more variables in a multiple regression model?
In the article “Tri-ponderal mass index vs body mass index in estimating body fat during adolescence” published in JAMA Pediatrics (Peterson, et al., 2017), the authors reported the fitted multiple regression model relating body fat percentage for men and boys to tri-ponderal mass index (???? =
Suppose the model ???? = ????0 +????1????1 +????2????2 +????3????3 +???? was fit to ???? = 66 observations yielding the fitted model ˆ???? = −3.1 + 4.5????1 + 1.3????2 − 6.9????3.(a) Estimate the mean value of ???? when ????1 = 3,????2 = 5, and ????3 = 1.5.(b) If the standard error of the
What is(a) the relationship between the standard error of the estimate of the mean of ???? and the prediction error for predicting a ???? value?(b) the prediction error when ???????? = 4.98 and the standard error of the estimate of the mean is ???????? = 2.31?
What are the two uses of the least squares response surface ˆ???? in a multiple regression analysis?
In the article “Passive cigarette smoke exposure of infants” published in the Archives of Pediatric and Adolescent Medicine (Ownby et al., 2000), the authors reported the estimated regression coefficients and standard errors given in Table 9.28 for a regression model relating the logarithm of
The MINITAB output given in Table 9.27 resulted from fitting the multiple regression model relating ???? to the explanatory variables N, D, S, U, and R. Assuming that the assumptions of the model are valid, use the information in Table 9.27 to answer the following questions.(a) Do the VIF
The MINITAB output given in Table 9.26 resulted from fitting the multiple regression model relating ???? to the explanatory variables ????1,????2, and ????3. Assuming that the assumptions of the model are valid, use the information in Table 9.26 to answer the following questions.(a) Determine the
What is the form of(a) a 100 × (1 − ????)% confidence interval for a regression coefficient.(b) the test statistic for testing a regression coefficient is equal to 0?(c) the test statistic for testing all of the regression slopes are equal to 0?
What is the sampling distribution ofˆ???????? − ????????se(ˆ????????)when(a) the normality assumption is valid?(b) ???? is large?
What does it mean when ????2 is 10% more than ????2?????????????
Using the information in Table 9.25, test the null hypothesis ????0 ∶ ????1 = ????2 = ????3 = 0 at the ???? = 0.02 level.
Why does a variable drop out of a multiple regression model when its slope is equal to 0?
What is the rejection region for the ????-test used to test all of the regression slopes are equal to 0?
What are the null and alternative hypotheses in the ????-test summarized in the ANOV table?
Suppose ???????????????????? = 2512.3, ???????????? = 273.8, ???? = 187, and there are 10 explanatory variables in the multiple regression model.(a) Construct the ANOV table.(b) Estimate ????.(c) Compute the value of ????2????????????.
The partial ANOV table given in Table 9.25 resulted from fitting the multiple regression model ???? = ????0 +????1????1 +????2????2 +????3????3 +????. Use the information in Table 9.25 to answer the following questions.(a) Fill in the missing entries in the ANOV table.(b) Estimate ????.(c) Compute
Compute the value of ????2???????????? for a multiple regression model ???? = ???? + ????1????1 + ⋯ +???????????????? + ???? when(a) ???????????? = 100, ???????????????????? = 27210, ???? = 100, and ???? = 4.(b) ???????????? = 4.5, ???????????????????? = 1718, ???? = 55, and ???? = 5.(c) ????2 =
Explain why the number of explanatory variables in a multiple regression model should not exceed 10% of the number of observations used to fit the model.
Why is ????2 adj preferred over ????2 as a measure of the adequacy of fit of a multiple regression model?
What is the adjusted coefficient of determination and how is it computed?
What does the coefficient of determination measure?
What is the coefficient of determination and how is it computed?
How many degrees of freedom does ????e have?
How are the residuals used in estimating ?????
Use the Body Fat data set to answer the following:(a) Regress Density on Age, Height, Neck, Chest, Abdomen, Hip, Thigh, Knee, Ankle, Biceps, Forearm, Wrist.(b) Check the assumptions associated with this model. Be sure to plot the standardized residuals versus each of the explanatory variables,
Use the Body Fat data set to answer the following:(a) Regress Weight on Age, Height, Neck, Chest, Abdomen, Hip, Thigh, Knee, Ankle, Biceps, Forearm, Wrist.(b) Check the assumptions associated with this model. Be sure to plot the standardized residuals versus each of the explanatory variables, check
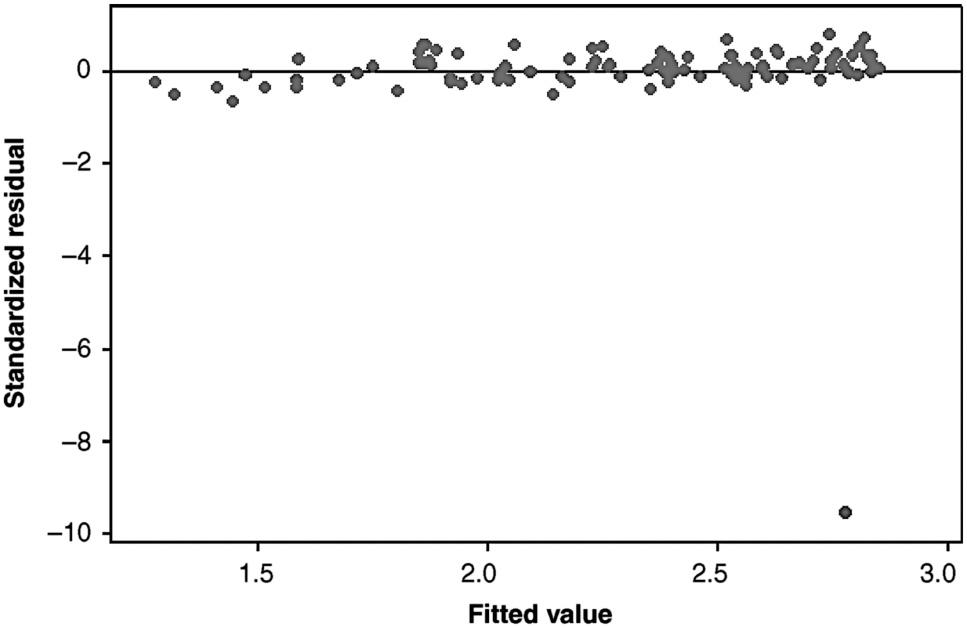
The residual plot in Figure 9.15 reveals a multivariate outlier with a value of Cook’s Distance of 1.087. Table 9.23 contains summaries of the fitted model for the complete data set and Table 9.24 contains summary information for the model fit without this observation. Use the information in
Why is it inappropriate to simply eliminate all influential observations from a data set and refit the multiple regression model to the reduced data set?
What is the procedure that should be used to investigate the influence of an observation that has been identified as an influential observation?
What is the cutoff value that is used with Cook’s Distance to identify an influential observation.
What is a statistic that can be used to identify influential observations?
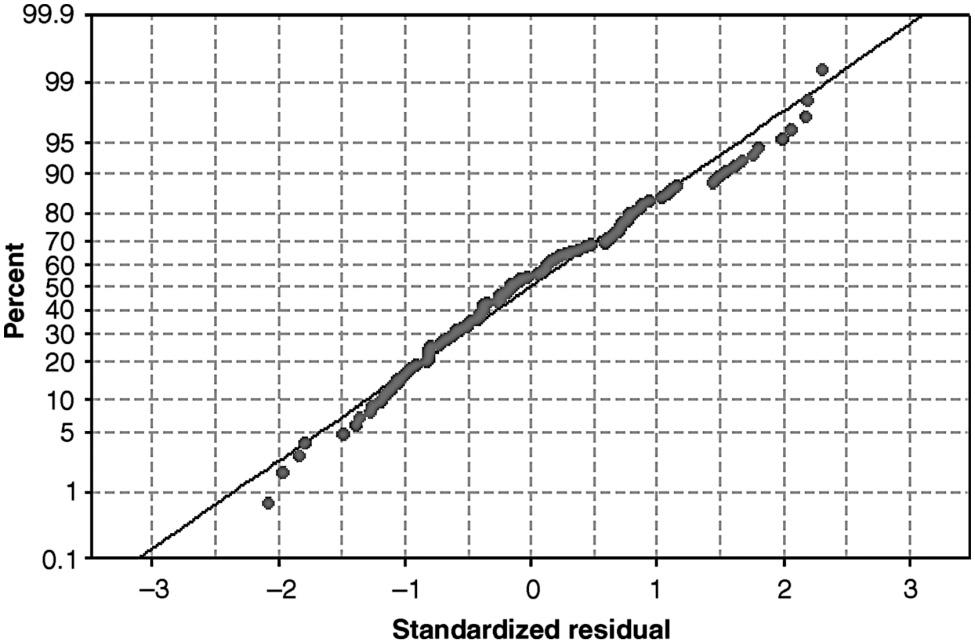
Does the normal probability plot given in Figure 9.14, which resulted from fitting the model ???? = ????0 + ????1????1 + ????2????2 + ????, support the normality assumption? Explain. 99.9 99 95 90 80 70 60 50 40 20 10 5 RODDONOS P 30 1 0.1 0 1 2 3 Standardized residual -2 -1
What statistical inferences is the normality assumption required for?
How can the normality assumption be checked after fitting a multiple regression model?
In the article “Sensitivity to reward and body mass index: evidence for a nonlinear relationship” published in Appetite (Davis and Fox, 2008), the authors reported the fitted multiple regression model ˆ???????? = 6.72 + 1.77Sex − 5.19B − 8.47B2 where SR is a measure of sensitivity to
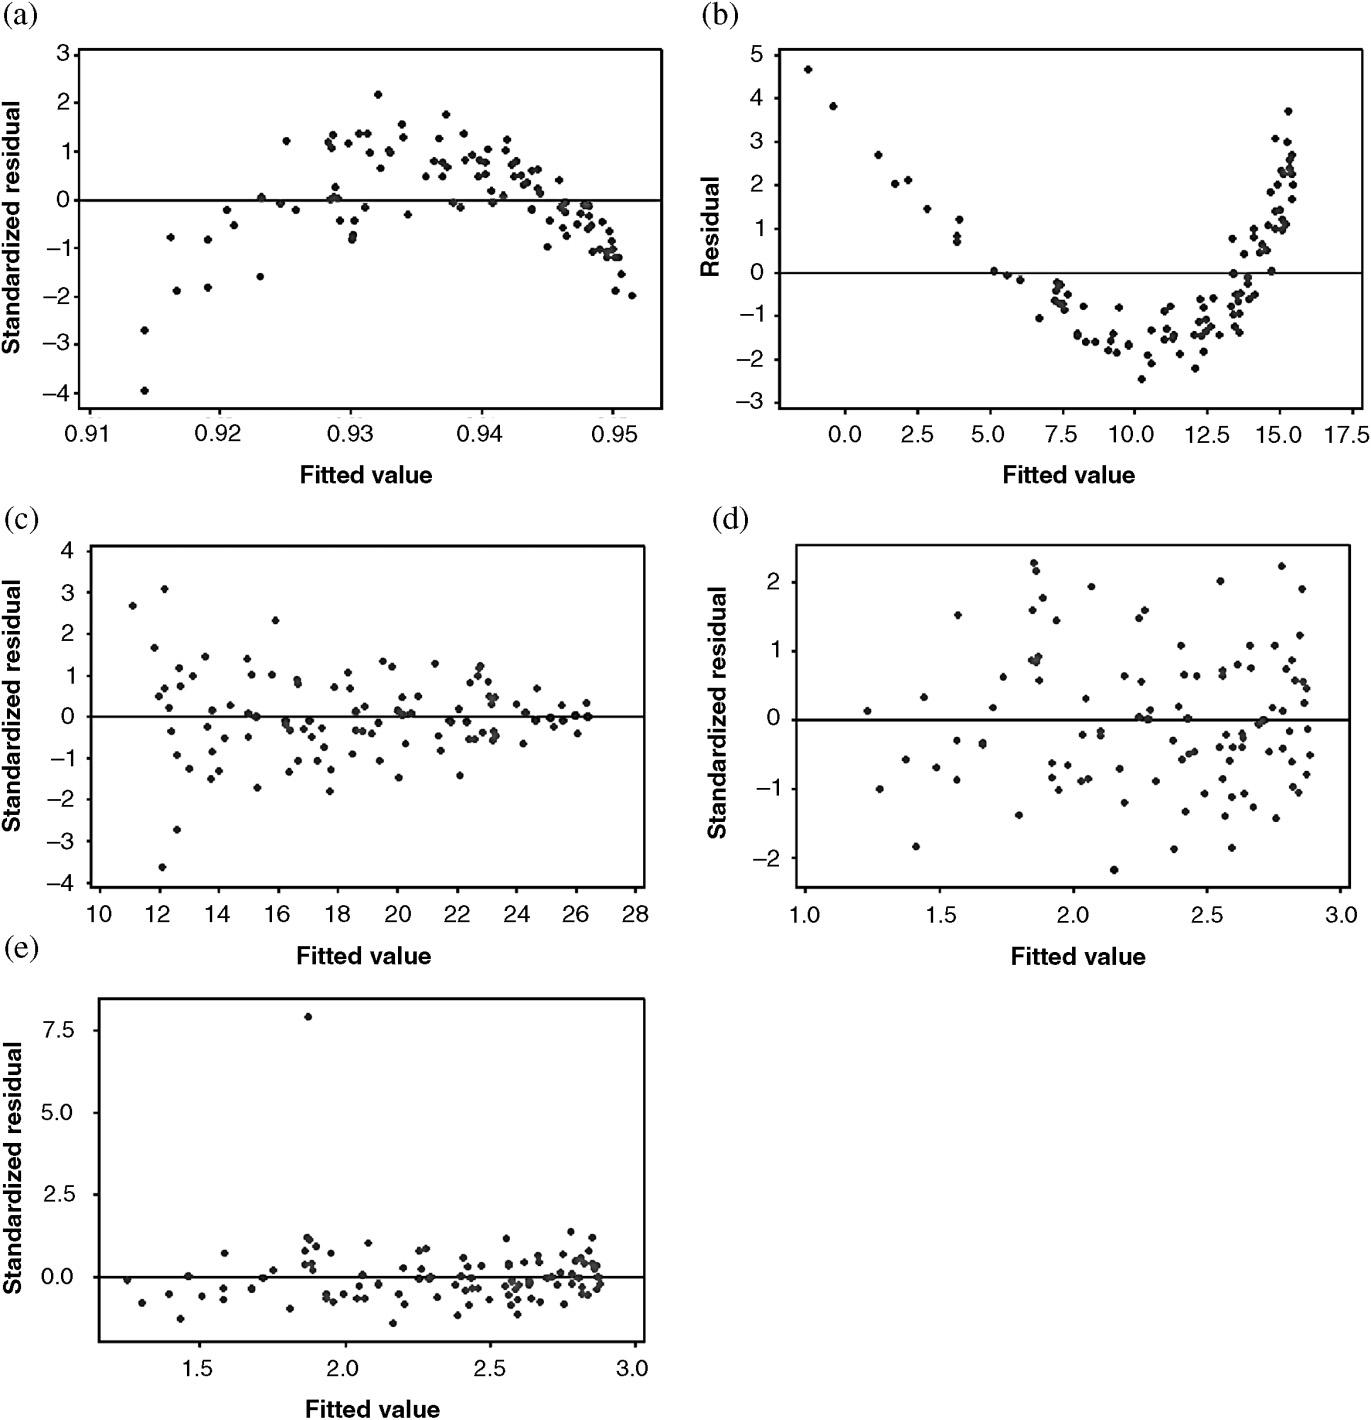
When a residual plot of the standardized residuals versus a particular explanatory variable reveals a curvilinear pattern what is the(a) problem being suggested by the residual plot?(b) variable or might be added to the model to cure the problem suggested by the residual plot? (a) 3 2 T
When a residual plot of the standardized residuals versus the fitted values reveals a funnel-shaped pattern what is the(a) problem being suggested by the residual plot?(b) transformation that might be used to cure the problem suggested by the residual plot?
Determine whether or not each of the residual plots on page 447 suggests there is a particular violation of the regression assumptions, and when there is an apparent violation be sure to identify the assumption being violated.
What(a) does a “good” residual plot look like?(b) patterns should be looked for in a residual plot?(c) is the purpose of plotting the residuals versus each explanatory variable?
If the residual plot of the standardized residuals versus the fitted values indicates a problem with the fitted model, would a residual plot of the standardized residuals versus each of the ???? variables suggest the same problem with the fitted model?Explain.
What does it mean when an observation has a standardized residual ???????? = 6.51?
With a good fitting regression model, why are the standardized residuals expected to fall between −3 and 3?
What is(a) plotted on the ????-axis in a residual plot?(b) a residual?(c) a standardized residual?(d) an unusually large standardized residual?
What is a residual plot?
Suppose the multiple regression model Density = ????0 + ????1Age + ????2Chest + ????3Abdomen + ????4Ankle + ???? was fit to the Body Fat data set. Based on the MINITAB output in Table 9.22, is there evidence of a collinearity problem with the explanatory variables Age, Chest, Abdomen, and Hip?
Suppose when the multiple regression model ???? = ????0 + ????1????1 + ????2????2 + ????3????3 + ????4????4 + ???? was fit the pairwise correlations between the explanatory variables ????1,????2,????3, and????4 given in Table 9.21 were also computed. Based on the correlations in Table 9.21 do any
How can the VIF values be used to check for collinearity problems in the explanatory variables?
What is a procedure that can be used to check for collinearity problems in the explanatory variables?
If all of the pairwise correlations between the response variable and the explanatory variables are between(a) 0.5 and 0.8, is it still possible to have a collinearity problem among the explanatory variables? Explain.(b) 0.1 and 0.3, is it still possible to have a collinearity problem among the
Why is it important to investigate the pairwise correlations between the explanatory variables?
When are the least squares estimators of ????1, ????2,…, ???????? unbiased estimators?
What is the least squares procedure for fitting a multiple regression model?
Assuming that the error term ???? has mean 0 in the regression model???? = ????0 + ????1????1 + ????2????2 + ????3????3 + ????(a) what is the mean of ???? when ????1 = 5,????2 = 3, and ????3 = 10?(b) what is the mean of ???? when ????1 = 0,????2 = 5, and ????3 = 5?(c) what is the mean of ???? when
What does it mean when there is a collinear relationship in a set of explanatory variables?
How do the assumptions required of a multiple regression model and a simple linear regression model differ?
What are the assumptions required of a multiple regression model?
Determine whether or not each of the following statistical models is a linear model.(a) ???? = ????1????1 + ????2????2 + ????.(b) ???? = ????0(????1????1 + ????2????2) + ????.(c) ???? = ????0 + ????1????1 + ????2????2 + ????3????1????2 + ????.(d) ???? = ????0 + ????1????????2 1 + ????.(e) ???? =
For the multiple regression model ???? = ????0 + ????1????1 + ????2????2 + ????, what is the expected change in ???? when(a) ????1 is increased by one unit and ????2 is held fixed?(b) ????2 is increased by one unit and ????1 is held fixed?(c) ????1 and ????2 are increased by one unit?(d) ????1 is
What are the(a) parameters in a multiple regression model?(b) regression coefficients in a multiple regression model?(c) regression slopes in a multiple regression model?
What is the form of the simplest multiple regression model that might be used to explain a curvilinear relationship between a response variable ???? and an explanatory variable ?????
What is the form of a multiple regression model for relating a response variable ???? to a set of explanatory variables(a) ????1 and ????2?(b) ????1,????2, and ????3?(c) ????1,????2,…,?????????
What is a graphical approach that can be used to investigate the possible pairwise relationships between a response variable ???? and a set of explanatory variables????1,????2,…,?????????
What is a multivariate data set?
Using the Body Fat data set with training set bodyfat-tr.xlsx and validation set bodyfat-val.xlsx(a) fit a simple linear regression model relating percent body fat (PCTBF) to wrist circumference (Wrist) on the training set.(b) predict the values of PCTBF using the fitted model on the validation
Suppose a fitted model based on a training set is ˆ???? = −17.8 + 2.3????. What can you conclude when the fitted model on the validation set is(a) ˆ???? = −3.2 + 5.6?????(b) ˆ???? = −16.9 + 2.5?????
Why is it important to use random sampling when creating the training and validation sets in model validation.
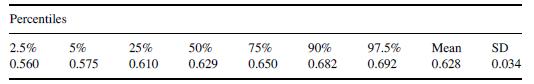
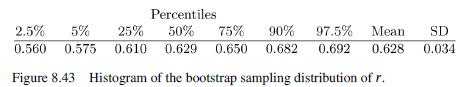
Based on the Body Fat data set, use the summary of the bootstrap sampling distribution of ????, the correlation between PCTBF and Hip, given in Table 8.8 and Figure 8.43 to answer the following questions.(a) Determine the bootstrap standard error of ????.(b) Determine a 95% bootstrap confidence
Explain in detail how to bootstrap the standard error of the sample correlation coefficient.
Showing 1800 - 1900
of 5191
First
12
13
14
15
16
17
18
19
20
21
22
23
24
25
26
Last
Step by Step Answers