New Semester
Started
Get
50% OFF
Study Help!
--h --m --s
Claim Now
Question Answers
Textbooks
Find textbooks, questions and answers
Oops, something went wrong!
Change your search query and then try again
S
Books
FREE
Study Help
Expert Questions
Accounting
General Management
Mathematics
Finance
Organizational Behaviour
Law
Physics
Operating System
Management Leadership
Sociology
Programming
Marketing
Database
Computer Network
Economics
Textbooks Solutions
Accounting
Managerial Accounting
Management Leadership
Cost Accounting
Statistics
Business Law
Corporate Finance
Finance
Economics
Auditing
Tutors
Online Tutors
Find a Tutor
Hire a Tutor
Become a Tutor
AI Tutor
AI Study Planner
NEW
Sell Books
Search
Search
Sign In
Register
study help
business
biostatistics
Applied Biostatistics For The Health Sciences 2nd Edition Richard J. Rossi - Solutions
What does the Central Limit Theorem say about the sampling distribution of ˆ?????
Determine the cost of sampling for each of the scenarios in Exercise 5.35, when the initial cost of sampling is ????0 = $1500 and the cost per unit samples is ???? = $3.
Determine the conservative value of ???? required to achieve the bound on the error of estimation associated with ˆ???? when(a) ???? = 1200 and ???? = 0.05.(b) ???? = 5000 and ???? = 0.03.(c) ???? = 10, 000 and ???? = 0.025.(d) ???? is unknown and ???? = 0.035.(e) ???? is unknown and ???? = 0.03.
In the article “Patient Experience Captured by Quality-of-life Measurement in Oncology Clinical Trials” published in JAMA Network Open (Haslam, 2020), the authors reported a table summarizing ???? = 149 studies on the quality of life for cancer patients during intervention. Table 5.13 contains
Use the data in Table 5.12 for females to answer the following:(a) Estimate the proportion of females having BMI greater than or equal to 30.(b) Compute the estimated standard error for the estimate of the proportion of females having BMI greater than or equal to 30.(c) Based on the observed data
In the article “The impact of obesity on illness absence and productivity in an industrial population of petrochemical workers” published in the journal Annals of Epidemiology (Tsai et al., 2008), the authors studied the relationship between body mass index (BMI) and illness and absence from
If the population proportion ???? is expected to lie between 0.45 and 0.55, what is the most you would expect the sample proportion ˆ???? to be from the true value of ????(a) when ???? = 6000 and ???? = 250?(b) when ???? = 10, 000 and ???? = 400?
How is the accuracy of an estimator measured?
How is the standard error of a statistic different from the standard deviation of the target population?
What is the standard error of a statistic?
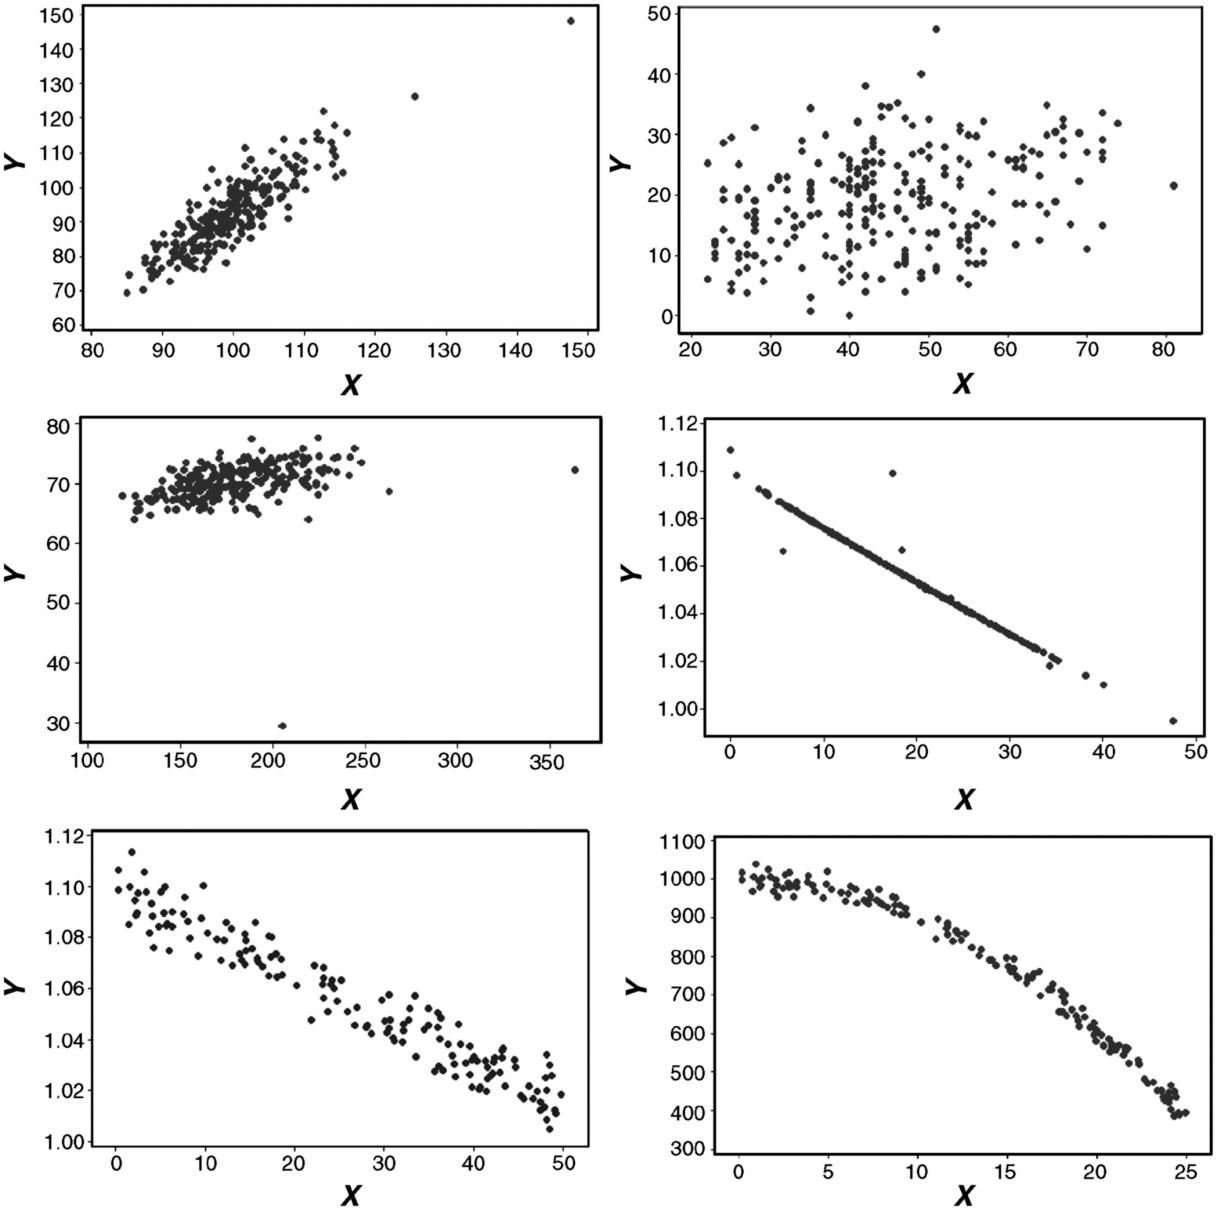
Why is it inappropriate to report the value of the sample correlation coefficient without discussing the scatterplot?
What are the units of the sample correlation coefficient?
Which of the scatterplots in Exercise 4.64 have(a) positive sample correlation coefficients?(b) negative sample correlation coefficients?(c) sample correlation coefficients that are approximately 0?
Describe each of the scatterplots in Figure 4.50. Be sure to identify any patterns, the strength of the pattern, and any bivariate outliers in each of these scatterplots. 150 50 140 40 130 40 120 30 110 Y 100 20 90 80 10- 70 0 60 80 90 100 110 120 130 140 150 20 30 40 50 60 70 80 X 80 60 1.12+
How are ???? and ???? different?
How can bivariate outliers be identified?
What is a bivariate outlier?
What are three typical patterns seen in a scatterplot?
Suppose a digital scale in a pharmacist’s shop is inaccurate in that it over-reports the weight of a compound by 1%. If the mean and standard deviation in a quality control sample of ???? = 100 5 milligram amlodipine pills are reported to be ????̄ = 0.05 and ???? = 0.005, determine the correct
Suppose a digital scale used in an obesity study is inaccurate in that it under-reports an individual’s weight by 0.8 pounds. If the mean and standard deviation of the ???? =50 adult females involved in the study are reported to be ????̄ = 196.3 and ???? = 28.5, determine the correct values for
Using the estimates from Exercise 4.56 and assuming that the distribution of systolic blood pressure is approximately normally distributed for each survival status, estimate the(a) probability that a patient who will survive will have a systolic blood pressure of more than 150.(b) probability that
Use the Intensive Care Unit data set to identify potential differences in the subpopulations of systolic blood pressure (SYS) due to each survival status (STA)by(a) creating histograms and boxplots of systolic blood pressure for each survival status.(b) estimating the mean, median, and standard
Using the data on the variable abdomen circumference (Abdomen) in the Body Fat data set,(a) create a histogram, an outlier boxplot, and a normal probability plot for the variable Abdomen.(b) describe the shape of the distribution suggested by the histogram and boxplot in part (a).(c) identify any
Explain why the coefficients of variation are the same in Exercises 4.52 and 4.53.
Using the results of Exercise 4.52, convert the estimates of the mean, standard deviation, and coefficient of variation(a) of the birth weight of a Mexican child from kilograms to pounds.(b) of the birth length of a Mexican child from centimeters to inches.
In the article “Birth size and accelerated growth during infancy are associated with increased odds of childhood overweight in Mexican children” published in the Journal of the American Dietetic Association (Jones-Smith et al., 2007), two of the baseline variables measured on the ???? = 163
What can be said about the value of the sample correlation coefficient ???? when a scatterplot(a) slopes downward in a linear fashion?(b) slopes upward in a linear fashion?(c) reveals a curvilinear pattern?(d) reveals no pattern at all?
What can be said about a linear data cloud in a scatterplot when the sample correlation coefficient is(a) ???? = −1. (b) ???? = 0.12.(c) ???? = 0.88. (d) ???? = −0.92.
Use the scatterplot in Figure 4.51 and the summary statistics given in Table 4.24, for a bivariate random sample of ???? = 150 observations, to answer the following questions.(a) Based on the scatterplot in Figure 4.51, is it reasonable to believe there is a linear relationship between the
What does it mean when the bias of an estimator ???? of a parameter ???? is(a) negative?(b) positive?(c) zero?
How is the bias of an estimator ???? of a parameter ???? computed?
Name three unbiased estimators and the parameters they estimate.
What does it mean when a statistic ???? is said to be(a) an unbiased estimator of a parameter ?????(b) a biased estimator of a parameter ?????
What information do the mean and the standard deviation of a sampling distribution provide about the accuracy of an estimator?
What are the advantages of using a simple random sample in place of a sample of convenience?
Does the sampling distribution of a statistic depend on(a) the sample size?(b) the distribution being sampled?(c) the standard deviation of the distribution being sampled?
What is the sampling distribution of a statistic?
If the incidence of a disease is large, would it be reasonable to expect the relative risk and odds ratio to be nearly the same in a prospective study?
In which type of studies can the(a) relative risk be estimated?(b) odds ratio be estimated?
In the article “Aspirin and the treatment of heart failure in the elderly” published in Archives of Internal Medicine (Krumholz et al., 2001), the authors reported the results of their study on the use of aspirin as a discharge medication for patients 65 years or older who were hospitalized
Suppose that in studying the factors related to a particular disease, say disease A, a new risk factor has been identified and studied. Use the summary data in Table 4.27 to estimate(a) the relative risk of disease A for this risk factor.(b) the odds ratio of disease A for this risk factor
In the article “Comparable specificity of two commercial tuberculin reagents in persons at low risk for tuberculosis infection” published in the Journal of the American Medical Association (Villarino et al., 1999), the specificity of skin testing for tuberculosis with the reagents Aplisol and
Use the Body Fat data set with the response variable Density to answer the following questions.(a) Create and summarize scatterplots of Density versus each of the explanatory variables Abdomen, Hip, and Ankle.(b) Compute the sample correlation coefficient associated with each of the scatterplots in
Use the Body Fat data set with response variable PCTBF and explanatory variable Chest to answer the following questions:(a) Create and summarize a scatterplot of PCTBF versus Chest.(b) Compute the correlation coefficient for PCTBF and Chest.(c) Fit the least squares regression line relating PCTBF
Use the summary statistics in Table 4.25 and Figure 4.52, computed from the Body Fat data set, to answer the following questions:(a) Summarize the scatterplot of Weight versus Hip.(b) Determine the equation of the least squares regression line relating Weight to Hip.(c) Predict the value of Weight
Is it possible to compute the estimate of(a) the median from the statistics ????,Σ????, andΣ????2? Explain.(b) the mean and the standard deviation from the five-number summary? Explain.
Determine the cost of sampling for each part in Exercise 3.41 when the initial cost involved with sampling the target population is $25,000 and the cost of sampling a unit is $20 per unit.
What does the correlation coefficient measure?
The percentages given in Table 2.13 were extracted from a bar chart published in the article “Prevalence of overweight among persons aged 2–19 years, by sex—National Health and Nutrition Examination Survey (NHANES), United States, 1999–2000 through 2003–2004” in the November 17, 2006
Determine whether each of the following qualitative variables is a nominal or an ordinal variable. The values that the variable can take on are listed in parentheses following the name of the variable.(a) Gender (M, F)(b) Size of hospital (small, average, large)(c) Blood type (A, B, AB, O)(d)
Determine whether each of the following variables is a qualitative or quantitative variable. If the variable is a quantitative variable, determine whether it is a discrete or a continuous variable. If the variable is a qualitative variable, determine whether it is a nominal or an ordinal
Determine whether each of the following variables is a qualitative or quantitative variable.(a) Age(b) Systolic blood pressure(c) Race(d) Gender(e) Pain level
What is the difference between a nominal and an ordinal variable?
What is the difference between a discrete and a continuous variable?
For the clinical trial NCT04591834 summarized at https://clinical trials.gov/ct2/show/NCT04591834, determine(a) the disease/condition being studied.(b) whether the trial is an experiment or an observational study.
For the clinical trial NCT03278119 summarized at https://clinical trials.gov/crt2/show/nct03278119, determine(a) the disease/condition being studied.(b) whether the trial is an experiment or an observational study.
For the clinical trial NCT04372602 summarized at https://clinical trials.gov/ct2/show/NCT04372602, determine(a) the disease/condition being studied.(b) whether the trial is an experiment or an observational study.
In the clinical trial Validation of PSFS in Carpal Tunnel Syndrome(NCT03909373) which is summarized at https://clinicaltrials.gov/ct2/show/nct03909373, determine(a) the estimated enrollment in this observational study.(b) whether this is a prospective or retrospective study.(c) the inclusion
In the clinical trial Melanoma Biomarker Study (NCT00348088) which is summarized at https://clinicaltrials.gov/ct2/show/nct00348088, determine(a) the actual enrollment in this observational study.(b) whether this is a prospective or retrospective study.(c) the location of this study.
In the clinical trial Topical Calcipotriene Treatment for Breast Cancer Immunoprevention(NCT03596073) which is summarized at https://clinicaltrials.gov/ct2/show/nct03596073, determine the(a) treatments in this experiment.(b) locations where this clinical trial will take place.(c) estimated
In the clinical trial Herbal Medicine ’Eungyosan’ and ’Samsoeum’ for Common Cold(NCT04073511) which is summarized at https://clinicaltrials.gov/ct2/show/nct04073511, determine the(a) estimated enrollment in this experiment.(b) treatments in this experiment.(c) country where this clinical
In the clinical trial Direct Lysis of Staph Aureus Resistant Pathogen Trial of Exebacase (DISRUPT)(NCT04160468) which is summarized at https://clinicaltrials.gov/ct2/show/nct04160468, determine the(a) estimated enrollment in this experiment.(b) treatments in this experiment.(c) eligibility
Use the Internet to find(a) the FDA regulations for the approval of a new drug.(b) the regulations used in the United Kingdom for the approval of a new drug.(c) the regulations used in Japan for the approval of a new drug.(d) two drugs that have been taken off the market for safety reasons after
Are all research studies based on clinical trials required to be studied in all four phases? Explain.
What reasons might be used for prematurely stopping a clinical trial?
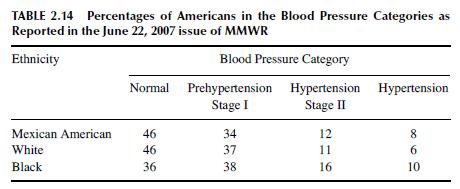
The percentages in Table 2.14 were extracted from a bar chart published in the article“Percentage distribution of blood pressure categories among adults aged ≥18 years, by race/ethnicity—National Health and Nutrition Examination Survey, United TABLE 2.14 Percentages of Americans in the Blood
The probability density of a continuous variable is given in Figure 2.32. If the points labeled A,B,C,D, and E represent the mode, mean, median, 25th percentile, and the 75th percentile, determine which of the points is the(a) median of this distribution.(b) mode of this distribution.(c) mean of
If the 25th and 75th percentiles of the distribution given in Figure 2.32 are 38 and 92, determine the value of the interquartile range.
What does it mean when the value of the correlation coefficient for two quantitative variables is(a) ???? = −1.(b) ???? = 0.(c) ???? = 1. Variable Mean Standard Deviation Weight 169.8 lbs 20 lbs Height 63.6 inches 3 inches BMI 29.6 4
In the article “Mean body weight, height, waist circumference, and body mass index among adults: United States, 1999 – 2000 through 2015 – 2016” published in National Health Statistics Report (Fryar, 2018), the statistics in Table 2.15 were reported for adult females in the United States
What does it mean when(a) the median is much larger than the mean?(b) there is a large distance between the 25th and 75th percentiles?(c) there is a large distance between the 75th and 99th percentiles?
Which parameter measures the relative spread in a population? How is this parameter computed?
For a mound-shaped distribution what is the approximate percentage of the population falling(a) between the values ???? − 2???? and ???? + 2????.(b) above the value ???? + 3????.(c) below the value ???? − ????.
According to the article “Mean body weight, height, waist circumference, and body mass index among adults: United States, 1999 – 2000 through 2015 – 2016” published in National Health Statistics Report (Fryar, 2018), the estimated mean weight of an adult male in the United States in 2015
Which of the parameters(a) measuring the typical value in a population are not sensitive to the extreme values in a population?(b) measuring the spread of a population are not sensitive to the extreme values in a population?
What are three parameters that measure the(a) typical values in a population.(b) the spread of a population.
Describe how the geometric mean (GM) is computed and why it might be used in place of the arithmetic mean.
Suppose the population of 250 doctors at a public hospital has been classified according to the variables Age and Gender and is summarized in the table below.(a) Determine the percentage of doctors at this hospital that are female.(b) Determine the percentage of doctors at this hospital that are
Is the(a) mean sensitive to the extreme values in the population?(b) median sensitive to the extreme values in the population?
When are the mean and median equal?
How do the mean and median differ?
How is a percentile different from a population percentage?
What is the prevalence of a disease?
What is the most common reason that a variable will have a bimodal distribution?
Use the distribution given in Figure 2.33 representing the hypothetical distribution for the survival times for stage IV pancreatic cancer patients to answer the following questions.(a) Does the distribution appear to be multi-modal?(b) How many modes does this distribution have?(c) Is this
What is the purpose of running a phase IV trial after a new drug, treatment, or biomedical procedure has been approved?
What phases must a new drug, treatment, or biomedical procedure go through to receive approval for widespread use in the United States?
What is a(a) dose finding trial?(b) safety and efficacy trial?(c) comparative treatment efficacy trial?(d) expanded safety trial?
In a Red Cross sponsored laboratory study designed to investigate the average length of time blood can be stored safely in a blood bank in the United States, 20 freshly sampled 500 ml blood bags were monitored over a 6-month period. The results of this laboratory study showed that blood may be
In a study designed to determine the percentage of doctors belonging to the American Medical Association (AMA) who perform pro bono work, the AMA found from a census of its membership that 63% performed pro bono work. The AMA also found from a sample of 1000 members that the average number of pro
In a study designed to determine the percentage of understaffed hospitals in the United States, 250 of roughly 7500 hundred hospitals in the United States were surveyed. The resulting percentage of the understaffed hospitals was 41%.(a) What is the target population in this study?(b) Is 41% a
What is the difference between a response variable and an explanatory variable.
What can be expected of an estimate of a parameter when the sample size is approximately equal to the number of units in the population?
What is a(a) random sample? (b) cohort?(c) variable? (d) treatment?(e) placebo? (f) statistical model?
What is a statistical inference?
What is a numerical value that is computed from a census called?
What is a numerical value that is computed from only the information contained in a sample called?
How can the value of an unknown parameter be(a) found exactly? (b) estimated?
How is a statistic different from a parameter?
What is a(a) parameter? (b) statistic?
Showing 2300 - 2400
of 5191
First
17
18
19
20
21
22
23
24
25
26
27
28
29
30
31
Last
Step by Step Answers