New Semester
Started
Get
50% OFF
Study Help!
--h --m --s
Claim Now
Question Answers
Textbooks
Find textbooks, questions and answers
Oops, something went wrong!
Change your search query and then try again
S
Books
FREE
Study Help
Expert Questions
Accounting
General Management
Mathematics
Finance
Organizational Behaviour
Law
Physics
Operating System
Management Leadership
Sociology
Programming
Marketing
Database
Computer Network
Economics
Textbooks Solutions
Accounting
Managerial Accounting
Management Leadership
Cost Accounting
Statistics
Business Law
Corporate Finance
Finance
Economics
Auditing
Tutors
Online Tutors
Find a Tutor
Hire a Tutor
Become a Tutor
AI Tutor
AI Study Planner
NEW
Sell Books
Search
Search
Sign In
Register
study help
business
biostatistics
Applied Biostatistics For The Health Sciences 2nd Edition Richard J. Rossi - Solutions
A 98% confidence interval for the ˜???? computed from the information in a random sample of ???? = 122 observations is 97.6 to 104.2.(a) Interpret this confidence interval.(b) Does this confidence interval support the claim that ˜???? = 100? Explain.(c) Would a 95% confidence interval have been
What is the probability that a 95% confidence interval for ???? will contain the true value of ????(a) before the sample is drawn? (b) after the sample is drawn?
How does a confidence interval differ from the large sample interval estimator?
What is the measure of reliability of a confidence interval?
What is the confidence level associated with a confidence interval?
What is a confidence interval?
What is the general form of the large sample interval estimator based on an estimator???? and its bound on the error of estimation?
What is an interval estimator?
Use the normal probability plot in Figure 4.49, based on the variable systolic blood pressure in the Intensive Care Unit data set (???? = 200), to answer the following:(a) Does the normal probability plot in Figure 4.49 pass the “fat pencil test”?Explain.(b) Does the normal probability plot in
Use the Coronary Heart Disease data set and the variable Age to answer the following:(a) Create a normal probability plot of Age for the subpopulations where heart disease is present and absent.(b) Interpret the normal probability plots created in part (a). Do these normal plots pass the “fat
Using the Exerbike data set, create and interpret normal probability plots for each of the following variables.(a) Cals.(b) HeartRate.(c) Speed.(d) Distance.(e) Cals/M.
Using the Body Fat data set, create and interpret normal probability plots for each of the following variables.(a) PCTBF.(b) Weight.(c) Height.(d) Chest.(e) Wrist.
Use the normal probability plot in Figure 4.48, based on the variable Density in theBody Fat data set (???? = 252), to answer the following questions.(a) Does the normal probability plot in Figure 4.48 pass the “fat pencil test”?Explain.(b) Does the normal probability plot in Figure 4.48
Which of the two normal probability plots in Figure 4.47 supports the use of a normal probability model for modeling the underlying distribution of the variable being measured? Explain. 99.9 Percent 8888888888 1 1 ' 0.1 0 50 100 ' 1 I (a) 150 200 ' 1 0.1 250 1 Percent 8888888 5 99.9 99 LJ_L. 1 1 T
How do the proportional and optimal allocation plans differ for a stratified random sample?
Using the Body Fat data set, create and summarize boxplots and histograms of each of the following variables.(a) PCTBF.(b) Weight.(c) Chest(d) Abdomen.(e) Knee.
Use the relative frequency histograms in Figure 4.46, based on the variable weight(WT) for the case and control groups in the Benign Breast Disease data set (???? = 200), to answer the following questions.(a) Describe the general shape of the each distribution suggested by the histograms in Figure
Suppose that the target population has???? = 12, 000 units distributed over three strata.If the number of units in the three strata are ????1 = 4000, ????2 = 5000, and ????3 = 3000, determine the(a) sampling proportions for a stratified random sample selected using proportional allocation.(b)
Using the information in Table 3.10 to determine the(a) sampling proportions for a stratified random sample selected using proportional allocation.(b) sample size that will produce a bound on the error of estimation for estimating the mean of ???? = 3.(c) proportional allocation for the sample size
Use the data in Table 4.21 summarizing the ???? = 200 observations on the variable age at menarche (AGMN) in the Benign Breast Disease data set, to answer the following questions.(a) Estimate the proportion of women experiencing menarche at or before the age of 11.(b) Estimate the proportion of
A diagnostic test is being developed for a particular disease and the final results of a study of this diagnostic test are presented in the 2 × 2 contingency table in Table 4.22. Use the information given in Table 4.22 to answer the following questions.(a) Estimate the sensitivity for this
In the article “Prevalence and Predictability of Low-yield Inpatient Laboratory Diagnostic Tests” published in JAMA Network Open (Xu, 2019), the authors report the results of a study on laboratory tests detecting normal magnesium levels in blood.The reported estimated prevalence was 0.26, the
How would the values of ????̄ and ????˜ differ when the histogram is(a) extremely long-tailed to the left?(b) extremely long-tailed to the right?(c) mound shaped?
What is the difference between(a) ???? and ????̄? (b) ????˜ and ????˜?(c) IQR andˆIQR? (d) ˆ???????? and ?????????(e) ???? and ????? (f) ???? and ˆ?????(g) ???? and ˆ???? (h) ????2 and ????2?
Give an example of a statistic that is(a) robust to the extremes (b) not robust to the extremes.
What does it mean when an estimator is said to be robust to the extreme values in a sample?
What inference can be drawn about the shape of the population when the sample mean is much larger than the sample median?
A pharmaceutical company has developed a new pill that will mitigate the pain suffered during a migraine headache and needs to estimate the mean time it takes for the pill to begin mitigating a migraine headache. A simple random sample of migraine sufferers will be drawn from a large pool of
What summary statistics are required for estimating the mean and standard deviation?
A hospital auditor has been asked to estimate the proportion of patient accounts in which the hospital overcharged a patient during the last 25 years. If the auditor will use a simple random sample to estimate this proportion, determine(a) the sample size required for estimating the proportion with
Which graphical statistics can be used with the following variables.(a) Blood type.(b) Age in years.(c) Height in centimeters.(d) Ethnicity.
How does the sample mean differ from the population mean?
The results of a study conducted on ???? = 1500 women at the Gynecological Oncology unit at Indira Gandhi Institute of Medical Sciences, Patna, India were reported in the article “Evaluation of sensitivity and specificity of pap smear, LBC and HPV in screening of cervical cancer” in the Indian
Is the estimate of the(a) 1st percentile robust to the extremes in a sample? Explain.(b) 45th percentile robust to the extremes in a sample? Explain.(c) 99th percentile robust to the extremes in a sample? Explain.(d) the mean robust to the extremes in a sample? Explain.(e) interquartile range
Use Table 3.10 to answer the following questions concerning a stratified random sample using optimal allocation. If the goal of this study is to estimate the mean of the target population, determine(a) the sampling proportions.(b) the sample size that will have a total cost of $25,000 when the
A state nursing association is studying the yearly overtime hours put in by registered nurses employed at hospitals. Since a registered nurse can have either a 2-year or a 4-year degree in nursing, a stratified random sample will be used. The goal of this study is to estimate the mean of yearly
How does a statistic differ from a parameter?
Can the value of a parameter be determined from the information contained in a sample? Explain.
Which graphical statistics can be used with(a) qualitative data? (b) quantitative data?
What are three different types of bar charts?
What does the height of a bar in a bar chart represent?
How should a bar chart be constructed when there is sample information on two or more subpopulations that needs to be displayed?
In the Mammography Experience Study, individuals were asked to respond to the statement “You do not need a mammogram unless you develop symptoms” (strongly agree, agree, disagree, strongly disagree). Use the bar chart in Figure 4.41, based on the ???? = 412 responses of the women included in
An insurance company is interested in estimating the mean length of hospital stay following heart bypass surgery. A stratified random sample of public and private hospitals will be used for estimating the mean length of hospital stay following a heart bypass surgery. Suppose there is $15,000
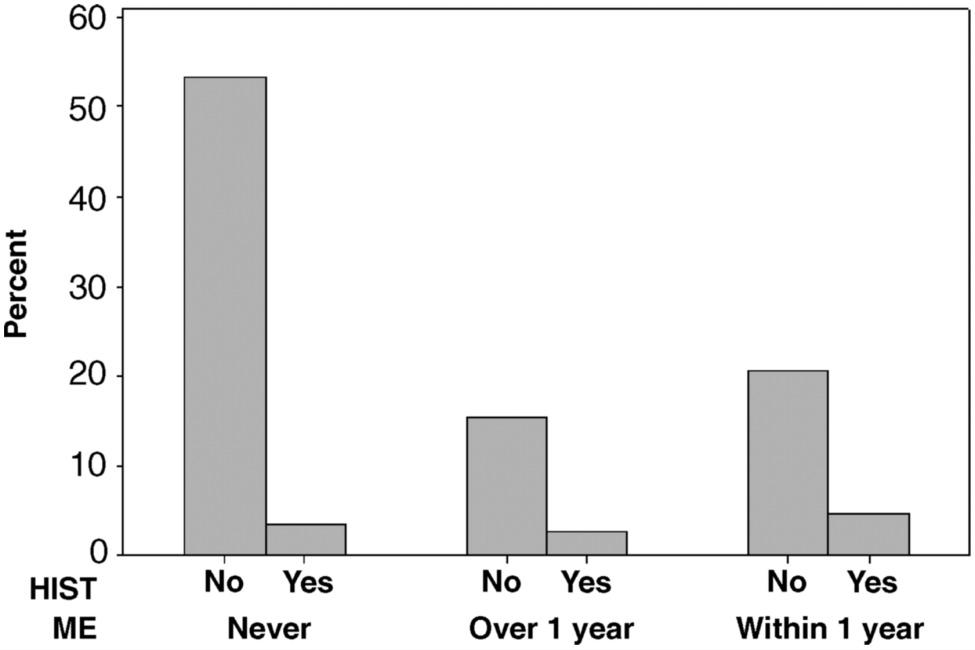
In the Mammography Experience Study individuals were surveyed on their mammography experience (never, within 1 year, over 1 year) and whether or not they have a mother or sister with a history of breast cancer (No, Yes). Use the bar chart in Figure 4.42, based on the ???? = 412 responses of the
How should an outlier or extreme outlier in a sample be handled?
In the Benign Breast Disease Study, the sample consists of ???? = 50 women diagnosed with fibrocystic breast disease and ???? = 150 women without fibrocystic breast disease. One of the variables recorded on each women in the study was whether or not they had regular checkups (Yes, No). Using the
In the Mammography Experience Study, individuals were asked about their prior experience with mammography (never, within 1 year, over 1 year). Use the summarized data in Table 4.19, based on the ???? = 412 responses of the women included in the Mammography Experience data set, to answer the
What are the five statistics that make up the five-number summary?
Which quartiles can be estimated from the information displayed in a boxplot?
What is an(a) outlier?(b) extreme outlier?
Can reliable inferences be drawn from a(a) sample of convenience? Why?(b) random sample? Why?
Why is it important to use a well-designed sampling plan when making inferences from a sample to the target population?
One of the several large federal facilities that are used to store the current version of the flu vaccine is to be sampled in a quality control investigation. A systematic sample will be used to estimate the proportion of damaged or improperly sealed vials of the flu vaccine. If the facility
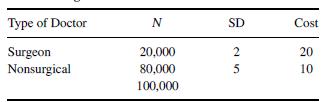
The American Medical Association (AMA) wishes to estimate the mean number of hours per week surgeons and nonsurgical doctors work, and a stratified random sample using optimal allocation will be used for estimating the mean. Suppose that a bound on the error of estimation of ???? = 0.5 is desired,
Using the information in Table 3.14, determine the optimal allocation(a) sampling proportions for estimating the proportion of doctors who work at least 30 hours per week.(b) sample size for a stratified random sample selected using optimal allocation that produces the smallest cost for a bound on
For estimating the mean of a population, a systematic random sample is to be selected. If the number of units in the population is ???? = 10000 and the standard deviation of the population is approximately ???? ≈ 30, determine(a) the sample size required to have a bound on the error of estimation
Use the density histogram shown in Figure 4.45, based on the ???? = 200 observations on the variable AGMT contained in the Benign Breast Disease data set, to answer the following:(a) Describe the shape of the underlying distribution of the variable Age suggested by the histogram in Figure 4.45.(b)
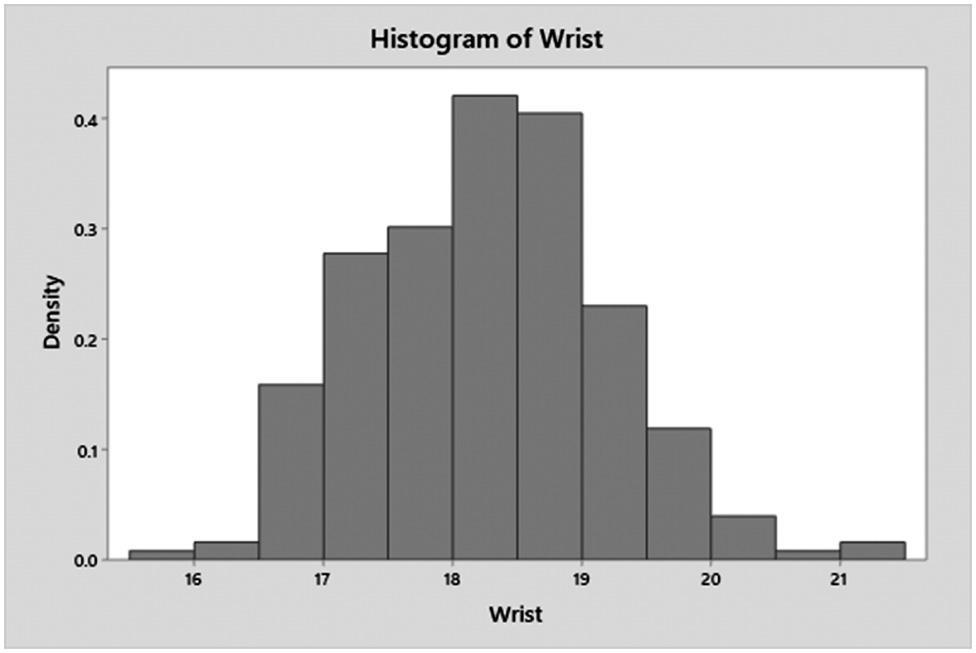
Use the histogram shown in Figure 4.44 which is based on the ???? = 252 observations on the variable Wrist contained in the Body Fat data set, to answer the following questions.(a) Describe the general shape of the distribution of wrist circumference suggested by the histogram in Figure 4.44.(b)
Why should the density scale be used in histograms having classes of unequal widths?
If a sample of ???? = 175 observations has 35 observations falling in the interval 10 to 30, compute the(a) percentage of the sample falling between 10 and 30.(b) density of the histogram class 10 to 30.(c) height of the histogram bar over the class 10 to 30.
What inference would you make about the relationship between the mean and the median when the sample histogram and boxplot suggest the population has an extremely long tail to the(a) right? (b) left?
Which graphical statistic provides more information about the underlying distribution of a quantitative variable, a boxplot or a histogram? Explain.
How is a histogram different from a bar chart?
Can the mean of a population be estimated from the information contained in a boxplot? Explain.
Can a boxplot be used for estimating the modes in a bimodal distribution? Explain.
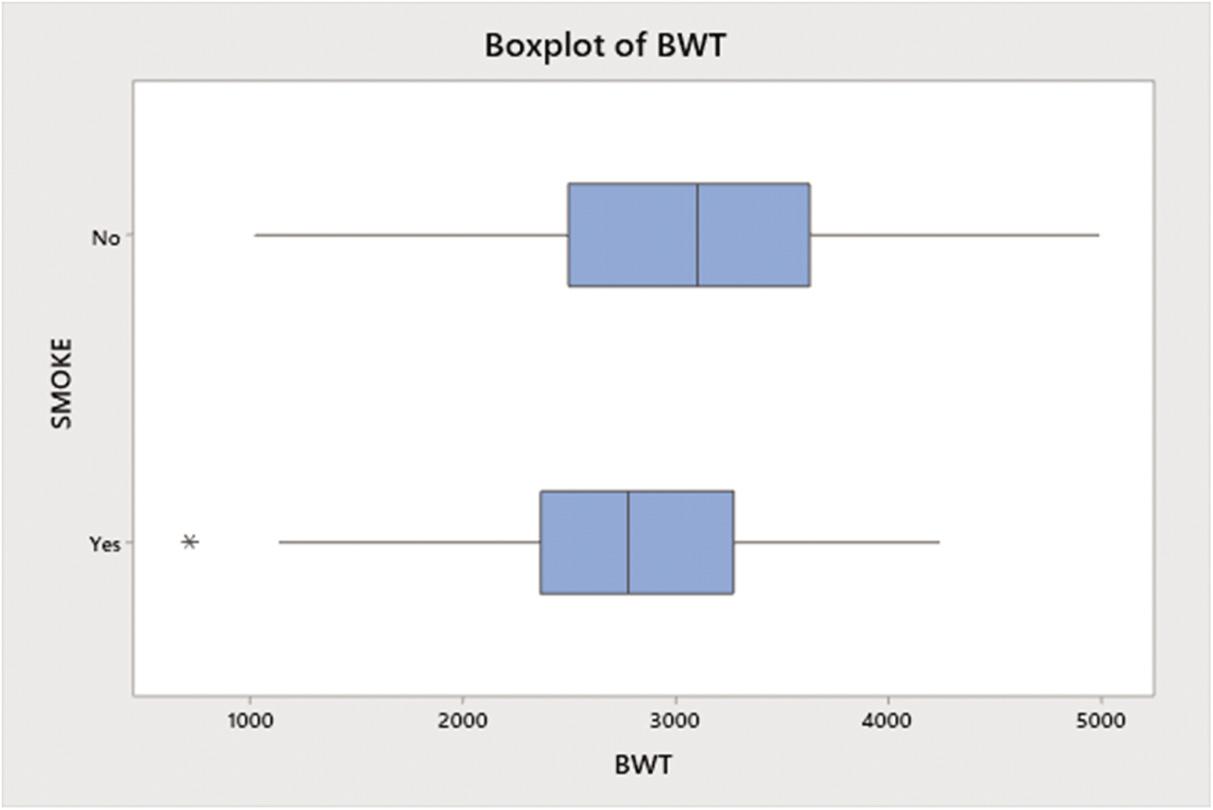
Use the outlier boxplots in Figure 4.43 for the birth weights of babies whose mothers did or did not smoke during pregnancy to(a) estimate the median birth weight of a baby born to a mother who smoked during pregnancy.(b) estimate the median birth weight of a baby born to a mother who did not smoke
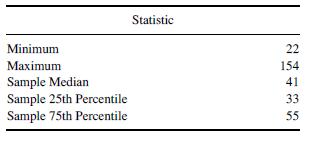
Using the five-number summary given in Table 4.20(a) construct an outlier boxplot.(b) describe the general shape of the distribution suggested by the boxplot in part (a).(c) estimate the interquartile range.(d) determine whether or not there are any extreme outliers in the data set. Minimum Maximum
For estimating a proportion in a population, a systematic random sample is to be selected. If the number of units in the population is ???? = 25000, determine(a) the conservative sample size if the bound on the error of estimation is to be???? = 0.035.(b) the sampling interval ????.(c) the cost of
How can an outlier boxplot be used to identify an(a) outlier? (b) extreme outlier?
Compute the values of ????̄, ????2, ????, and the sample coefficient of variation when(a) ???? = 30, Σ???? = 655, and Σ????2 = 15, 101.35.(b) ???? = 45, Σ???? = 1320, and Σ????2 = 39, 512.(c) ???? = 125, Σ???? = 874.3, andΣ????2 = 6394.05.(d) ???? = 200, Σ???? = 10, 913.8, and Σ????2 =
Compute the estimated standard error of ????̄ when(a) ???? = 3000, ???? = 50, and ???? = 14.2.(b) ???? = 10000, ???? = 150, and ???? = 251.8.(c) ???? = 15000, ???? = 1500, and ???? = 768.9.(d) ???? is unknown, ???? = 75, and ???? = 129.5.(e) ???? is unknown, ???? = 225, and ???? = 11.88.
Compute the standard error and the bound on the error of estimation associated withˆ???? using the finite population correction factor when(a) ???? = 1000, ???? = 100, and ???? = 0.35.(b) ???? = 2000, ???? = 100, and ???? = 0.45.(c) ???? = 5000, ???? = 200, and ???? = 0.25.(d) ???? = 10000, ???? =
How does increasing the sample size ???? affect the standard error of ˆ?????
What is the difference between SE(ˆ????) and se(ˆ????)?
Is the sample proportion ˆ???? an unbiased estimator of the population proportion ?????Explain.
What is the finite population correction factor and when should it be used?
How do the true standard error (SE) and the estimated standard error (se) of an estimator differ?
Many researchers report their results in the form estimate±standard error. Assuming the sampling distribution of the estimator is roughly mound shaped, how likely is it for an unbiased estimator to fall within(a) one standard error of the value of the parameter being estimated?(b) two standard
Why is it important to know the bound on the error of estimation of an unbiased estimator?
What is the formula for computing the bound on the error of estimation of an unbiased estimator ?????
Explain how a biased estimator ???? can still be an accurate estimator of ????.
For each part in Exercise 5.45, compute the standard error of ????̄ without using the finite population correction factor.
Use the information in Table 5.11 on the sampling distributions of the estimators ????1 and ????2 used to estimate ???? to answer the following questions.(a) Determine the bias of the estimator ????1.(b) Determine the bias of the estimator ????2.(c) Is either of the estimators ????1 and ????2 an
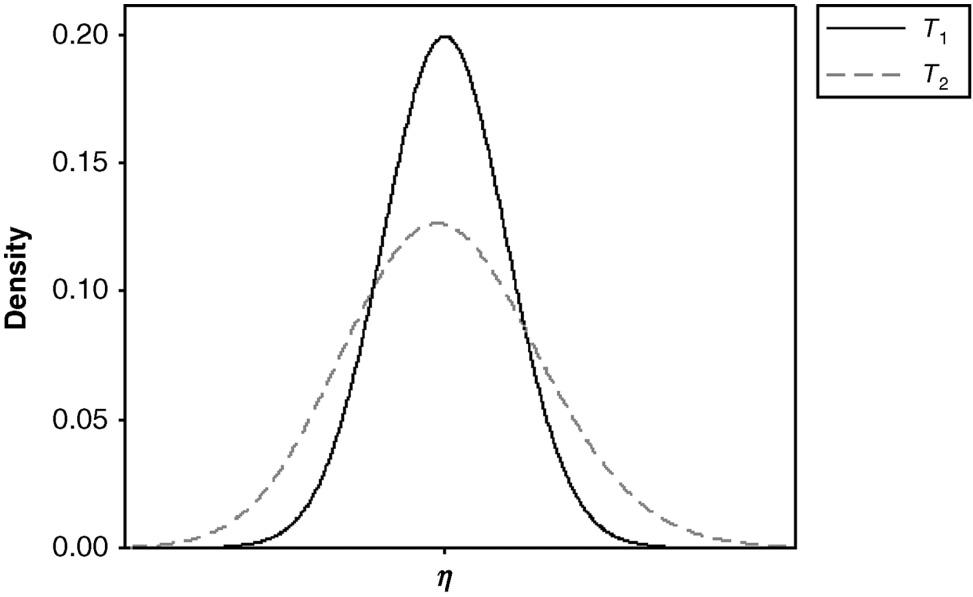
Use the sampling distributions of the estimators ????1 and ????2 that are used for estimating the parameter ???? shown in Figure 5.5 to answer the following:(a) Is ????1 an unbiased estimator of ????? Explain.(b) Is ????2 an unbiased estimator of ????? Explain.(c) Which estimator has the smaller
What is the relationship between the mean squared error of an unbiased estimator and the standard error of the estimator?
How is the mean squared error of an estimator different from the standard error of the estimator?
What is the mean squared error of a statistic?
For each part in Exercise 5.27 compute the standard error of ˆ???? without using the finite population correction factor where appropriate.
For a random sample of ???? = 100 is standard error of ˆ???? larger when ???? = 0.8 or ???? = 0.4? Explain.
Compute the estimated standard error and the bound on the error of estimation associated with ˆ???? using the finite population correction factor when(a) ???? = 1000, ???? = 80, and ˆ???? = 0.36.(b) ???? = 2500, ???? = 120, and ˆ???? = 0.44.(c) ???? = 7500, ???? = 250, and ˆ???? = 0.88.(d) ????
Suppose that it is desired that ????????(????̄) = 50 for a random sample of ???? observations when ????????< 0.05. How large would ???? have to be for the standard error to be(a) 5?(b) 2?(c) 1?
Compute the standard error and bound on the error of estimation associated with ????̄using the finite population correction factor, when(a) ???? = 5000, ???? = 400, and ???? = 120.(b) ???? = 15000, ???? = 500, and ???? = 50.(c) ???? = 12000, ???? = 250, and ???? = 250.(d) ???? = 25000, ???? =
How does increasing the sample size ???? affect the standard error of ????̄?
What is the difference between SE(????̄) and se(????̄)?
Is the sample mean an unbiased estimator of the population mean? Explain.
What are the mean and standard deviation of the sampling distribution of ????̄?
Assuming that the Central Limit Theorem applies to the sampling distribution of ˆ????, approximate the probability that ˆ???? is within(a) 1.5 standard errors of ???? (b) 2.5 standard errors of ????
Use the Central Limit Theorem for proportions to approximate the probability that 0.49≤ ˆ???? ≤ 0.51, when(a) ???? = 50 and ???? = 0.5.(b) ???? = 100 and ???? = 0.5.(c) ???? = 400 and ???? = 0.5.
Under what conditions does the Central Limit Theorem apply to the sampling distribution of ˆ?????
Showing 2200 - 2300
of 5191
First
16
17
18
19
20
21
22
23
24
25
26
27
28
29
30
Last
Step by Step Answers