New Semester
Started
Get
50% OFF
Study Help!
--h --m --s
Claim Now
Question Answers
Textbooks
Find textbooks, questions and answers
Oops, something went wrong!
Change your search query and then try again
S
Books
FREE
Study Help
Expert Questions
Accounting
General Management
Mathematics
Finance
Organizational Behaviour
Law
Physics
Operating System
Management Leadership
Sociology
Programming
Marketing
Database
Computer Network
Economics
Textbooks Solutions
Accounting
Managerial Accounting
Management Leadership
Cost Accounting
Statistics
Business Law
Corporate Finance
Finance
Economics
Auditing
Tutors
Online Tutors
Find a Tutor
Hire a Tutor
Become a Tutor
AI Tutor
AI Study Planner
NEW
Sell Books
Search
Search
Sign In
Register
study help
business
biostatistics
Applied Biostatistics For The Health Sciences 2nd Edition Richard J. Rossi - Solutions
In the article “Modification and evaluation of a velopharyngeal insufficiency quality-of-life instrument” published in JAMA Archives of Otolaryngology – Head and Neck Surgery (Skirko, et al., 2012), the authors reported the results of a twosample study of velopharyngeal insufficiency (VPI)
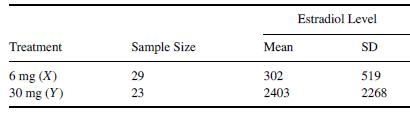
In the article “Lower-Dose vs High-Dose Oral Estradiol Therapy of Hormone Receptor-Positive, Aromatase Inhibitor-Resistant Advanced Breast Cancer: A Phase 2 Randomized Study” published in JAMA ( Ellis, et al., 2009), the authors reported the results of a two-sample study to evaluate daily doses
In the article “Functional Brain Basis of Hypnotizability” published in JAMA Archives of General Psychiatry (Hoeft, et al., 2012 ), the authors reported the results of a study on hypnotic induction profile (HIP) for individuals with high and low HIP. The authors reported the baseline summary
The summary statistics given in Table 7.37 were computed from the data in the Birth Weight data set for the weights of babies for white mothers by mother’s smoking status. Use the summary statistics in Table 7.37 to answer the following:(a) Based on the observed samples, is it reasonable to
Assuming the normality assumptions are satisfied and ???????? ≈ ????????, determine the rejection region for a two-sample ????-test for comparing the means ???????? and ???????? when(a) ????0 ∶ ???????? ≤ ????????, ???? = 0.05, ???????? = 30, and ???????? = 25.(b) ????0 ∶ ???????? ≥
How can the normality assumptions be checked prior to performing a two-sample????-test for comparing two means?
For each of the parts in Exercise 7.117, determine the appropriate value of the estimated standard error of ????̄ − ????̄ and its degrees of freedom.
Determine whether or not it is reasonable to assume that ???????? ≈ ???????? when(a) ???????? = 22, ???????? = 20, ???????? = 15.4, and ???????? = 20.8.(b) ???????? = 60, ???????? = 80, ???????? = 103.5, and ???????? = 40.7.(c) ???????? = 102, ???????? = 98, ???????? = 23.1, and ???????? = 30.2.
Suppose that ???????? and ???????? can be assumed to be nearly equal. What is the formula for computing the(a) pooled estimate of ????.(b) estimated standard error of ????̄ − ????̄?(c) degrees of freedom associated with the ???? statistic?
Under what conditions is it reasonable to assume that ???????? = ?????????
Under what conditions is the sampling distribution of the two-sample ???? statistic approximated by the ???? distribution?
Under what conditions is the sampling distribution of the two-sample ???? statistic approximated by a ???? distribution?
What is the formula for computing the estimated standard error of ????̄ − ????̄ when two independent samples have been collected?
How is the sampling plan for a two independent sample study different from the sampling plan for a paired comparison study?
What is the general form of the ???? statistic for comparing the mean when two independent random samples have been collected?
In the article “A New Method for Photocephalometry” published in JAMA Facial Plastic Surgery (Gu, et al., 2018), the authors reported the results of a paired comparison study of pixel length measurements for ruled sunglasses and the calibration standard from frontal right-mounted flash. Based
In the article “Lower Lateral Cartilage Repositioning Objective Analysis Using 3-Dimensional Imaging” published in JAMA Facial Plastic Surgery (Bared, et al., 2014), the authors reported the results of a paired comparison study of pre- and postoperative angle change for lower lateral cartilage
In the article Effects of tonsillectomy on acoustic parameters published in The Internet Journal of Otorhinolaryngology (Tolga et al., 2007), the authors reported the results of a paired comparison study on several acoustic parameters. The data analyzed in the study consists of F3 formant values
Determine the approximate sample size needed for a paired comparison ????-test when(a) ????0 ∶ ???????? = ????????, ???? = 2.4, ???? = 0.05, ???? = 0.05, and ????̇ = 10.(b) ????0 ∶ ???????? = ????????, ???? = 20, ???? = 0.05, ???? = 0.10, and ????̇ = 50.(c) ????0 ∶ ???????? ≤ ????????,
Compute a 95% confidence interval for ???????? − ???????? for each of the tests in Exercise 7.104.
Assuming a random sample of ???? pairs has been selected and the distribution of the differences is approximately normal, use a ????-test to perform each of the following hypothesis tests. In particular, include the rejection region, the value of ????obs, the decision concerning ????0, and the
Does the normal probability plot given in Figure 7.12 support the use of a ????-test for testing a claim about the difference of two means in a paired comparison study?Explain.
Determine the rejection region for a paired comparison ????-test when(a) ????0 ∶ ???????? ≤ ????????, ???? = 0.01, and ???? = 25.(b) ????0 ∶ ???????? ≥ ????????, ???? = 0.05, and ???? = 30.(c) ????0 ∶ ???????? = ????????, ???? = 0.01, and ???? = 28.(d) ????0 ∶ ???????? ≤ ????????,
For a paired comparison ????-test, under what conditions does the sampling distribution of the test statistic follow a ???? distribution?
What is the formula for computing the value of the ????-statistic in a paired comparison?
What are two commonly used sampling plans that are used in collecting data to be used in a paired comparison?
Using the Birth Weight data set, test the null hypothesis that the mean weight of a baby born to(a) mothers who did not smoke during pregnancy is less than 3200 g. Be sure to check the assumption of normality!(b) mothers who did smoke during pregnancy is less than 3200 g. Be sure to check the
Determine the approximate sample size required for a ????-test about the mean of population when(a) ????0 ∶ ???? ≤ 25, ????0 − ????crit = 5, ???? = 0.01, ???? = 0.10, and ????̇ = 14.(b) ????0 ∶ ???? ≥ 90, ????0 − ????crit = 4, ???? = 0.01, ???? = 0.10, and ????̇ = 10.(c) ????0 ∶
Assuming a random sample has been selected from a population that is approximately normally distributed, use a ????-test to perform each of the following hypothesis tests. In particular, include the rejection region, the value of ????obs, the decision concerning ????0, and the approximate
What can be said about the validity of the ????-value computed in a ????-test when the normal probability plot clearly does not support the assumption of normality?
Does the normal probability plot given in Figure 7.11 support the use of a ????-test for testing a claim about a population mean? Explain.
Determine the rejection region for a ????-test when(a) ????0 ∶ ???? = 50, ???? = 0.05, and ???? = 20.(b) ????0 ∶ ???? ≥ 50, ???? = 0.01, and ???? = 30.(c) ????0 ∶ ???? ≥ 50, ???? = 0.05, and ???? = 45.(d) ????0 ∶ ???? ≤ 50, ???? = 0.05, and ???? = 95.(e) ????0 ∶ ???? ≤ 50, ???? =
For testing hypotheses about the mean of a population, under what conditions does the sampling distribution of the test statistic follow a ???? distribution?
What is the form of the ???? statistic for testing hypotheses about the mean of a population?
Using Tables A.8 and A.9, determine the approximate value of the ????-value in(a) a two-tailed test with 22 degrees of freedom when ????obs = 2.88.(b) a two-tailed test with 20 degrees of freedom when ????obs = −1.82.(c) a lower-tailed test with 60 degrees of freedom when ????obs = −2.33.(d) an
Determine the rejection region for(a) a lower-tail ????-test based on 25 degrees of freedom and ???? = 0.01.(b) an upper-tail ????-test based on 15 degrees of freedom and ???? = 0.05.(c) a two-tail ????-test based on 29 degrees of freedom and ???? = 0.05.
What are the null and alternative hypotheses in(a) a lower-tail test for a population mean?(b) a two-tailed test for a population mean?(c) an upper-tail test for a population mean?
What is the general form of a ???? statistic?
In the article “Helmet use and risk of head injuries in alpine skiers and snowboarders”published in the JAMA (Sulheim et al., 2005), the authors reported the data given in Table 7.36 on the skiing ability for skiers and snowboarders for individuals suffering head injuries and an uninjured
The data given in Table 7.35 is based on the Birth Weight data set. Use Table 7.35 to answer the following questions.(a) Does the data in Table 7.35 support the use of a chi-squared test of independence?(b) Test the hypothesis that whether or not a mother smoked during pregnancy is independent of
The data given in Table 7.34 is based on the Birth Weight data set. Use Table 7.34 to answer the following questions.(a) Does the data in Table 7.34 support the use of a chi-squared test of independence?(b) Test the hypothesis that whether or not a baby has a low birth weight is independent of race
Determine the rejection region for a chi-squared test of independence for a 2 × 4 contingency table when ???? = 0.05.
Determine the rejection region for a chi-squared test of independence for a 5 × 4 contingency table when ???? = 0.01.
Determine the rejection region for a chi-squared test of independence for a 4 × 4 contingency table when ???? = 0.05.
For a sample of ???? = 311 observations cross-classified into a 5 × 3 contingency table, how many degrees of freedom does the test statistic ????2 have in a test of independence?
For a sample of ???? = 500 observations cross-classified into a 2 × 3 contingency table, how many degrees of freedom does the test statistic ????2 have in a test of independence?
For a sample of ???? = 88 observations cross-classified into a 3 × 3 contingency table, how many degrees of freedom does the test statistic ????2 have in a test of independence?
What is the rejection region for a chi-squared test of independence based on a ???? × ????contingency table?
Under what conditions is the sampling distribution of the test statistic ????2 approximately distributed as a chi-squared distribution in a test of independence for two qualitative variables?
What is the formula for the test statistic used to test the independence of two qualitative variables where one variable has ???? categories and the other has ???? categories?
What is a polytomous variable?
In the article “Limited family structure and BRCA gene mutation status in single cases of breast cancer” published in JAMA (Weitzel et al., 2007), the authors reported the 2 × 2 contingency table given in Table 7.33 for investigating the association between family structure and whether or not
In the article “Helmet use and risk of head injuries in alpine skiers and snowboarders”published in the JAMA (Sulheim et al., 2005), the authors reported the data given in Table 7.32 on the use of protective helmets for skiers and snowboarders for individuals suffering head injuries and a group
In the article “Aspirin and the treatment of heart failure in the elderly” published in Archives of Internal Medicine (Krumholz et al., 2001), the authors reported the summarized data given in Table 7.31 on the number of deaths after one year for 456 patients prescribed aspirin and 654 patients
Determine the rejection region for a test of the independence of two dichotomous variables that is based on the chi-squared distribution when(a) ???? = 0.01(b) ???? = 0.05
For a sample of ???? = 250 observations cross-classified into a 2×2 contingency table,(a) how many degrees of freedom does the test statistic ????2 have in a test of independence?(b) how would you check to see if it is reasonable to compare the value of the test statistic ????2 with a chi-squared
What is the rejection region for a test of independence based on the chi-squared distribution?
Under what conditions is the sampling distribution of the test statistic ????2 approximately distributed as a chi-squared distribution in a test of independence for two dichotomous variables?
What is the formula for the test statistic used to test the independence of two dichotomous variables?
What are the null and alternative hypotheses in a test of independence involving two qualitative variables?
Under what conditions are two qualitative variables independent?
Using the Birth Weight data set,(a) estimate the percentage of low birth weight babies for mothers who are white(Race = 1), say ????W.(b) estimate the percentage of low birth weight babies for mothers who are not white(Race = 2 or 3), say ????NW.(c) test ????0 ∶ ????W = ????NW at the ???? = 0.05
Using the Birth Weight data set,(a) estimate the percentage of low birth weight babies for mothers who smoked during pregnancy (????S).(b) estimate the percentage of low birth weight babies for mothers who did not smoke during pregnancy (????N).(c) test ????0 ∶ ????S ≤ ????N at the ???? = 0.05
In the article “The Brief Memory and Executive Test (BMET) for detecting vascular cognitive impairment in small vessel disease: a validation study” published in BMC Medicine (Bookes, et al., (2015), the authors reported the summary statistics given in Table 7.30 for a study on the Brief Memory
In the article “Zinc gluconate lozenges for treating the common cold in children:a randomized controlled trial” published in the Journal of the American Medical Association (Macknin et al., 1998), the authors reported the percentages given in Table 7.29 for students with cold symptoms during
In the article “Repair of Lateral Wall Insufficiency” published in JAMA Facial Plastic Surgery (Vaezeafshar, 2018), the authors reported the results of a study on 44 patients with nasal obstruction and lateral wall insufficiency (LWI) who underwent LWI repair and 44 age and sex-matched control
In the article “Perioperative Aspirin and Clonidine and Risk of Acute Kidney Injury:A Randomized Clinical Trial” published in JAMA (Garg, 2014), the authors reported the summary statistics in Table 7.27 on acute kidney injury (AKI) for two randomized trials, aspirin versus placebo and clonidine
In the article “Liberal or Conservative Oxygen Therapy for Acute Respiratory Distress Syndrome” published in the New England Journal of Medicine (Barrot, 2020), the authors reported the summary statistics in Table 7.26 for the results at day 28 of the study. Use this information to answer the
Determine the conservative sample size required to achieve the prespecified value of???? in each of the following scenarios.(a) ????0 ∶ ???????? = ????????, ????crit = 0.04, ???? = 0.05, and ???? = 0.10.(b) ????0 ∶ ???????? ≥ ????????, ????crit = 0.06, ???? = 0.05, and ???? = 0.05.(c) ????0
For each of the tests in Exercise 7.54, compute a 95% confidence interval for the difference in the population proportions.
In each of the following scenarios, determine the rejection region, the value of ˆ????, the value of ????obs, the ????-value, and the appropriate testing decision for ????0.(a) ????0 ∶ ???????? ≤ ????????, ???? = 0.05, ???????? = 175, ˆ???????? = 0.39, ???????? = 165, and ˆ???????? =
Compute the pooled estimate of ???? = ???????? = ???????? used in the large sample ????-test of the difference of two proportions when(a) ˆ???????? = 0.42, ˆ???????? = 0.51, ???????? = 85, and ???????? = 110.(b) ˆ???????? = 0.54, ˆ???????? = 0.49, ???????? = 210, and ???????? = 190.(c)
For each ????-value in Exercise 7.51, determine whether or not there is sufficient evidence to reject ????0 when ???? = 0.03.
Compute the value of the ????-value for each of the following values of ????obs for a large sample ????-test for the difference of two proportions.(a) ????0 ∶ ???????? ≤ ???????? and ????obs = 1.38.(b) ????0 ∶ ???????? ≥ ???????? and ????obs = −2.38.(c) ????0 ∶ ???????? = ???????? and
Determine the rejection region for a large sample ????-test for the difference of two proportions when(a) ????0 ∶ ???????? ≤ ???????? and ???? = 0.01.(b) ????0 ∶ ???????? = ???????? and ???? = 0.05.(c) ????0 ∶ ???????? ≥ ???????? and ???? = 0.05.
Explain why(a) ˆ???? = ???????? ˆ????????+???????? ˆ????????/????????+????????is used in computing the standard error of ˆ???????? − ˆ???????? in the large sample ????-test statistic for a hypothesis test about the difference between two population proportions?(b) ˆ???????? and ˆ????????
What is the formula for the test statistic in a large sample ????-test for a hypothesis test about the difference between two population proportions?
Under what conditions can a large sample ????-test be used in a hypothesis test concerning the difference of two proportions?
Using the Body Fat data set(a) estimate the proportion of adult males having at least 25% percent body fat (????25).(b) test ????0 ∶ ????25 ≤ 0.10 at the ???? = 0.05 level.(c) compute a confidence interval for the proportion of male adults having at least 25% percent body fat.
Using the Coronary Heart Disease data set(a) estimate the proportion of the study population having evidence of coronary heart disease (????C).(b) test ????0 ∶ ????C = 0.50 at the ???? = 0.05 level.(c) compute a confidence interval for the proportion of the study population having coronary heart
Determine the sample size required to achieve the prespecified value of ???? in each of the following scenarios.(a) ????0 ∶ ???? ≤ 0.25, ???? = 0.01, ???? = 0.10, and ????crit = 0.30.(b) ????0 ∶ ???? ≤ 0.65, ???? = 0.05, ???? = 0.15, and ????crit = 0.72.(c) ????0 ∶ ???? ≥ 0.15, ???? =
For each of the tests in Exercise 7.42 compute a 95% confidence interval for the population proportion ????.
In each of the following scenarios, determine the rejection region, the value of ????obs, the ????-value, and the appropriate testing decision on ????0.(a) ????0 ∶ ???? ≤ 0.5, ???? = 0.01, ???? = 100, and ˆ???? = 0.55.(b) ????0 ∶ ???? ≥ 0.25, ???? = 0.05, ???? = 300, and ˆ???? = 0.18.(c)
For each of the ????-values in Exercise 7.40, determine whether or not there is sufficient evidence to reject ????0 when ???? = 0.05.
Compute the ????-value associated with a large sample ????-test for a proportion when(a) ????0 ∶ ???? = 0.30 and ????obs = 1.85.(b) ????0 ∶ ???? ≤ 0.75 and ????obs = 2.68.(c) ????0 ∶ ???? ≥ 0.33 and ????obs = −3.07.(d) ????0 ∶ ???? = 0.40 and ????obs = 2.02.
Determine the rejection region for a large sample ????-test for a population proportion when(a) ????0 ∶ ???? = 0.08 and ???? = 0.01.(b) ????0 ∶ ???? ≥ 0.55 and ???? = 0.01.(c) ????0 ∶ ???? ≤ 0.25 and ???? = 0.05.
Determine the value of ????crit for an upper-tailed test when(a) ???? = 0.01.(b) ???? = 0.10.(c) ???? = 0.05.
Determine the value of ????crit for a two-tailed test when(a) ???? = 0.05.(b) ???? = 0.10.(c) ???? = 0.01.
Determine the value of ????crit for a lower-tailed test when(a) ???? = 0.01.(b) ???? = 0.05.(c) ???? = 0.10.
What is the general form of the rejection region for a ????-test that is(a) a lower-tail test.(b) an upper-tail test.(c) a two-tailed test.
Explain why(a) ????0 is used in computing the standard error of ˆ???? in the large sample ????-test statistic for a hypothesis test about a population proportion?(b) ˆ???? is used in computing the standard error of ˆ???? in the large sample confidence interval for a population proportion?
What is the formula for the test statistic in a large sample ????-test for a hypothesis test about a population proportion?
For each of the following hypothesis tests, determine whether or not the large sample????-test is appropriate.(a) ????0 ∶ ???? = 0.60 and ???? = 100.(b) ????0 ∶ ???? ≤ 0.40 and ???? = 75.(c) ????0 ∶ ???? ≥ 0.95 and ???? = 50.(d) ????0 ∶ ???? ≤ 0.10 and ???? = 200.
Under what conditions can the large sample ????-test be used as the test statistic for a hypothesis test about a population proportion?
In a hypothesis test for a population proportion what does ????0 represent?
What are the three possible hypothesis tests that can be used when testing claims about a population proportion ?????
For each part in Exercise 7.27 use the guidelines for ????-values to interpret the strength of evidence against ????0 provided by the observed ????-value.
In each of the scenarios below, determine whether or not the observed sample provides sufficient evidence for rejecting the null hypothesis.(a) ???? = 0.05 and ???? = 0.003.(b) ???? = 0.02 and ???? = 0.068.(c) ???? = 0.05 and ???? = 0.23.(d) ???? = 0.01 and ???? = 0.002.(e) ???? = 0.04 and ???? =
Explain why a rejection region is not necessary when using a statistical computing package to carry out a hypothesis test.
What is the difference between a significance test and a hypothesis test?
Showing 2000 - 2100
of 5191
First
14
15
16
17
18
19
20
21
22
23
24
25
26
27
28
Last
Step by Step Answers