New Semester
Started
Get
50% OFF
Study Help!
--h --m --s
Claim Now
Question Answers
Textbooks
Find textbooks, questions and answers
Oops, something went wrong!
Change your search query and then try again
S
Books
FREE
Study Help
Expert Questions
Accounting
General Management
Mathematics
Finance
Organizational Behaviour
Law
Physics
Operating System
Management Leadership
Sociology
Programming
Marketing
Database
Computer Network
Economics
Textbooks Solutions
Accounting
Managerial Accounting
Management Leadership
Cost Accounting
Statistics
Business Law
Corporate Finance
Finance
Economics
Auditing
Tutors
Online Tutors
Find a Tutor
Hire a Tutor
Become a Tutor
AI Tutor
AI Study Planner
NEW
Sell Books
Search
Search
Sign In
Register
study help
business
biostatistics
Applied Biostatistics For The Health Sciences 2nd Edition Richard J. Rossi - Solutions
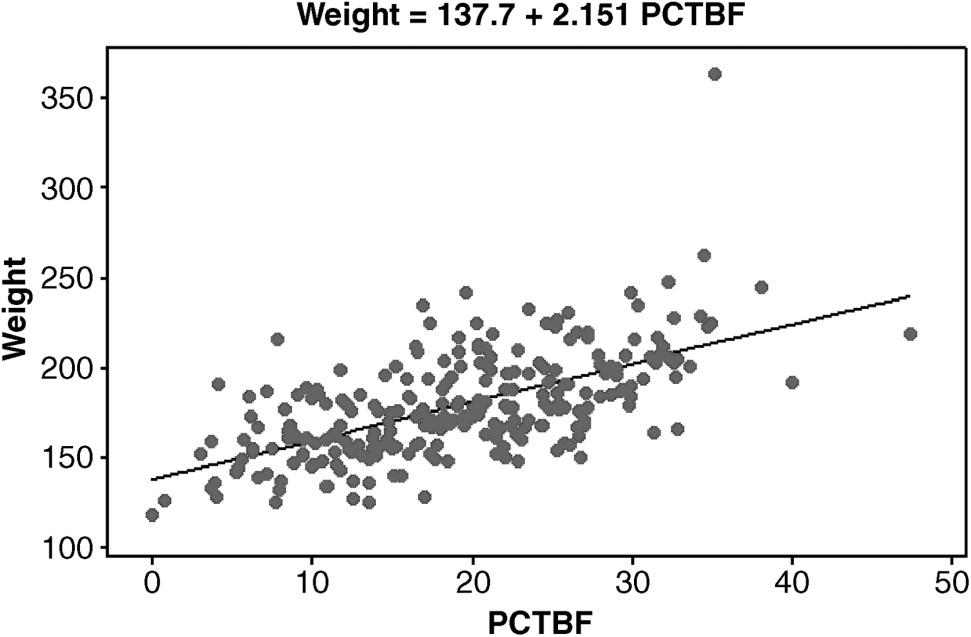
Figure 8.42 shows a fitted line plot for a simple linear regression model relating weight to percent body fat for adult males based on the Body Fat data set. Note that there is a bivariate outlier at approximately PCTBF = 35 and Weight = 360. Use the Body Fat data set to answer the following:(a)
Under what conditions can a bivariate outlier legitimately be deleted from a data set?
What is the procedure for investigating the influence of a bivariate outlier?
Using the Body Fat data set, fit a simple linear regression model for relating body density (????) to abdomen circumference (????). Then,(a) use the residuals to check the regression assumptions.(b) provided the regression assumptions appear to be satisfied, test whether or not there is a linear
Using the Body Fat data set, fit a simple linear regression model for relating chest circumference (????) to abdomen circumference (????). Then,(a) use the residuals to check the regression assumptions.(b) provided the regression assumptions appear to be satisfied, test whether or not there is a
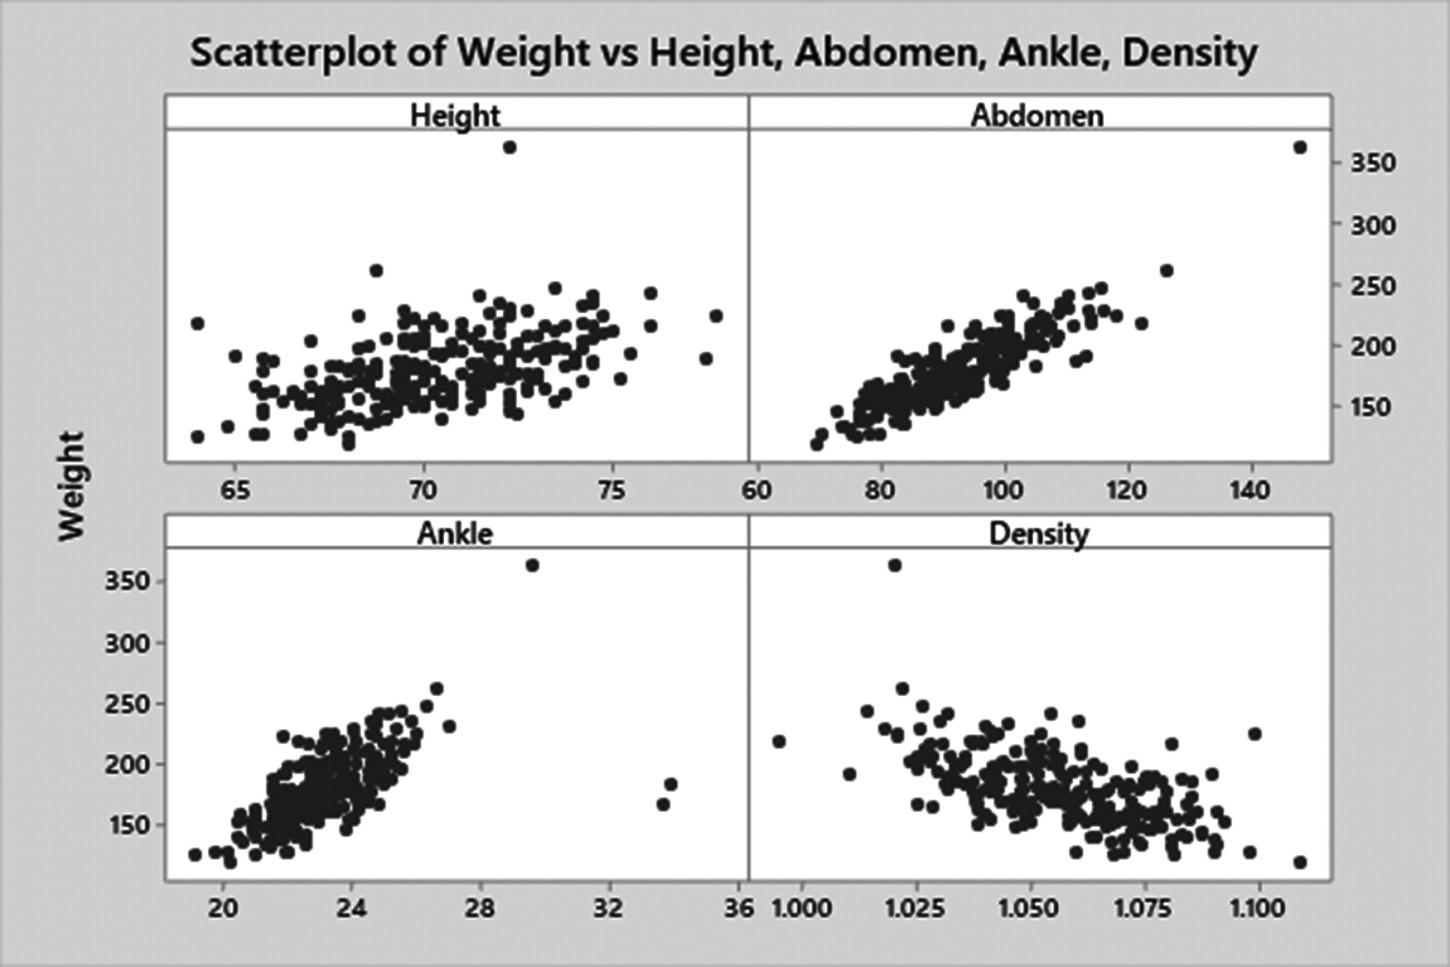
Using the Body Fat data set, fit a simple linear regression model for relating weight(????) to abdomen circumference (????). Then,(a) use the residuals to check the regression assumptions.(b) provided the regression assumptions appear to be satisfied, test whether or not there is a linear
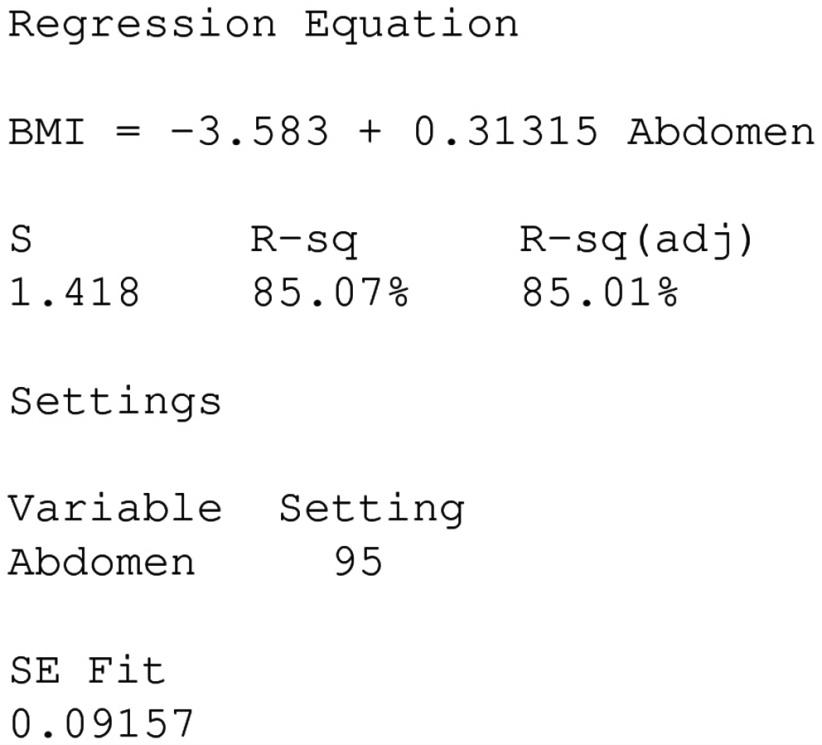
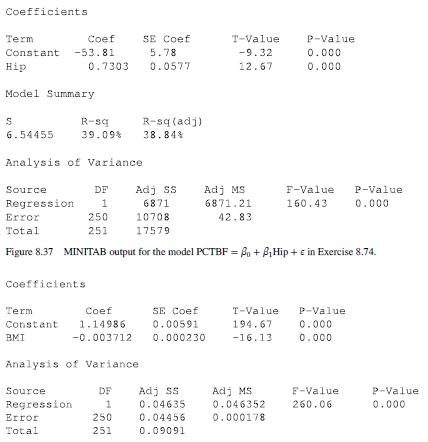
The MINITAB output given in Figure 8.41 is based on fitting a simple linear regression model relating body mass index (????) to chest circumference (????) using the data in the Body Fat data set (???? = 252). Use the information in Figure 8.41 to answer the following questions.(a) Estimate the mean
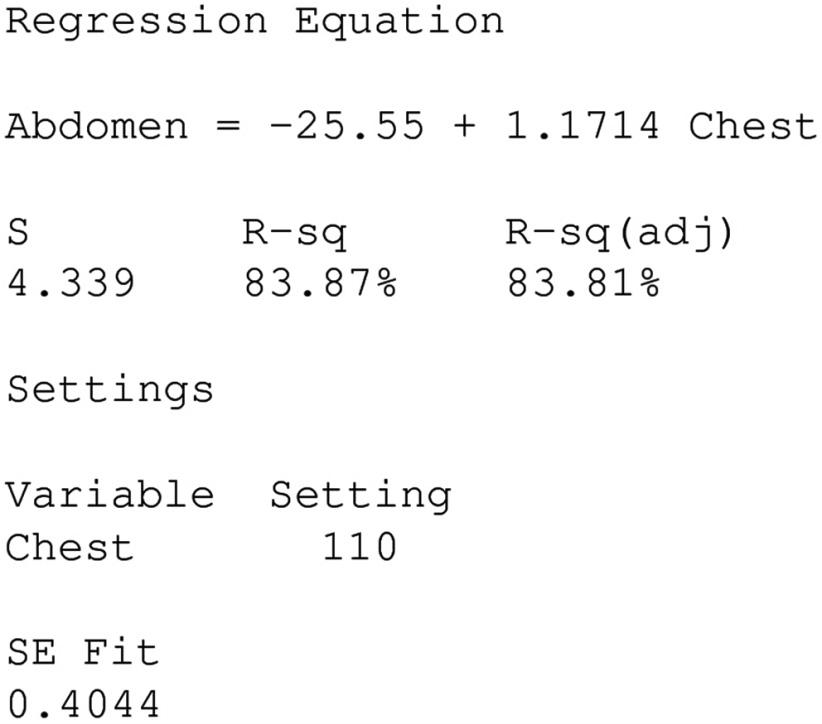
The MINITAB output given in Figure 8.40 is based on fitting a simple linear regression model relating abdomen circumference (????) to chest circumference (????) using the data in the Body Fat data set (???? = 252). Use the information in Figure 8.40 to answer the following questions.(a) Estimate
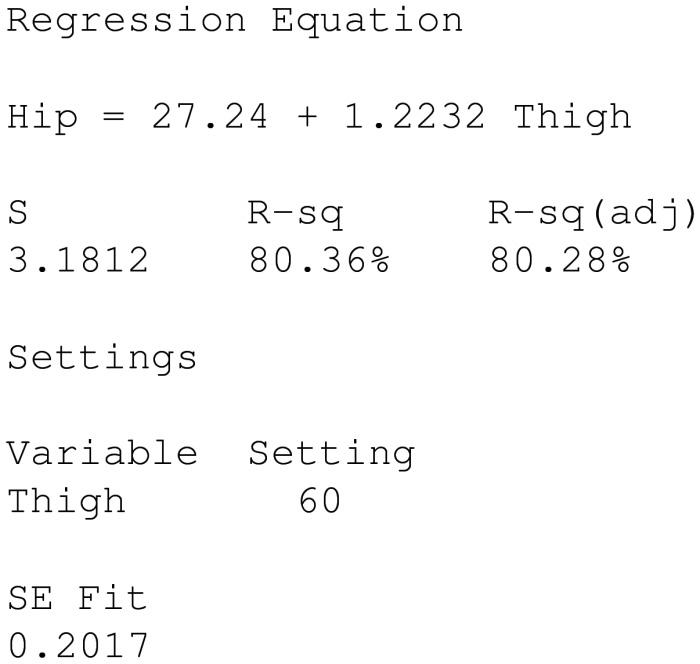
The MINITAB output given in Figure 8.39 is based on fitting a simple linear regression model relating hip circumference (????) to thigh circumference (????) using the data in the Body Fat data set (???? = 252). Use the information in figure 8.39 to answer the following questions.(a) Estimate the
Why is the prediction interval for the value of ???? when ???? = ????0 wider than the confidence interval for ????????|????=????0 ?
What happens to the width of a prediction interval for ????????|????=????0 as the value of ????0 moves away from ????̄?
What happens to the width of a confidence interval for ????????|????=????0 as the value of ????0 moves away from ????̄?
Why is the prediction error larger than the standard error for a given value of ?????
What is the relationship between the estimated standard error of ????????|????=????0 and the prediction error for ???? when ???? = ????0?
Why is it a bad idea to estimate a mean or predict a value of the response variable for a value of the explanatory variable well outside the range of the observed values of the explanatory variable?
What(a) are the two uses of the least squares regression line?(b) is the estimator of the mean value of ???? when ???? = ????0?(c) is the predicted value of ???? when ???? = ????0?
Using the Body Fat data set,(a) Fit a simple linear regression model for relating body density (????) to chest circumference (????).(b) Use the residuals to check the regression assumptions.(c) Provided the regression assumptions appear to be satisfied, test whether or not there is a linear
Using the Birth Weight data set,(a) Fit a simple linear regression model for relating baby’s birth weight (????) to mother’s weight at the last menstrual period (????).(b) Use the residuals to check the regression assumptions.(c) Provided the regression assumptions appear to be satisfied, test
In the article“Nonablative facial remodeling: erythema reduction and histologic evidence of new collagen formation using a 300-microsecond 1064-nm Nd:YAG laser”published in the Archives of Dermatology (Schmults et al., 2004), the data given in Table 8.7 were reported for a study of the change
The MINITAB output given in Figure 8.38 resulted from fitting the model Density = ????0 + ????1BMI + ????Use the MINITAB output given in Figure 8.38 to answer the following questions.(a) What is the equation of the least squares regression line?(b) What is the estimate of ?????(c) What is the
The MINITAB output given in Figure 8.37 resulted from fitting the model PCTBF = ????0 + ????1Hip + ????Use the MINITAB output given in Figure 8.37 to answer the following questions.(a) What is the equation of the least squares regression line?(b) What is the estimate of ?????(c) What is the
In the article “Speed of Psychosis Progression in People at Ultra-High Clinical Risk:a complementary meta-analysis” published in JAMA Psychiatry (Kempton, et al., 2015), the authors reported the results of a study on ultra-high risk (UHR) individuals and their transition times to psychosis. The
Assuming the normality assumption is valid,(a) test ????0 ∶ ????0 = 25 at the ???? = 0.05 level when ˆ????0 = 23.5, ????????(ˆ????0) = 1.39, and???? = 25.(b) approximate the ????-value associated with the value of ???????????????? in part (a).(c) determine whether or not there is sufficient
Assuming the normality assumption is valid, test ????0 ∶ ????1 = 0 versus ???????? ∶ ????1 ≠ 0 at the ???? = 0.05 level when(a) ˆ????1 = 0.61, ????????(ˆ????1) = 0.34, and ???? = 60.(b) ˆ????1 = −4.54, ????????(ˆ????1) = 1.12, and ???? = 60.(c) ˆ????1 = −4.54, ????????(ˆ????1) =
If ˆ????1 = 0.45 and ????????(ˆ????1) = 0.17 for a sample of ???? = 65 observations, determine(a) the value of ???????????????? for testing ????0 ∶ ????1 = 0.(b) the approximate ????-value for testing ????0 ∶ ????1 = 0.(c) whether or not there is sufficient statistical evidence to reject
For each part of Exercise 8.68, determine whether or not ????1 is significantly different from 0 using ???? = 0.05.
Assuming the normality assumption is valid, compute a 95% confidence interval for????1 when(a) ˆ????1 = −2.3, ????????(ˆ????1) = 0.5, and ???? = 40.(b) ˆ????1 = 11.8, ????????(ˆ????1) = 2.72, and ???? = 100.(c) ˆ????1 = 3.76, ????????(ˆ????1) = 0.98, and ???? = 95.
Assuming the normality assumption is valid, compute a 95% confidence interval for????0 when(a) ˆ????0 = 78.2, ????????(ˆ????0) = 14.5, and ???? = 61.(b) ˆ????0 = −20.5, ????????(ˆ????0) = 1.05, and ???? = 125.(c) ˆ????0 = 693.4, ????????(ˆ????0) = 198.0, and ???? = 75.
Assuming the normality assumption is valid, what is the formula for computing a(1 − ????) × 100% confidence interval for(a) ????0? (b) ????1?
What is the rejection region for a(a) upper-tail ????-test?(b) two-tailed ????-test?(c) lower-tail ????-test?
What is the form of the ???? statistic for testing(a) ????0 ∶ ????0 = 0? (b) ????0 ∶ ????1 = 0?(c) ????0 ∶ ????0 = 10? (d) ????0 ∶ ????1 = 2?
Under what conditions can a ???? distribution be used for making inferences about either????0 or ????1?
What is the formula for the estimated standard error of(a) ˆ????0? (b) ˆ????1?
Use the ANOV table given in Table 8.6 to answer the following questions.(a) Determine the estimate of ????.(b) Does the ????-ratio provide sufficient evidence for rejecting ????0 ∶ ????1 = 0? Explain.(c) Determine the value of the coefficient of determination.(d) Determine the percentage of the
For the partial ANOV table for a simple linear regression model given in Figure 8.5, determine the values of the missing entries.
What is the data suggesting when the ????-value associated with the observed ????-ratio is(a) ???? = 0.002? (b) ???? = 0.125?
What does it mean when the ????-ratio indicates there is insufficient evidence to reject????0 ∶ ????1 = 0?
What are the assumptions of the test based on the ????-ratio?
What are the null and alternative hypotheses tested by the ????-ratio in the ANOV table?
What are the components of an ANOV table?
What does an ANOV table summarize?
Determine the value of the sample correlation coefficient when(a) ???????????????????? = 9100, ???????????????????? = 7200, and ˆ????1 = −7.2.(b) ???????????????????? = 15200, ???????????? = 4100, and ˆ????1 = 14.3.
Determine the of ????2 when(a) ???? = 0.83.(b) ???? = −.77.
Determine the value of ????2 when(a) ???????????????????? = 2000 and ???????????????????? = 1200.(b) ???????????????????? = 12400 and ???????????? = 2400.(c) ???????????????????? = 500 and ???????????? = 250.
What does(a) ????2 measure?(b) ???????????? measure?(c) ???????????????????? measure?(d) the coefficient of determination measure?
What are the formulas for(a) ?????????????????????(b) ?????????????????????(c) ?????????????(d) ????2?
What are the degrees of freedom associated with ????e.
How is ????e computed from the information contained in the residuals?
What is the least squares estimator of ?????
Using the Body Fat data set with body density as the response variable and abdomen circumference as the explanatory variable(a) fit a simple linear regression model relating density to abdomen circumference.(b) create a residual plot for the residuals associated with the fitted model.(c) create a
Using the Body Fat data set with weight as the response variable and chest circumference as the explanatory variable(a) fit a simple linear regression model relating weight to chest circumference.(b) create a residual plot for the residuals associated with the fitted model.(c) create a normal
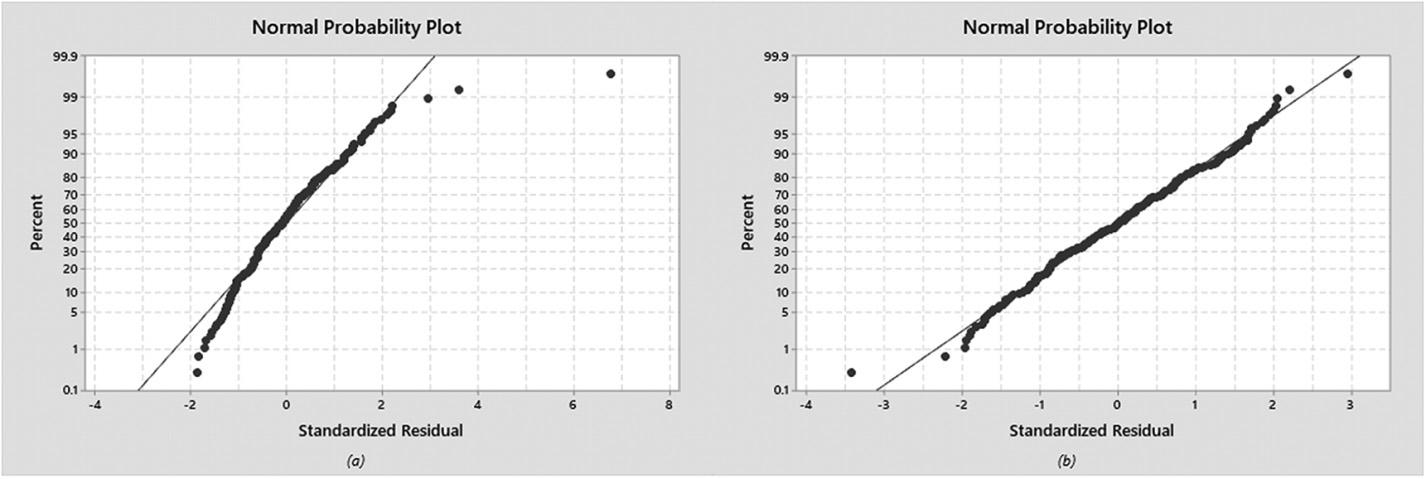
Interpret and summarize each of the residual plots in Figure 8.36. (a) 99.9 99- Percent 95- 90- 801 70 60 50 40 30. 20- 10- 5- 1 0.1- -4 -2 0 2 Standardized residual (b) 99.9 99 95 90 Percent 80 70 60 50 40. 30 20 10 5 1 0.1 4 6 -3 -2 -1 0 1 2 3 Standardized residual
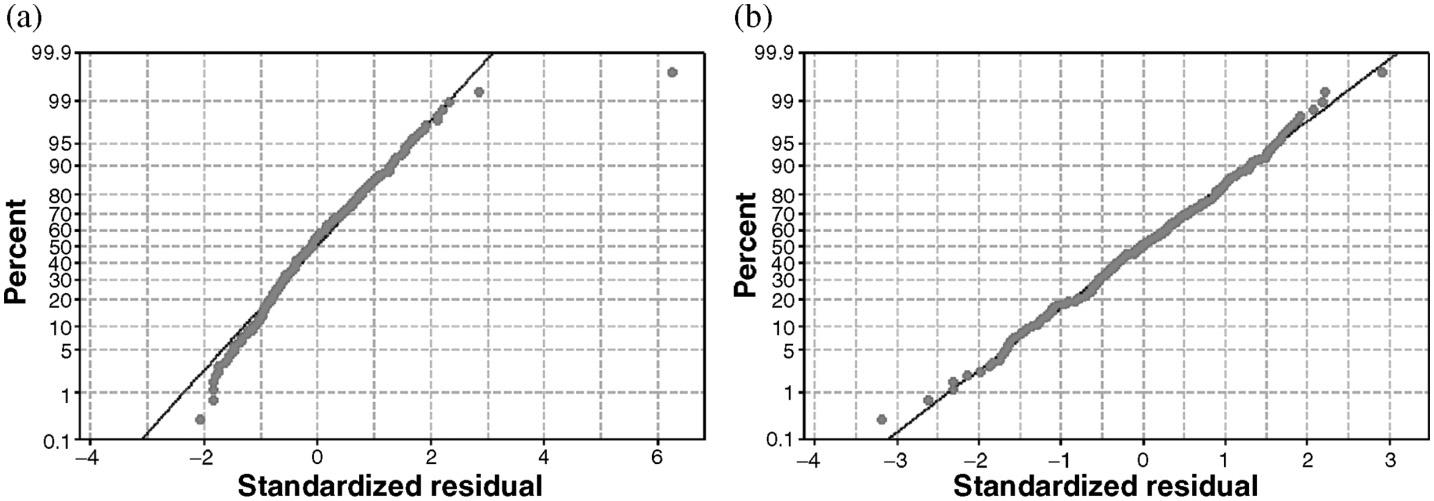
Determine whether or not each of the normal probability plots in Figure 8.35 supports the normality assumption of the simple linear regression model.
What is the(a) fat pencil test?(b) quantity plotted in a normal probability plot to check the normal assumption of the simple linear regression model?
What is the transformation that might be used to cure a nonconstant variation problem suggested by a residual plot?
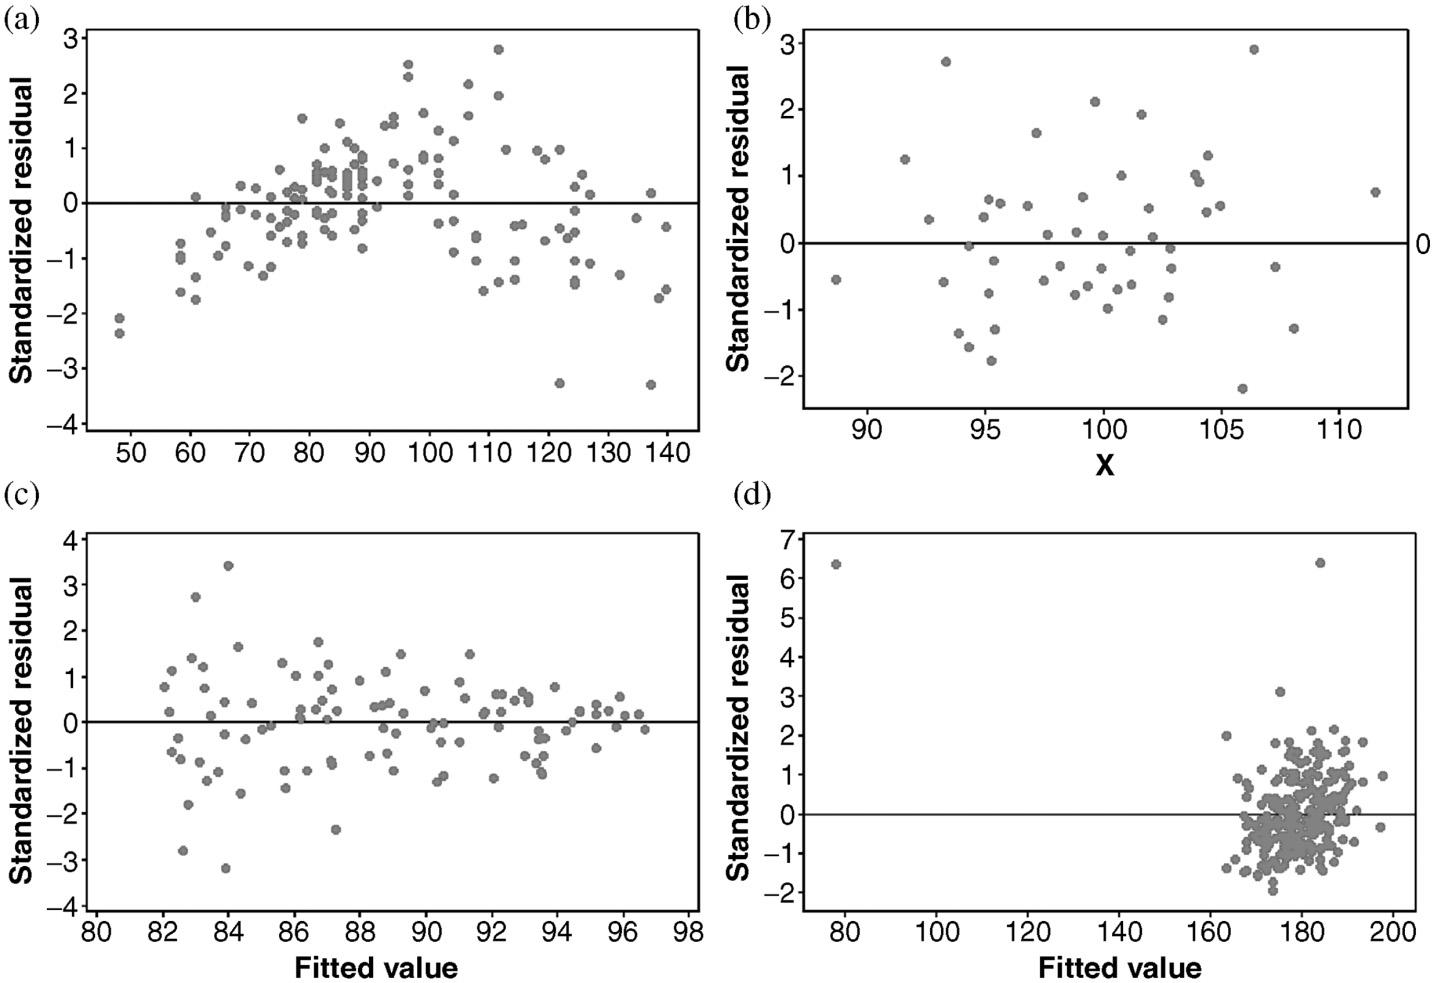
Examine and interpret each of the following residual plots. Be sure to identify any suggested violation of the simple linear regression assumptions and bivariate outliers. (a) Standardized residual 3 T 000 Standardized residual 3 (c) 50 60 70 80 90 100 110 120 130 140 (d) 90 95 Standardized
What is the procedure that should be used for investigating the influence of an outlier?
If an observation has a standardized residual of ???????? = 6, what can be said about how the simple linear regression model is fitting this observation?
What pattern will be revealed in a residual plot when there(a) are no apparent problems?(b) is a violation of the constant variation assumption?(c) is a violation of the linearity assumption?(d) is one or more bivariate outliers in the observed data?
How is a residual plot used in assessing the validity of the assumptions required of the error term in a simple linear regression model?
What is a residual plot?
Why is it unlikely for a standardized residual to fall outside of the interval −3 to 3?
How is a standardized residual different from a residual?
When fitting a simple linear regression model, what is a(a) a residual?(b) a standardized residual?(c) an unusually large value of a standardized residual?
In the article “Iron overload indices rise linearly with transfusion rate in patients with sickle cell disease” published in Blood, the authors reported a simple linear regression model for relating serum ferritin (SF) to total lifetime transfusions (TLT).The resulting fitted model, based on
Use the least squares regression lines found in Exercise 8.28 to predict PCTBF when(a) Chest=105.(b) Abdomen=120.(c) Wrist=17.
Using the Body Fat data set, determine the equation of the least squares regression line for relating percent body fat (PCTBF) to(a) chest circumference (Chest).(b) abdomen circumference (Abdomen).(c) wrist circumference (Wrist).
Compute the values of the least squares estimates of ????0 and ????1 and report the equation of the least squares regression line when(a) ???? = 0.85, ????̄ = 25.2, ????̄ = 56.3, ???????? = 6.8, and ???????? = 12.7.(b) ???? = −0.75, ????̄ = 117.5, ????̄ = 23.8, ???????? = 13.1, and ???????? =
How is ˆ????1 different from ????1?
How is ˆ????0 different from ????0?
What is the formula for the least squares estimate of the(a) intercept?(b) slope?(c) line of means?
What is the method of least squares?
What are the possible problems that can arise when a simple linear regression model is used when(a) the explanatory variable is measured with error?(b) there is a nonlinear relationship between the response and the explanatory variable?(c) the error term does not have mean 0?(d) the standard
What does the term homoscedasticity mean?
What are the assumptions associated with a simple linear regression model?
What is the line of means associated with a simple linear regression model?
What does the error term ???? explain in a simple linear regression model?
What does the slope in a simple linear regression model measure?
What are the parameters in a simple linear regression model?
What is the equation of a simple linear regression model for relating a response variable ???? to an explanatory variable ?????
What is the equation of a straight line?
Using the Body Fat data set,(a) create scatterplots of Density versus Age, Density versus Neck, and Density versus Chest.(b) describe the patterns of the data clouds in the scatterplots in part (a).(c) compute the correlation between Density, Age, Neck, and Chest.(d) determine which of the
Using the Birth Weight data set(a) create a scatterplot of baby’s birth weight (BWT) versus mother’s weight at the last menstrual period (LWT).(b) describe the pattern of the data cloud in the scatterplot created in part (a).(c) estimate the correlation between baby’s birth weight (BWT) and
In the article “Association of UV index, latitude, and melanoma incidence in nonwhite populations: US surveillance, Epidemiology, and end results (SEER) program, 1992 to 2001” published in the Archives of Dermatology (Eide and Weinstock, 2005), the authors report a correlation of ???? = −0.85
Why is it possible for the value of ???? to be approximately 0 when there is a strong relationship between two variables?
How is a bivariate outlier identified in a scatterplot?
Assuming the data in the scatterplot is linear, summarize the strength of the linear relationship between two variables according to the guidelines given in Table 8.1 when the sample correlation is(a) ???? = −0.12.(b) ???? = 0.89.(c) ???? = −0.93.(d) ???? = 0.33.(e) ???? = 0.67. Weight 350 300
Why is it inappropriate to report the value of ???? when the data cloud in the scatterplot has a curvilinear data cloud?
Using the four scatterplots given in Figure 8.34 with correlations 0.89, 0.61, 0.49, and −0.59, determine which of the scatterplots(a) suggest a positive linear relationship.(b) suggest a negative linear relationship.(c) has a correlation of ???? = 0.89.(d) has a correlation of ???? = 0.49.(e)
Why is it important to investigate the data cloud in a scatterplot before computing the value of the sample correlation coefficient?
What is the difference between ???? and Pearson’s correlation coefficient ?????
What property does the correlation coefficient measure?
What are the possible patterns a data cloud can take on in a scatterplot?
What is the simplest statistical model for relating a response variable to an exploratory variable?
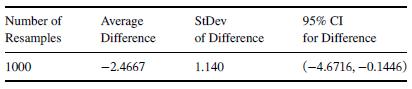
Suppose random samples were selected independently from the ???? and ???? populations with ???????? = 15 and ???????? = 18, and suppose further, the normality assumptions of the two-sample ????-test do not appear to be valid. Use the information in Table 7.43 for the bootstrap sampling distribution
Using the Exerbike data set,(a) determine the mean and standard deviation of calories burned per minute(Cals/M) for 2019.(b) determine the mean and standard deviation of calories burned per minute(Cals/M) for 2020.(c) test ????0 ∶ ????19 ≥ ????20 at the ???? = 0.05 level.(d) compute a 95%
In the article “Relationship of collegiate football experience and concussion with hippocampal volume and cognitive outcomes” published in JAMA (Singh, et al., 2014), the authors reported the results of a study assessing the relationship between concussion history and years of football
Determine the common sample size (i.e., ???????? = ????????) for a two-sample ????-test when???????? ≈ ???????? and(a) ????̇ = 20, ???? = 5, ???? = 0.05, and ???? = 0.10 for an upper-tail test.(b) ????̇ = 40, ???? = 5, ???? = 0.05, and ???? = 0.05 for a lower-tail test.(c) ????̇ = 20, ???? =
Using the Coronary Heart Disease data set(a) estimate the mean age and the standard deviation for individuals with coronary heart disease (????C).(b) estimate the mean age and the standard deviation for individuals without coronary heart disease (????NC).(c) test ????0 ∶ ????C = ????NC at the
In the article “Age at first experience of gender dysphoria among transgender adults seeking gender-affirming surgery” published in JAMA Network Open (Zaliznyak et al., 2020), the authors reported the summary statistics for age of first gender dysphoria (GD) event for males and females given in
Showing 1900 - 2000
of 5191
First
13
14
15
16
17
18
19
20
21
22
23
24
25
26
27
Last
Step by Step Answers