New Semester
Started
Get
50% OFF
Study Help!
--h --m --s
Claim Now
Question Answers
Textbooks
Find textbooks, questions and answers
Oops, something went wrong!
Change your search query and then try again
S
Books
FREE
Study Help
Expert Questions
Accounting
General Management
Mathematics
Finance
Organizational Behaviour
Law
Physics
Operating System
Management Leadership
Sociology
Programming
Marketing
Database
Computer Network
Economics
Textbooks Solutions
Accounting
Managerial Accounting
Management Leadership
Cost Accounting
Statistics
Business Law
Corporate Finance
Finance
Economics
Auditing
Tutors
Online Tutors
Find a Tutor
Hire a Tutor
Become a Tutor
AI Tutor
AI Study Planner
NEW
Sell Books
Search
Search
Sign In
Register
study help
business
statistics alive
Introduction To Probability And Statistics 15th Edition William Mendenhall Iii , Robert Beaver , Barbara Beaver - Solutions
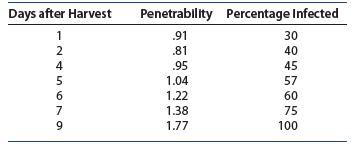
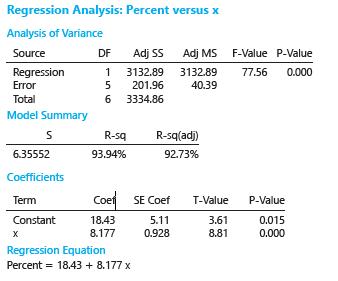
6. Avocado Research Certain avocado varieties supposedly are resistant to fruit fly infestation before they soften as a result of ripening. The data in the table resulted from an experiment in which avocados ranging from 1 to 9 days after harvest were exposed to Mediterranean fruit flies.
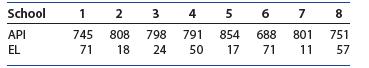
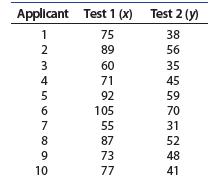
5. Achievement Tests II An educator studied the relationship between the Academic Performance Index (API), a measure of school achievement, and the percentage of students who are considered English Learners (EL). The following table shows the API for eight elementary schools along with the
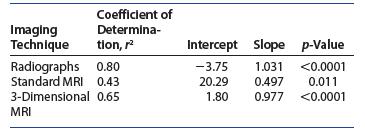
4. Knee Injuries Athletes and others with knee injuries often require ligament reconstruction. In order to determine the proper length of bone grafts, experiments were done using three imaging techniques, and these results were compared to the actual length required. A summary of the results of a
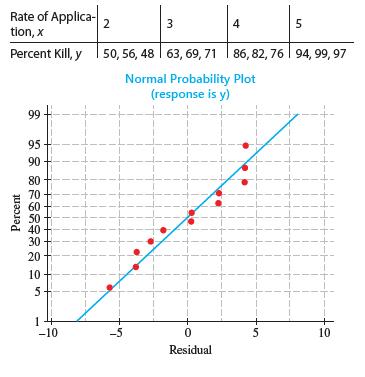
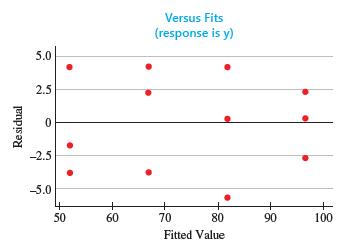
3. Nematodes Some varieties of nematodes, roundworms that live in the soil and feed on the roots of lawn grasses and other plants, can be treated by the application of nematicides. Data collected on the percent kill of nematodes for various rates of application (dosages given in pounds per acre of
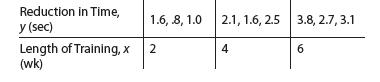
2. Track Stats! To investigate the effect of a training program on the time to complete the 100-yard dash, nine students were placed in the program. The reduction y in time to complete the race was measured for three students at the end of 2 weeks, for three at the end of 4 weeks, and for three at
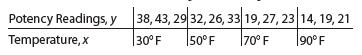
1. Potency of an Antibiotic An experiment was conducted to observe the effect of an increase in temperature on the potency of an antibiotic. Three 30-gram portions of the antibiotic were stored for equal lengths of time at each of these temperatures: 308 F, 508 F, 708 F, and 908 F, and their
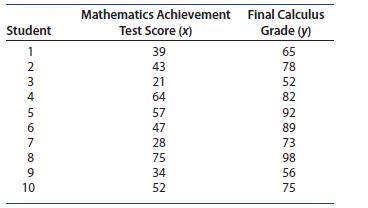
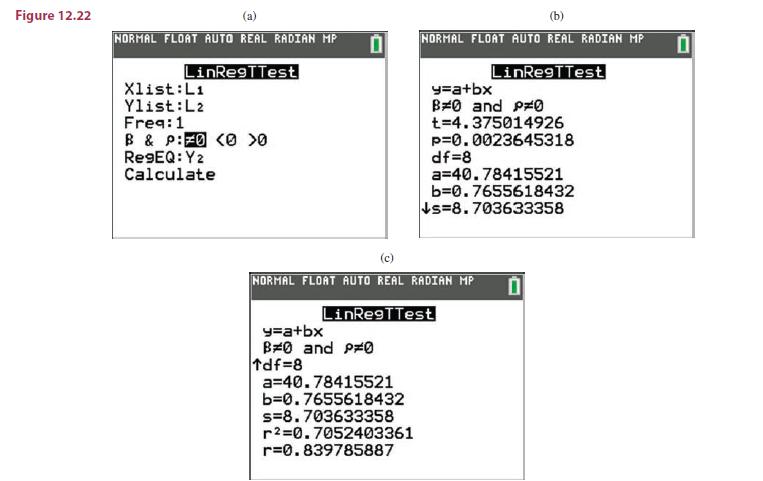
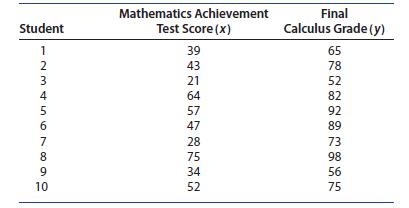
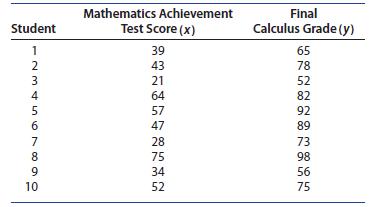
Refer to Table 12.1, in which the relationship between x5mathematics achievement test score and y5final calculus grade was studied.1. Enter the data from columns 2 and 3 into L1 and L2 and choose stat ➤ TESTS ➤F:LinRegTTest (choice E on the TI-83). The screen in Figure 12.22(a) will
Refer to Table 12.1, in which the relationship between x5mathematics achievement test score and y5final calculus grade was studied.\Enter the values for x and y into the first two columns of a MINITAB worksheet.1. The main tools for linear regression analysis are generated using Stat ➤ Regression
Refer to Table 12.1, in which the relationship between x5mathematics achievement test score and y5final calculus grade was studied.Enter the values for x and y into columns A and B of an Excel spreadsheet.1. Use Data ➤ Data Analysis ➤ Regression to generate the Dialog box in Figure
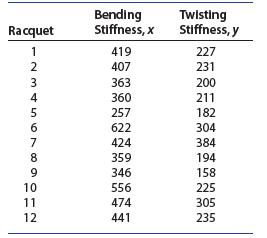
17. Tennis, Anyone? Tennis racquets vary in their physical characteristics. The data in the accompanying table give measures of bending stiffness and twisting stiffness as measured by engineering tests for 12 tennis racquets:a. If a racquet has bending stiffness, is it also likely to have twisting
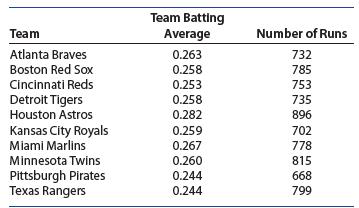
16. Baseball Stats Does a team’s batting average depend in any way on the number of runs scored by the team? The data in the table are the 2017 team batting averages and the number of runs for a sample of 10 MLB teams.a. Plot the points using a scatterplot. Does it appear that there is any
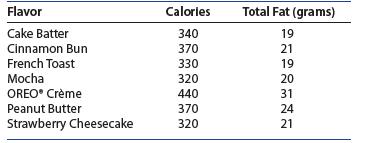
14. Ice Cream, Anyone? The popular ice cream franchise Coldstone Creamery posted the nutritional information for its ice cream offerings in three serving sizes—“Like it,” “Love it,” and “Gotta Have it”—on their website.18 A portion of that information for the “Like it” serving
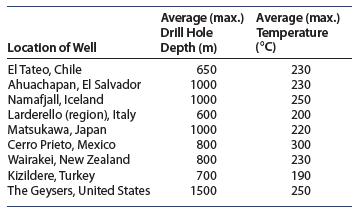
13. Geothermal Power Geothermal power is an important source of energy. Since the amount of energy contained in 1 pound of water is a function of its temperature, you might wonder whether water obtained from deeper wells contains more energy per pound. The data in the table are reproduced from an
12. Hockey II Refer to Exercise 11. The sample correlation coefficient r for the stride rate and the average acceleration rate for the 69 skaters was .36. Do the data provide sufficient evidence to indicate a correlation between stride rate and average acceleration for the skaters? Use the p-value
11. Hockey A researcher was interested in a hockey player’s ability to make a fast start from a stopped position.16 In the experiment, each skater started from a stopped position and skated as fast as possible over a 6-meter distance. The correlation coefficient r between a skater’s stride rate
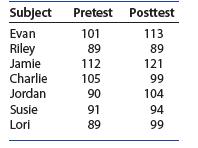
10. Social Skills Training A social skills training program was implemented with seven special needs students in a study to determine whether the program caused improvement in pre/post measures and behavior ratings. For one such test, the pre- and posttest scores for the seven students are given in
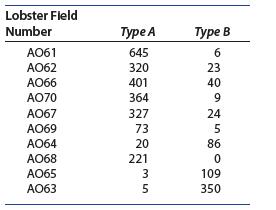
9. Lobster The table gives the numbers of two types of barnacles, A and B, on each of 10 lobsters.14 Does it appear that the barnacles compete for space on the surface of a lobstera. If they do compete, do you expect the number x of type A and the number y of type B barnacles to be positively or
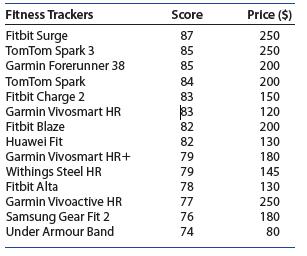
8. Fitness Trackers You can monitor every step you take, your speed, your pace, or some other aspect of your daily activity. The data that follows lists the overall rating scores for 14 fitness trackers and their prices.13a. Use a scatterplot of the data to check for a relationship between the
The data points given in Exercises 7 were formed by reversing the slope of the lines in Exercises 5. Plot the points on graph paper and calculate r and r2. Notice the change in the sign of r and the relationship between the values of r2 compared to Exercises 5.By what percentage was the sum of
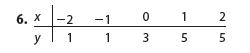
The data points given in Exercises 6 were formed by reversing the slope of the lines in Exercises 4. Plot the points on graph paper and calculate r and r2. Notice the change in the sign of r and the relationship between the values of r2 compared to Exercises 4.By what percentage was the sum of
Based on the graph, what will be the sign of the correlation coefficient? Then calculate the correlation coefficient, r, and the coefficient of determination, r2. Is the sign of r as you expected? 5. x 1 y 7 5 25 R 3 4 5 6 5 3 2 0
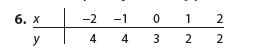
Based on the graph, what will be the sign of the correlation coefficient? Then calculate the correlation coefficient, r, and the coefficient of determination, r2. Is the sign of r as you expected? 4. x y -2 -1 -1012 2 2 3 4 4
3. What value does r assume if all the data points fall on the same straight line in these cases?a. The line has positive slope.b. The line has negative slope.
2. Describe the significance of the algebraic sign and the magnitude of r.
1. How does the coefficient of correlation measure the strength of the linear relationship between two variables y and x?
Refer to the height and weight data in Example 12.7. The correlation of height and weight was calculated to be r5.8261. Is this correlation significantly different from 0?
The heights and weights of n510 offensive backfield football players are randomly selected from a county’s football all-stars. Calculate the correlation coefficient for the heights (in inches) and weights (in pounds) given in Table 12.4.
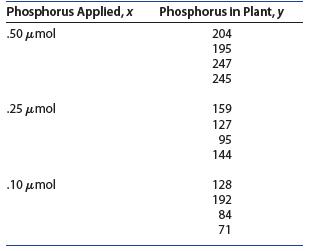
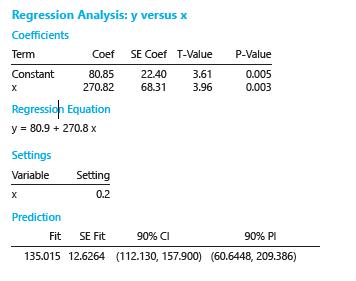
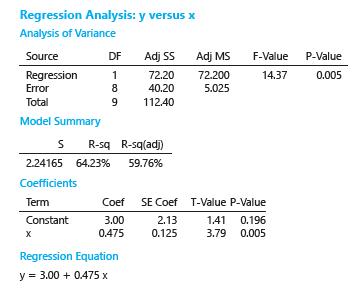
18. Plant Science An experiment was conducted to determine the effect of various levels of phosphorus on the inorganic phosphorus levels in Sudan grass. The data in the table represent the levels of inorganic phosphorus in micromoles(mmol) per gram dry weight. Use the MINITAB output to answer the
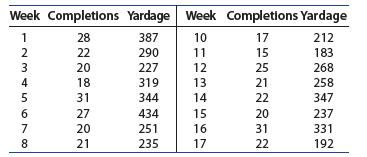
17. Philip Rivers, continued Refer to Exercise 16.a. Estimate the average number of passing yards for games in which Rivers throws 20 completed passes using a 95% confidence interval.b. Predict the actual number of passing yards for games in which Rivers throws 20 completed passes using a 95%
16. Philip Rivers The number of passes completed and the total number of passing yards were recorded for the Los Angeles Chargers quarterback, Philip Rivers for each of the 16 regular season games that he played in the fall of 2017.12 Week 9 was a“bye” week, and no data were recorded.a. What is
15. Strawberries III The following data(Exercise 16, Section 12.2) were obtained in an experiment relating the dependent variable y (texture of strawberries) with x (coded storage temperature).a. Estimate the expected strawberry texture for a coded storage temperature of x521. Use a 99% confidence
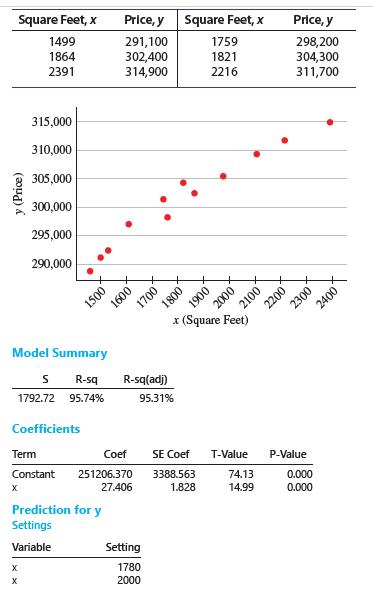
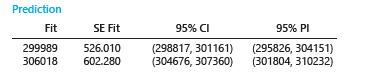
14. Housing Prices II Refer to Exercise 13.a. Estimate the average increase in the price for an increase of 1 square foot for houses sold in the city. Use a 99% confidence interval. Interpret your estimate.b. A real estate salesperson needs to estimate the average sales price of houses with a total
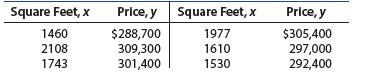
13. Housing Prices The data in the table give the square footages and sales prices of n512 houses randomly selected from those sold in a small city.Use the partial MINITAB printout to answer the questions.a. Can you see any pattern other than a linear relationship in the original plot?b. The value
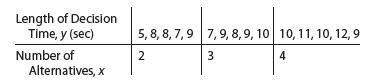
12. What to Buy? A marketing research experiment was conducted to study the relationship between the length of time necessary for a buyer to reach a decision and the number of alternative package designs of a product presented. The products were identical except for the package design. The length
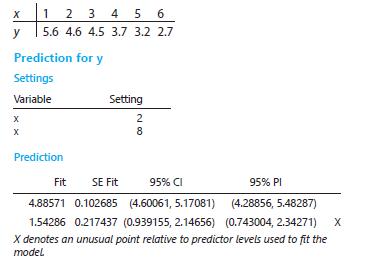
Use the data set and the MINITAB output(Exercise 18, Section 12.1) below to answer11. The last line in the second section of the printout indicates a problem with one of the fitted values. What value of x corresponds to the fitted value yˆ51.54286?What problem has the MINITAB program detected? x 1
Use the data set and the MINITAB output(Exercise 18, Section 12.1) below to answer10. Find a 95% prediction interval for some value of y to be observed in the future when x52. x 1 2 3 4 5 6 y 5.6 4.6 4.5 3.7 3.2 2.7 Prediction for y Settings Variable X X Setting 28 Prediction Fit SE Fit 95% CI 95%
Use the data set and the MINITAB output(Exercise 18, Section 12.1) below to answer9. Find a 95% confidence interval for the average value of y when x52. x 1 2 3 4 5 6 y 5.6 4.6 4.5 3.7 3.2 2.7 Prediction for y Settings Variable X X Setting 28 Prediction Fit SE Fit 95% CI 95% Pl 4.88571 0.102685
Use the data set below to answer8. Find a 90% prediction interval for some value of y to be observed in the future when x=1. x -2 -1 0 1 2 y 11355
Use the data set below to answer7. Estimate the average value of y when x=1, using a 90% confidence interval. x -2 -1 0 1 2 y 11355
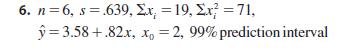
find a prediction interval for a particular value of y when x=x0 . Is the interval wider than the corresponding confidence interval from Exercises 3–4? 6. n=6, s.639, x, = 19, x = 71, =3.58+.82x, x = 2, 99% prediction interval
find a prediction interval for a particular value of y when x=x0 . Is the interval wider than the corresponding confidence interval from Exercises 3–4? 5. n=10, SSE = 24, x = 59, Ex = 397, y=.074+.46x, x = 5, 90% prediction interval =5, 0
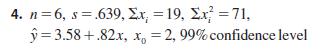
find a confidence interval for the average value of y when x=x0 . 4. n=6, s.639, x, = 19, x = 71, =3.58+.82x, x = 2, 99% confidence level
find a confidence interval for the average value of y when x=x0 . 3. n=10, SSE = 24, x, 59, Ex=397, =.074+.46.x, x = 5, 90% confidence level
2. If the experimenter stays within the experimental region, when will the error in predicting a particular value of y be a maximum? When will it be a minimum?
1. In addition to increasingly large bounds on error, why should an experimenter refrain from predicting y for values of x outside the experimental region?
Prior to fitting a line to the calculus grade-achievement score data, you may have thought that a score of 0 on the achievement test would predict a grade of 0 on the calculus test. This implies that we should fit a model with a equal to 0. Do the data support the hypothesis of a 0 intercept?
A student took the achievement test and scored 50 but has not yet taken the calculus test.Using the information in Example 12.1, predict the calculus grade for this student with a 95%prediction interval.
Use the information in Example 12.1 to estimate the average calculus grade for students whose achievement score is 50, with a 95% confidence interval.
9. How to Choose a TV Consumer Reports11 gave the prices and screen sizes for the top 10 LCD TVs in the 46-inch and higher categories.Does the price of an LCD TV depend on the size of the screen?a. Assuming that the relationship between size and price is linear, we perform a linear regression,
8. Laptops and Learning, again Refer to the data given in Exercise 16 (Section 12.3). The MINITAB printout is reproduced herea. What assumptions must be made about the distribution of the random error ?b. What is the best estimate of 2 s , the variance of the random error ?c. Use the diagnostic
7. Professor Asimov, again Refer to Exercise 11(Section 12.2), in which the number of books x written by Isaac Asimov are related to the number of months y he took to write them. A plot of the data is showna. Can you see any pattern other than a linear relationship in the original plot?b. The value
6. Chirping Crickets Refer to Exercise 11 (Section 12.3), in which the number of chirps per second for a cricket was recorded at 10 different temperatures. Use the MINITAB diagnostic plots to comment on the validity of the regression assumptions. Percent 99 95 90 80 70 60 40 30 20 10 5 1 Residual
5. Old Faithful The waiting time between eruptions of Old Faithful geyser in Yellowstone National Park (y)depends upon the length of time of the last eruption(x). The residual plots that follow are based on the following data.10Is there anything unusual about either of these plots?Does it appear
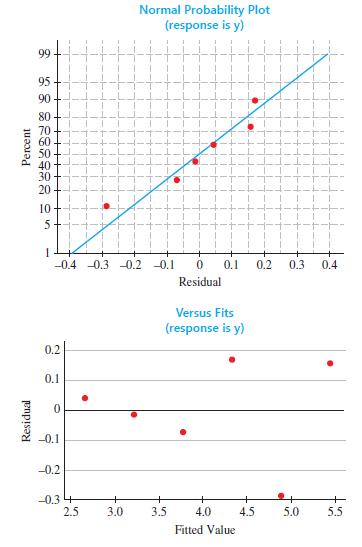
4. The normal probability plot and the residuals versus fitted values were generated using the MINITAB regression analysis program for the data that follow(Exercise 18, Section 12.1).Does it appear that any regression assumptions have been violated? Explain. x 1 2 2 3 4 5 6 y 5.6 4.6 4.5 3.7 3.2 2.7
3. What diagnostic plot can you use to determine whether the assumption of equal variance has been violated? What should the plot look like when the variances are equal for all values of x?
2. What diagnostic plot can you use to determine whether the incorrect model has been used? What should the plot look like if the correct model has been used?
1. What diagnostic plot can you use to determine whether the data satisfy the normality assumption?What should the plot look like for normal residuals?12.4 Exercises
17. Armspan and Height II In Exercise 22(Section 12.1), we measured the armspan and height of eight people with the following results:a. Do the data provide sufficient evidence to indicate that there is a linear relationship between armspan and height? Test at the 5% level of significance.b.
16. Laptops and Learning An informal experiment was conducted at McNair Academic High School in Jersey City, New Jersey. Twenty freshman algebra students were given a survey at the beginning of the semester, measuring his or her skill level. They were then allowed to use laptop computers both at
15. Strawberries II The following data(Exercise 16, Section 12.2) were obtained in an experiment relating the dependent variable, y(texture of strawberries), with x (coded storage temperature).Construct the ANOVA table or use the information from Exercise 16 (Section 12.2) to answer the following
14. Sleep Deprivation, again Subjects in a sleep deprivation experiment were asked to solve a set of simple addition problems after having been deprived of sleep for a specified number of hours. The number of errors was recorded along with the number of hours without sleep. The results, along with
13. Professor Asimov, continued Refer to the data in Exercise 11 (Section 12.2), relating x, the number of books written by Professor Isaac Asimov, to y, the number of months he took to write his books (in increments of 100). The data are reproduced belowa. Do the data support the hypothesis that b
12. Gestation Times and Longevity The table below shows the gestation time in days and the average longevity in years for a variety of mammals in captivitya. If you want to estimate the average longevity of an animal based on its gestation time, which variable is the response variable and which is
11. Chirping Crickets Male crickets chirp by rubbing their front wings together, and their chirping is temperature dependent. The table below shows the number of chirps per second for a cricket, recorded at 10 different temperatures:a. Find the least-squares regression line relating the number of
10. Recidivism Recidivism refers to the return to prison of a prisoner who has been released or paroled. The data that follow reports the group median age at which a prisoner was released from a federal prison and the percentage of those arrested for another crime.7 Use the MS Excel printout to
9. Lots of Highways The number of miles of U.S. urban roadways (millions of miles) for the years 2000–2015 is reported below.6 The years are simplified as years 0 through 15.a. Draw a scatterplot of the number of miles of roadways in the U.S. over time. Describe the pattern that you see.b. Find
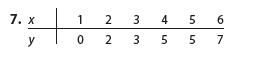
calculate the coefficient of determination, r2.What information does this value give about the usefulness of the linear model? x-2 -2-101 7. x 2 1 1 3 5 5
calculate the coefficient of determination, r2.What information does this value give about the usefulness of the linear model? 8. x 1 2 3 4 5 6 y 5.6 4.6 4.5 3.7 3.2 2.7
Do the data provide sufficient evidence to indicate that y and x are linearly related? Test using the t statistic at the 1% level of significance. Construct a 99% confidence interval for the slope of the line. What does the phrase“99% confident” mean? 6. x 1 2 3 4 5 6 y 5.6 4.6 4.5 3.7 3.2 2.7
Do the data provide sufficient evidence to indicate that y and x are linearly related? Test using the t statistic at the 1% level of significance. Construct a 99% confidence interval for the slope of the line. What does the phrase“99% confident” mean? 5. 0 1 2 55 x-2-1 -2-1 y 1 1 3 1 1 3
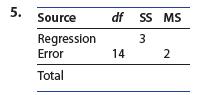
Fill in the missing entries in the analysis of variance table for a simple linear regression analysis and test for a significant regression with a 5.05 in Exercises 4. Calculate the coefficient of determination, r2, and interpret its significance. 4. Source Regression Error Total df SS MS F 14 3 2
Fill in the missing entries in the analysis of variance table for a simple linear regression analysis and test for a significant regression with a 5.05 in Exercises 3. Calculate the coefficient of determination, r2, and interpret its significance. SS MS F 3. Source Regression Error Total df 4.3 19
construct an ANOVA table for a simple linear regression analysis. Use the ANOVA F-test to test H :b 50 0 with a 5.05. Then calculate b and its standard error. Use a t statistic to test H :b 50 0 with a 5.05. Verify that within rounding t2 F 5 1. n 8 pairs (x, y), S = 4, S=20, Sxy= =8 xXxX
Find a 95% confidence interval estimate of the slope b for the calculus grade data in Table 12.1
Determine whether there is a significant linear relationship between the calculus grades and test scores listed in Table 12.1. Test at the 5% level of significance
16. Strawberries The following data were obtained in an experiment relating the dependent variable, y (texture of strawberries), with x(coded storage temperature).a. Find the least-squares line for the data.b. Plot the data points and graph the least-squares line as a check on your calculations.c.
15. Test Interviews Of two personnel evaluation methods, the first requires a two-hour test interview while the second can be completed in less than an hour. The scores for each of the 15 individuals who took both tests are given in the next table.a. Construct a scatterplot for the data. Does the
14. Achievement Tests The Academic PerformanceIndex (API) is a measure of school achievement based on the results of the Stanford 9 Achievement test. Scores range from 200 to 1000, with 800 considered a long-range goal for schools. The following table shows the API (y) for eight elementary schools,
13. Sleep Deprivation A study was conducted to determine the effects of sleep deprivation on people’s ability to solve problems. Ten subjects participated in the study, two at each of five sleep deprivation levels—8, 12, 16, 20, and 24 hours. After his or her specified sleep deprivation period,
12. A Chemical Experiment A chemist measured the peak current generated (in microamperes)when a solution containing a given amount of nickel (in parts per billion) is added to a buffera. Use the data entry method for your calculator to calculate the preliminary sums of squares and crossproducts,
11. Professor Asimov Professor Isaac Asimov wrote nearly 500 books during a 40-year career. In fact, as his career progressed, he became even more productive in terms of the number of books written within a given period of time.3 The data give the time in months required to write his books in
10. Body Mass Index A study using body mass index (BMI)—an index of obesity—as a function of income ($ thousands) reported the following data for California in 2016a. If the researcher thinks that BMI is a function of income, which of the two variables is the independent variable x and which is
9. Grocery Costs The amount spent on groceries per week (y) and the number of household members(x) from Example 3.3 are shown belowa. Find the least-squares line relating the amount spent per week on groceries to the number of household members.b. Plot the amount spent on groceries as a function of
8. Six points have these coordinates:a. Find the least-squares line for the data.b. Plot the six points and graph the line. Does the line appear to provide a good fit to the data points?c. Use the least-squares line to predict the value of y when x53.5.d. Fill in the missing entries in the MS Excel
Construct the ANOVA table for a simple linear regression analysis, showing the sources, degrees of freedom, sums of squares, and mean squares 7. x 1 2 3 45 6 y 5.6 4.6 4.5 3.7 3.2 2.7
Construct the ANOVA table for a simple linear regression analysis, showing the sources, degrees of freedom, sums of squares, and mean squares. 6. X -2 -1 0 1 2 y 1 1 3 5 5
Fill in the missing entries in the analysis of variance table for a simple linear regression analysis shown 5. Source Regression Error Total df SS MS 14 3 3 2
Fill in the missing entries in the analysis of variance table for a simple linear regression analysis shown 4. Source df SS MS Regression 4.3 Error Total 19 12.5
construct an ANOVA table for a simple linear regression analysis, showing the sources, degrees of freedom, sums of squares, and mean squares 3. n=15 pairs (x,y), S = 2.1, S = 5.8, 5=1.1 XX yy
construct an ANOVA table for a simple linear regression analysis, showing the sources, degrees of freedom, sums of squares, and mean squares 2. n 11 pairs (x, y), SSR = 20, Total SS = 35
construct an ANOVA table for a simple linear regression analysis, showing the sources, degrees of freedom, sums of squares, and mean squares 1. n=8 pairs (x,y), S4, S=20, Sxy =8
22. Armspan and Height Leonardo da Vinci(1452–1519) drew a sketch of a man, indicating that a person’s armspan (measuring across the back with your arms outstretched to make a “T”) is roughly equal to the person’s height. To test this claim, we measured eight people with the following
21. How Long Is It? How good are you at estimating?To test a subject’s ability to estimate sizes, he was shown 10 different objects and asked to estimate their length or diameter. The object was then measured, and the results were recorded in the table below.a. Find the least-squares regression
Refer to the data sets in Exercises 18, reproduced below. Use the data entry method in your scientific calculator to enter the measurements.Recall the proper memories to find the y-intercept,a, and the slope,b, of the line. Verify that your calculations in Exercise 18 are correct. 20. X 1 2 3 4 5 6
Refer to the data sets in Exercises 17, reproduced below. Use the data entry method in your scientific calculator to enter the measurements.Recall the proper memories to find the y-intercept,a, and the slope,b, of the line. Verify that your calculations in Exercise 17 are correct. 19. X -2-10 y 1 1
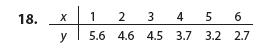
Calculate the sums of squares and cross-products, Sxx and Sxy. Find the least-squares line for the data. Plot the points and graph the line on the same graph. Does the line appear to provide a good fit to the data points? 18. x 1 2 3 4 5 6 y 5.6 4.6 4.5 3.7 3.2 3.2 2.7
Calculate the sums of squares and cross-products, Sxx and Sxy. Find the least-squares line for the data. Plot the points and graph the line on the same graph. Does the line appear to provide a good fit to the data points? 17. x y 2-1 -10 12 1 1 3 135 55
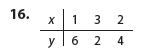
Calculate the sums of squares and cross-products, Sxx and Sx 16. x 1 3 2 y 6 24
Calculate the sums of squares and cross-products, Sxx and Sx 15. (3, 6) (5, 8) (2, 6) (1, 4) (4, 7) (4, 6)
Identify which of the two variables is the independent variable x and which is the dependent variable y. 14. Weight of a newborn puppy and litter size.
Showing 100 - 200
of 6613
1
2
3
4
5
6
7
8
9
10
11
12
13
14
15
Last
Step by Step Answers