New Semester
Started
Get
50% OFF
Study Help!
--h --m --s
Claim Now
Question Answers
Textbooks
Find textbooks, questions and answers
Oops, something went wrong!
Change your search query and then try again
S
Books
FREE
Study Help
Expert Questions
Accounting
General Management
Mathematics
Finance
Organizational Behaviour
Law
Physics
Operating System
Management Leadership
Sociology
Programming
Marketing
Database
Computer Network
Economics
Textbooks Solutions
Accounting
Managerial Accounting
Management Leadership
Cost Accounting
Statistics
Business Law
Corporate Finance
Finance
Economics
Auditing
Tutors
Online Tutors
Find a Tutor
Hire a Tutor
Become a Tutor
AI Tutor
AI Study Planner
NEW
Sell Books
Search
Search
Sign In
Register
study help
mathematics
advanced engineering mathematics
Advanced Engineering Mathematics 10th edition Erwin Kreyszig - Solutions
Graph a direction field (by a CAS or by hand) and sketch some solution curves. Solve the ODE exactly and compare.y' + y = 1.01 cos 10x
Model the motion of a body B on a straight line with velocity as given, y(t) being the distance of B from a point y = 0 at time t. Graph a direction field of the model (the ODE). In the field sketch the solution curve satisfying the given initial condition.Distance = Velocity × Timey(1) = 1
Find the general solution. If an initial condition is given, find also the corresponding particular solution and graph or sketch it. (Show the details of your work.)y' = 6(y - 2.5) tanh 1.5x
Let the isotherms (curves of constant temperature) in a body in the upper half-plane y > 0 be given by 4x2 + 9y2 = c. Find the orthogonal trajectories (the curves along which heat will flow in regions filled with heat-conducting material and free of heat sources or heat sinks).
(a) Verify that y is a solution of the ODE.(b) Determine from y the particular solution of the IVP(c) Graph the solution of the IVP.y' = y - y2y = 1/1 + ce-xy(0) = 0.25
Solve the IVP. Show the steps of derivation, beginning with the general solution.y' cosh2 x = sin2 yy(0) = 1/2π
Test for exactness. If exact, solve. If not, use an integrating factor as given or obtained by inspection or by the theorems in the text. Also, if an initial condition is given, find the corresponding particular solution.e-ydx + e-x(-e-y + 1) dy = 0F = ex+y
Graph a direction field (by a CAS or by hand) and sketch some solution curves. Solve the ODE exactly and compare.y' = y - 4y2
This means an ODE not showing x (the independent variable) explicitly. What will the level curves f (x, y) = const (also called isoclines = curves of equal inclination) of an autonomous ODE look like? Give reason.
Find the general solution. If an initial condition is given, find also the corresponding particular solution and graph or sketch it. (Show the details of your work.)y' = (y - 2) cot x
Let the electric equipotential lines (curves of constant potential) between two concentric cylinders with the z-axis in space be given by u(x, y) = x2 + y2 = c (these are circular cylinders in the xyz-space). Using the method in the text, find their orthogonal trajectories (the curves of electric
(a) Verify that y is a solution of the ODE.(b) Determine from y the particular solution of the IVP(c) Graph the solution of the IVP.y' = y + exy = (x + c)exy(0) = 1/2
Solve the IVP. Show the steps of derivation, beginning with the general solution.xy' + y = 0 y(4) = 6
Test for exactness. If exact, solve. If not, use an integrating factor as given or obtained by inspection or by the theorems in the text. Also, if an initial condition is given, find the corresponding particular solution.2 cosh x cos y dx = sinh x sin y dy
Graph a direction field (by a CAS or by hand) and sketch some solution curves. Solve the ODE exactly and compare.y' + 2y = 0
What is the largest possible ? in Example 1 in the text?Data from example 1Consider the initial value problemand take the rectangle R; |x| This solution is discontinuous at + ?/2, and there is no continuous solution valid in the entire interval |x| The conditions in the two theorems are sufficient
Direction fields are very useful because they can give you an impression of all solutions without solving the ODE, which may be difficult or even impossible. To get a feel for the accuracy of the method, graph a field, sketch solution curves in it, and compare them with the exact solutions.y' = cos
Find the general solution. If an initial condition is given, find also the corresponding particular solution and graph or sketch it. (Show the details of your work.)y' = y sin x = ecos xy(0) = -2.5
Sketch or graph some of the given curves. Guess what their OTs may look like. Find these OTs.y = ce-x2
(a) Verify that y is a solution of the ODE.(b) Determine from y the particular solution of the IVP(c) Graph the solution of the IVP.y' + 4y = 1.4y = ce-4x + 0.35y(0) = 2
Can two solution curves of the same ODE have a common point in a rectangle in which the assumptions of the present theorems are satisfied?
Find a general solution. Show the steps of derivation. Check your answer by substitution.xy' = y2 + y (Set y/x = u)
Test for exactness. If exact, solve. If not, use an integrating factor as given or obtained by inspection or by the theorems in the text. Also, if an initial condition is given, find the corresponding particular solution.e2x(2 cos y dx - sin y dy) = 0y(0) = 0
Give problems from mechanics, heat conduction, and population dynamics that can be modeled by first-order ODEs.
What does modeling mean? Can a CAS solve a model given by a first-order ODE? Can a CAS set up a model?
Can an ODE sometimes be solved by several methods? Give three examples.
Graph a direction field (by a CAS or by hand). In the field graph several solution curves by hand, particularly those passing through the given points (x, y).y' = ey/x(2, 2), (3, 3)
Find the general solution. If an initial condition is given, find also the corresponding particular solution and graph or sketch it. (Show the details of your work.)xy' = 2y + x3ex
Sketch or graph some of the given curves. Guess what their OTs may look like. Find these OTs.y = c/x2
Solve the ODE by integration or by remembering a differentiation formula.y' = cosh 5.13x
Find a general solution. Show the steps of derivation. Check your answer by substitution.xy' = y + 2x3 sin2 y/x (Set y/x = u)
Test for exactness. If exact, solve. If not, use an integrating factor as given or obtained by inspection or by the theorems in the text. Also, if an initial condition is given, find the corresponding particular solution.2x tan y dx + sec2 y dy = 0
Explain the idea of an integrating factor. Give two examples.
What is an exact ODE? Is f(x) dx + g(y) dy = 0 always exact?
Graph a direction field (by a CAS or by hand). In the field graph several solution curves by hand, particularly those passing through the given points (x, y).y' = x - 1/y(1, 1/2)
Find the general solution. If an initial condition is given, find also the corresponding particular solution and graph or sketch it. (Show the details of your work.)y' + ky = e-kx
Sketch or graph some of the given curves. Guess what their OTs may look like. Find these OTs.y = cx
Solve the ODE by integration or by remembering a differentiation formula.y' = 4e-x cos x
Find a general solution. Show the steps of derivation. Check your answer by substitution.yy' + 36x = 0
In most cases the solution of an initial value problem (1) exists in an x-interval larger than that guaranteed by the present theorems. Show this fact for y' = 2y2, y(1) = 1 by finding the best possible a (choosing b optimally) and comparing the result with the actual solution.
Test for exactness. If exact, solve. If not, use an integrating factor as given or obtained by inspection or by the theorems in the text. Also, if an initial condition is given, find the corresponding particular solution.(x2 + y2) dx - 2xy dy = 0
What is a direction field? A numeric method for first order ODEs?
Does every first-order ODE have a solution? A solution formula? Give examples.
Graph a direction field (by a CAS or by hand). In the field graph several solution curves by hand, particularly those passing through the given points (x, y).y' = 1 - y2(0, 0), (2, 1/2)
Find the general solution. If an initial condition is given, find also the corresponding particular solution and graph or sketch it. (Show the details of your work.)y' - y = 5.2
Represent the given family of curves in the form G(x, y; c) = 0 and sketch some of the curves.The catenaries obtained by translating the catenary y = cosh x in the direction of the straight line y = x.
If the assumptions of Theorems 1 and 2 are satisfied not merely in a rectangle but in a vertical infinite strip |x - x0| < a in what interval will the solution of (1) exist?
Test for exactness. If exact, solve. If not, use an integrating factor as given or obtained by inspection or by the theorems in the text. Also, if an initial condition is given, find the corresponding particular solution.sin x cos y dx + cos x sin y dy = 0
What is a linear ODE? Why is it easier to solve than a nonlinear ODE?
Give a reason why in (4) you may choose the constant of integration in ∫p dx to be zero.
Graph a direction field (by a CAS or by hand). In the field graph several solution curves by hand, particularly those passing through the given points (x, y).y' = 1 + y2(1,1), |(0,1/2)
Show that e-ln x = 1/x (not -x) and e-ln(sec x) = cos x.
Represent the given family of curves in the form G(x, y; c) = 0 and sketch some of the curves.All ellipses with foci -3 and 3 on the x-axis.
Why is it important to introduce the constant of integration immediately when you integrate?
Solve the ODE by integration or by remembering a differentiation formula.y' + 2 sin 2πx = 0
If p and r in are y' + p(x)y = r(x) are continuous for all x in an interval |x - x0| < show that in this ODE satisfies the conditions of our present theorems, so that a corresponding initial value problem has a unique solution. Do you actually need these theorems for this ODE?
Test for exactness. If exact, solve. If not, use an integrating factor as given or obtained by inspection or by the theorems in the text. Also, if an initial condition is given, find the corresponding particular solution.2xy dx + x2 dy = 0
Let the temperature T in a body be independent of z so that it is given by a scalar function T = T(x, t). Identify the isotherms T(x, y) = const. Sketch some of them.Sketch or graph isotherms of the following fields and describe what they look like.(a) x2 - 4x - y2
Find and graph the sample regression line of y on x and the given data as points on the same axes. Show the details of your work.(-2, 3.5), (1, 2.6), (3, 1.3), (5, 0.4)
Find an augmenting path: (1) (2 (3 (6.
Does a process of producing plastic rods of length µ̃= 2 meters need adjustment if in a sample, 2 rods have the exact length and 15 are shorter and 3 longer than 2 meters? (Use the sign test.)
The OC curve in acceptance sampling cannot have a strictly vertical portion. Why?
Three specimens of high-quality concrete had compressive strength 357, 359, 413 [kg/cm2], and for three specimens of ordinary concrete the values were 346, 358, 302. Test for equality of the population means, μ1 = μ2, against the alternative μ1 > μ2. Assume normality and equality
Assuming normality, find a 95% confidence interval for the variance from the sample 145.3, 145.1, 145.4, 146.2.
Determine a 95% confidence interval for the mean μ of a normal population with variance σ2 = 25, using a sample of size 500 with mean 22.
Find the mean, variance, and standard derivation of the sample 21.0 21.6 19.9 19.6 15.6 20.6 22.1 22.2.
Find a 95% confidence interval for the regression coefficient κ1, assuming (A2) and (A3) hold and using the sample.In Prob. 2Data from Prob. 4Find and graph the sample regression line of y on x and the given data as points on the same axes. Show the details of your work.x = Deformation
Find a 95% confidence interval for the regression coefficient κ1, assuming (A2) and (A3) hold and using the sample.In Prob. 2Data from Prob. 2Find and graph the sample regression line of y on x and the given data as points on the same axes.(-2, 3.5), (1, 2.6), (3, 1.3), (5, 0.4)
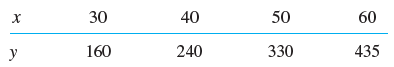
Find and graph the sample regression line of y on x and the given data as points on the same axes. Show the details of your work.x = Speed [mph]. y = Stopping distance [ft]. Also ind y at 35 mph. 30 40 50 60 435 330 y 160 240
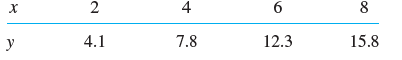
Find and graph the sample regression line of y on x and the given data as points on the same axes. Show the details of your work.x = Force [lb], y = Extension [in] of a spring. Also find the spring modulus. 4 х 12.3 7.8 4.1 15.8 00
Extend Prob. 5 as follows. Suppose that m times n trials were made and in the first n trials A happened k1 times, in the second n trials A happened k2 times, · · ·, in the mth n trials A happened km times. Find a maximum likelihood estimate of p based on this information.Data from Prob.
Graph the AOQ curve in Prob. 5. Determine the AOQL, assuming that rectification is applied.Data from Prob. 5Lots of copper pipes are inspected according to a sample plan that uses sample size 25 and acceptance number 1. Graph the OC curve of the plan, using the Poisson approximation. Find the
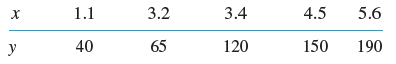
Find and graph the sample regression line of y on x and the given data as points on the same axes. Show the details of your work.x = Sliding distance [km], y = Wear volume [mm3] 1.1 3.2 3.4 4.5 5.6 150 40 65 120 190
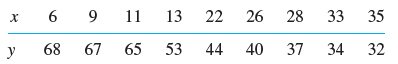
Find and graph the sample regression line of y on x and the given data as points on the same axes. Show the details of your work.x = Deformation of a certain steel [mm], y = Brinell hardness [kg/mm2] 9 11 13 28 33 22 6 26 35 х 65 53 68 40 37 34 32 67 44
Test for equality of population means against the alternative that the means are different assuming normality, choosing α = 5% and using two samples of sizes 12 and 18, with mean 10 and 14, respectively, and equal standard deviation 3.
If X1 and X2 are independent normal random variables with mean 14 and 8 and variance 2 and 5, respectively, what distribution does 3 X1 - X2 have?
Find a 95% confidence interval for the variance of a normal population from the sample:Ultimate tensile strength (k psi) of alloy steel (Maraging H) at room temperature: 251, 255, 258, 253, 253, 252, 250, 252, 255, 256
Find a 95% confidence interval for the variance of a normal population from the sample:Carbon monoxide emission (grams per mile) of a certain type of passenger car (cruising at 55 mph): 17.3, 17.8, 18.0, 17.7, 18.2, 17.4, 17.6, 18.1
Do the same task as in Prob. 13 if the given sample is 0.4, 0.7, 0.2, 1.1, 0.1.Data from Prob. 13From the sample 1.9, 0.4, 0.7, 0.6, 1.4. Graph the sample distribution function F̂(x) and the distribution function F(x) of the random variable, with θ = θ̂, on the same axes. Do they agree
Does the random variable X = Number of accidents per week have a Poisson distribution if, within 50 weeks, 33 were accident-free, 1 accident occurred in 11 of the 50 weeks, 2 in 6 of the weeks, and more than 2 accidents in no week? Choose α = 5%
A lot of batteries for wrist watches is accepted if and only if a sample of 20 contains at most 1 defective. Graph the OC and AOQ curves. Find AOQL.
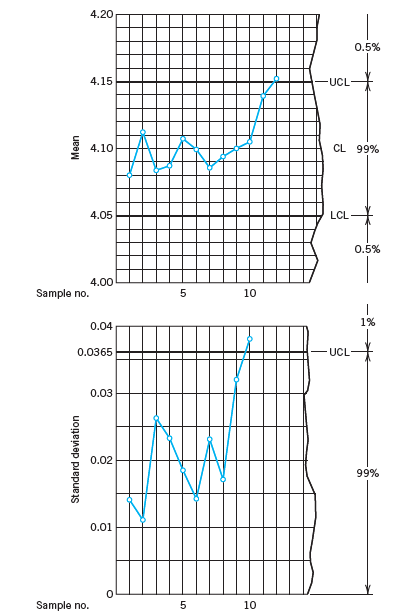
What LCL and UCL should we use instead of (1) if, instead of xÌ…, we use the sum x1+ · · · + xnof the sample values? Determine these limits in the case of Fig. 537. 4.20 0.5% 4.15 -UCL 4.10 CL 99% 4.05 LCL- 0.5% 4.00 Sample no. 10 1% 0.04 0.0365 UCL 0.03 0.02 99%
If a standard medication cures about 75% of patients with a certain disease and a new medication cured 310 of the first 400 patients on whom it was tried, can we conclude that the new medication is better? Choose α = 5%. First guess. Then calculate.
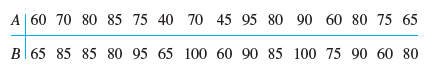
Test the hypothesis that, for a certain type of voltmeter, readings are independent of temperature T [°C] against the alternative that they tend to increase with T. Use a sample of values obtained by applying a constant voltage: Temperature T [°C]] 10 Reading V [volts] 99.5 101.1 100.4 100.8
In Prob. 11, find the mean μ, substitute it in f(x), find the maximum likelihood estimate of μ, and show that it is identical with the estimate for μ which can be obtained from that for θ in Prob. 11.Data from Prob. 11f(x) = θe-θx if x ≥ 0 and f(x) = 0 if x < 0.
If in a sampling plan for large lots of spark plugs, the sample size is 100 and we want the AQL to be 5% and the producer’s risk 2% what acceptance number c should we choose? (Use the normal approximation of the binomial distribution.)
If a sample of 25 tires of a certain kind has a mean life of 37,000 miles and a standard deviation of 5000 miles, can the manufacturer claim that the true mean life of such tires is greater than 35,000 miles? Set up and test a corresponding hypothesis at the 5% level, assuming normality.
Find a 99% confidence interval for the mean of a normal population from the sample:Melting point (°C) of aluminum 660, 667, 654, 663, 662
Test whether a thermostatic switch is properly set to 50°C against the alternative that its setting is too low. Use a sample of 9 values, 8 of which are less than 50°C and 1 is greater.
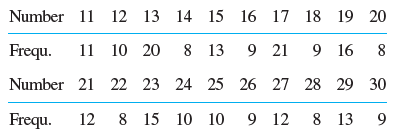
77 students were asked to choose 3 of the integers 11, 12 ,13, · · ·, 30 completely arbitrarily. The amazing result was as follows.If the selection were completely random, the following hypotheses should be true.(a) The 20 numbers are equally likely.(a) The 20 numbers are
In rolling a die, suppose that we get the first “Six” in the 7th trial and in doing it again we get it in the 6th trial. Estimate the probability p of getting a “Six” in rolling that die once.
Fifteen samples of size 100 were taken from a production of containers. The numbers of defectives (leaking containers) in those samples (in the order observed) were1 4 5 4 9 7 0 5 6 13 0 2 1 12 8From previous experience it was known that the average fraction defective is p = 4% provided that the
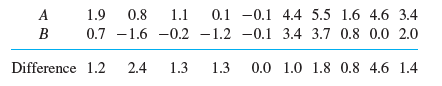
In a clinical experiment, each of 10 patients were given two different sedatives A and B. The following table shows the effect (increase of sleeping time, measured in hours). Using the sign test, find out whether the difference is significant. 1.1 1.9 0.1 -0.1 4.4 5.5 1.6 4.6 3.4 0.8 A 0.7 -1.6
A manufacturer claims that in a process of producing drill bits, only 2.5% of the bits are dull. Test the claim against the alternative that more than 2.5% of the bits are dull, using a sample of 400 bits containing 17 dull ones. Use α = 5%.
What happens in Example 1 in the text if we increase the sample size to n = 3, leaving the other data as before? Compute P(A; 0.1) and P(A; 0.2) and compare with Example 1.
Graph λn = σ/E(R*) as a function of n. Why is λn a monotone decreasing function of n?
Determine the power of the test in Prob. 6.Data from Prob 6Assuming normality and known variance σ2 = 9, test the hypothesis μ = 60.0 against the alternative μ = 57.0 using a sample of size 20 with mean x̅ = 58.50 and choosing α = 5%.
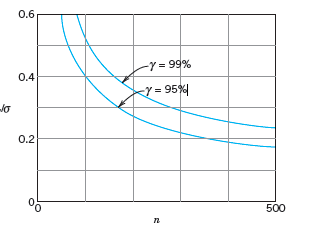
What sample size is needed to obtain a 99% confidence interval of length 2.0 for the mean of a normal population with variance 25? Use Fig. 526. Check by calculation. 0.6 -y = 99% 0.4 Y = 95% 0.2 500
Thirty new employees were grouped into 15 pairs of similar intelligence and experience and were then instructed in data processing by an old method (A) applied to one (randomly selected) person of each pair, and by a new presumably better method (B) applied to the other person of each pair. Test
Solve Prob. 5 if rolling a die 180 times gives 33, 27, 29, 35, 25, 31.Data from Prob. 5Can you claim, on a 5% level, that a die is fair if 60 trials give 1,· · ·, 6 with absolute frequencies 10, 13, 9, 11, 9, 8?
Showing 2300 - 2400
of 3937
First
17
18
19
20
21
22
23
24
25
26
27
28
29
30
31
Last
Step by Step Answers
![Temperature T [°C]] 10 Reading V [volts] 99.5 101.1 100.4 100.8 101.6 20 40 50](https://dsd5zvtm8ll6.cloudfront.net/si.question.images/images/question_images/1545/8/2/0/9955c235b432e4481545521126579.jpg)