New Semester
Started
Get
50% OFF
Study Help!
--h --m --s
Claim Now
Question Answers
Textbooks
Find textbooks, questions and answers
Oops, something went wrong!
Change your search query and then try again
S
Books
FREE
Study Help
Expert Questions
Accounting
General Management
Mathematics
Finance
Organizational Behaviour
Law
Physics
Operating System
Management Leadership
Sociology
Programming
Marketing
Database
Computer Network
Economics
Textbooks Solutions
Accounting
Managerial Accounting
Management Leadership
Cost Accounting
Statistics
Business Law
Corporate Finance
Finance
Economics
Auditing
Tutors
Online Tutors
Find a Tutor
Hire a Tutor
Become a Tutor
AI Tutor
AI Study Planner
NEW
Sell Books
Search
Search
Sign In
Register
study help
mathematics
advanced engineering mathematics
Advanced Engineering Mathematics 10th edition Erwin Kreyszig - Solutions
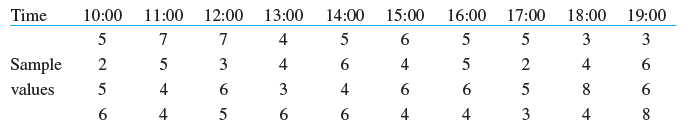
Graph the means of the following 10 samples (thickness of gaskets, coded values) on a control chart for means, assuming that the population is normal with mean 5 and standard deviation 1.16. Time 10:00 11:00 12:00 14:00 13:00 5 15:00 16:00 17:00 18:00 19:00 3 5 3 5 4 4 3 5 5 4 3 6. 5 Sample 2 4 5 4
Assuming normality and known variance σ2 = 9, test the hypothesis μ = 60.0 against the alternative μ = 57.0 using a sample of size 20 with mean x̅ = 58.50 and choosing α = 5%.
Determine a 95% confidence interval for the mean μ of a normal population with variance σ2 = 16, using a sample of size 200 with mean 74.81.
Does a process of producing stainless steel pipes of length 20 ft for nuclear reactors need adjustment if, in a sample, 4 pipes have the exact length and 15 are shorter and 3 longer than 20 ft? Use the normal approximation of the binomial distribution.
If in 10 flips of a coin we get the same ratio as in Prob. 3 (4 heads and 6 tails), is the conclusion the same as in Prob. 3? First conjecture, then compute.Data from Prob. 3If 100 flips of a coin result in 40 heads and 60 tails, can we assert on the 5% level that the coin is fair?
Show that, in the case of the parameters α and b of the uniform distribution, the maximum likelihood estimate cannot be obtained by equating the first derivative to zero. How can we obtain maximum likelihood estimates in this case, more or less by using common sense?
What are the producer€™s and consumer€™s risks in Prob. 1 if the AQL is 2% and the RQL is 5%Data from Prob. 1Lots of kitchen knives are inspected by a sampling plan that uses a sample of size 20 and the acceptance number c = 1. What is the probability of accepting a lot with 1%,
What effect on UCL - LCL does it have if we double the sample size? If we switch from α = 1% to α = 5%
Find a 95% confidence interval for the mean of a normal population with standard deviation 4.00 from the sample 39, 51, 49, 43, 57, 59. Does that interval get longer or shorter if we take γ = 0.99 instead of 0.95? By what factor?
Test µ̃= 0 against µ̃> 0, using 1, -1, 1, 3, -8, 6, 0 (deviations of the azimuth [multiples of 0.01 radian] in some revolution of a satellite).
If it is known that 25% of certain steel rods produced by a standard process will break when subjected to a load of 5000 lb, can we claim that a new, less expensive process yields the same breakage rate if we find that in a sample of 80 rods produced by the new process, 27 rods broke when subjected
Find the maximum likelihood estimate for the parameter μ of a normal distribution with known variance σ2 = σ20 = 16
What happens in Prob. 1 if the sample size is increased to 50? First guess. Then calculate. Graph the OC curve and compare.Data from Prob. 1Lots of kitchen knives are inspected by a sampling plan that uses a sample of size 20 and the acceptance number c = 1. What is the probability of accepting a
Find the probability function of X = Number of times a fair die is rolled until the first Six appears and show that it satisfies (6).
If the life of ball bearings has the density f(x) = ke-x if 0 ≤ x ≤ 2 and 0 otherwise, what is k? What is the probability P(X ≥ 1)?
Prove that x̅ must always lie between the smallest and the largest data values.
Of a lot of 12 items, 3 are defective.(a) Find the number of different samples of 3 items. Find the number of samples of 3 items containing(b) No defectives(c) 1 defective(d) 2 defectives(e) 3 defectives.
Show that(a) Show that E(X - μ) = 0, σ2 = E(X2) - μ2.(b) Prove (10)-(12).(c) Find all the moments of the uniform distribution on an interval α ≤ x ≤ b.(d) The skewness ϒ of a random variable X is defined byShow that for a symmetric distribution (whose third central moment exists) the
Prove the statement involving (18).
Using a Venn diagram, show that A ⊆ B if and only if A ∩ B = A
Do the same tasks as in Prob. 17 for the hardness data in Prob. 8.Data from Prob. 174 1 3 10 2.
Using a Venn diagram, show that A ⊆ B if and only if A ∩ B = A.
Let (X, Y) have the densityf(x, y) = k if x2 + y2 < 1and 0 otherwise. Determine k. Find the densities of the marginal distributions. Find the probabilityP(X2 + Y2 < 1/4).
Extending Theorem 4, show that P(A ∩ B ∩ C) = P(A)P(B|A)P(C|A ∩ B).
Find the mean and compare it with the median. Find the standard deviation and compare it with the interquartile range.For the Brinell hardness data in Prob. 8Data from Prob. 886 86 87 89 76 85 82 86
The moment generating function G(t) is defined byorwhere X is a discrete or continuous random variable, respectively.(a) Assuming that term wise differentiation and differentiation under the integral sign are permissible, show that E(Xk) = G(k)(0), where G(k) = dkG/dtk, in particular,
What are the outcomes in the sample space of the experiment of simultaneously tossing three coins?
What capacity must the tank in Prob. 15 have in order that the probability that the tank will be emptied in a given week be 5%?Data from Prob. 15A small filling station is supplied with gasoline every Saturday afternoon. Assume that its volume X of sales in ten thousands of gallons has the
Prove (2).
(a) Find the points of inflection of the curve of (1).(b) Considering Φ2(ˆž) and introducing polar coordinates in the double integral (a standard trick worth remembering), prove(c) Show that σ in (1) is indeed the standard deviation of the normal
In drawing 2 screws from a lot of right-handed and left-handed screws, let A, B, C, D mean at a least 1 right-handed, at least 1 left-handed, 2 right-handed, 2 left-handed, respectively. Are A and B mutually exclusive? C and D?
Find the mean and compare it with the median. Find the standard deviation and compare it with the interquartile range.For the iron contents in Prob. 4Data from Prob. 472.8 70.4 71.2 69.2 70.3 68.9 71.1
If a ticket office can serve at most 4 customers per minute and the average number of customers is 120 per hour, what is the probability that during a given minute customers will have to wait?
Find the mean, standard deviation, and variance in Prob. 12.Data from Porb 1213.5, 13.2, 12.1, 13.6, 13.3.
An electronic device consists of two components. Let X and Y [years] be the times to failure of the first and second components, respectively. Assume that (X, Y) has the density f(x, y) = 4e-2(x+y) if x > 0 and y > 0 and 0 otherwise.(a) Are X and Y dependent or independent? (b) Find the
(a) Prove Theorem 2.(b) Prove the last statement of Theorem 3.(c) Derive (11) from (8).(d) By the binomial theorem,
Suppose that in a production of spark plugs the fraction of defective plugs has been constant at over a long time and that this process is controlled every half hour by drawing and inspecting two just produced. Find the probabilities of getting(a) No defectives(b) 1 defective(c) 2 defectives. What
Graph a sample space for the experiments:List all 8 subsets of the sample space S = {α, b, c}.
Find the mean and compare it with the median. Find the standard deviation and compare it with the interquartile range.For the phone call data in Prob. 2Data from Prob. 26 6 4 2 1 7 0 4 6
Find P(X > 4, Y > 4) and P(X ≤ 1, Y ≤ 1) if (X, Y) has the density f(x, y) = 1/32 if x ≥ 0, y ≥ 0, x + y ≤ 8.
Suppose that a certain type of magnetic tape contains, on the average, 2 defects per 100 meters. What is the probability that a roll of tape 300 meters long will contain(a) x defects(b) No defects?
Same task as in Prob. 11. for the data 13.5, 13.2, 12.1, 13.6, 13.3.Data from Prob. 11Make a stem-and-leaf plot, histogram, and boxplot of the data 110, 113, 109, 118, 110, 115, 104, 111, 116, 113.
What total sum can you expect in rolling a fair die 20 times? Do the experiment. Repeat it a number of times and record how the sum varies.
If the mean weight of certain (empty) containers is 5 lb the standard deviation is 0.2 lb, and if the filling of the containers has mean weight 100 lb and standard deviation 0.5 lb, what are the mean weight and the standard deviation of filled containers?
If 3 suspects who committed a burglary and 6 innocent persons are lined up, what is the probability that a witness who is not sure and has to pick three persons will pick the three suspects by chance? That the witness picks 3 innocent persons by chance?
If a circuit contains four automatic switches and we want that, with a probability of 99%, during a given time interval the switches to be all working, what probability of failure per time interval can we admit for a single switch?
A producer sells electric bulbs in cartons of 1000 bulbs. Using (11), find the probability that any given carton contains not more than 1% defective bulbs, assuming the production process to be a Bernoulli experiment with ρ = 1%(= probability that any given bulb will be defective). First guess.
If the diameter X of axles has the density f(x) = k if 119.9 ≤ x ≤ 120.1 and 0 otherwise, how many defectives will a lot of 500 axles approximately contain if defectives are axles slimmer than 119.91 or thicker than 120.09?
Let p = 2% be the probability that a certain type of light bulb will fail in a 24-hour test. Find the probability that a sign consisting of 15 such bulbs will burn 24 hours with no bulb failures.
Represent the data by a stem-and-leaf plot, a histogram, and a boxplot:-0.51 0.12 -0.47 0.95 0.25 -0.18 -0.54
If, in Prob. 9, a defective bolt is one that deviates from 1.00 cm by more than 0.06 cm, what percentage of defectives should we expect?Data from Prob. 9If the diameter X [cm] of certain bolts has the density f(x) = k(x - 0.9)(1.1 - x) for 0.9 < x < 1.1 and 0 for other x.
Using Theorem 1, obtain the formula for the mean of the hypergeometric distribution. Can you use Theorem 3 to obtain the variance of that distribution?
If a cage contains 100 mice, 3 of which are male, what is the probability that the 3 male mice will be included if 10 mice are randomly selected?
The breaking strength X [kg] of a certain type of plastic block is normally distributed with a mean of 1500 kg and a standard deviation of 50 kg. What is the maximum load such that we can expect no more than 5% of the blocks to break?
Graph a sample space for the experiments:In rolling 3 dice, are the events A: Sum divisible by 3 and B: Sum divisible by 5 mutually exclusive?
Graph a sample space for the experiments:Choosing a committee of 2 from a group of 5 people
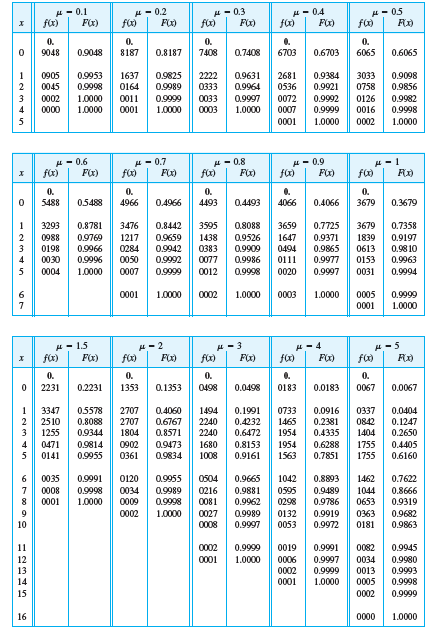
Suppose that a telephone switchboard of some company on the average handles 300 calls per hour, and that the board can make at most 10 connections per minute. Using the Poisson distribution, estimate the probability that the board will be overtaxed during a given minute. (Use Table A6) A- 0.2
Represent the data by a stem-and-leaf plot, a histogram, and a boxplot:Foundrax test of Brinell hardness (2.5 mm steel ball, 62.5 kg load, 30 sec) of 20 copper plates (values in kg/mm2)86 86 87 89 76 85 82
Explain the use of the tables of the normal distribution. If you have a CAS, how would you proceed without the tables?
Find the mean and variance of the random variable X with probability function or density f(x).X = Number of times a fair coin is flipped until the first Head appears. (Calculate μ only.)
Let X [cm] and Y [cm] be the diameters of a pin and hole, respectively. Suppose that (X, Y) has the densityf(x, y) = 625 if 0.98 < x < 1.02, 1.00 < y < 1.04and 0 otherwise.(a) Find the marginal distributions.(b) What is the probability that a pin chosen at random will fit a hole whose
If the standard deviation in Prob. 5 were smaller, would that percentage be larger or smaller?Data from Prob. 5If the lifetime X of a certain kind of automobile battery is normally distributed with a mean of 5 years and a standard deviation of 1 year, and the manufacturer wishes to guarantee the
Graph a sample space for the experiments:Recording the lifetime of each of 3 light bulbs
Suppose that 4% of steel rods made by a machine are defective, the defectives occurring at random during production. If the rods are packaged 100 per box, what is the Poisson approximation of the probability that a given box will contain x = 0, 1, · · ·, 5 defectives?
Represent the data by a stem-and-leaf plot, a histogram, and a boxplot:Gasoline consumption [miles per gallon, rounded] of six cars of the same model under similar conditions15.0 15.5 14.5 15.0 15.5 15.0
Find the mean and variance of the random variable X with probability function or density f(x).f(x) = k(1 - x2) if -1 ≤ x ≤ 1 and 0 otherwise
How many different samples of 4 objects can we draw from a lot of 50?
If a certain kind of tire has a life exceeding 40,000 miles with probability 0.90, what is the probability that a set of these tires on a car will last longer than 40,000 miles?
Will the probability in Prob. 5 increase or decrease if we draw without replacement. First guess, then calculate.Data from Prob. 5If a box contains 10 left-handed and 20 right-handed screws, what is the probability of obtaining at least one right-handed screw in drawing 2 screws with replacement?
Let X be normal with mean 3.6 and variance 0.01. Find c such that P(X ≤ c) = 50%, P(X > c) = 10%, P(-c < X - 3.6 ≤ c) = 99.9%
Graph a sample space for the experiments:Rolling a die until the first Six appears
How do the probabilities in Example 4 change if you double the numbers: drawing 4 gaskets from 20, 6 of which are defective? First guess.
In Prob. 3 find c and c̃ such that P(-c < X < c) = 95% and P(0 < X < c̃) = 95%.Data from Prob. 3Graph f and F when the density of X is f(x) = k = const if -2 ≤ x ≤ 2 and 0 elsewhere. Find P(0 ≤ X ≤ 2).
Represent the data by a stem-and-leaf plot, a histogram, and a boxplot:Iron content [%] of 15 specimens of hermatite (Fe2O3)72.8 70.4 71.2 69.2 70.3 68.9 71.1 69.871.5 69.7
Find the mean and variance of the random variable X with probability function or density f(x).Y = √3(X - μ)/π with X as in Prob. 3Data from Prob. 3Find the mean and variance of the random variable X with probability function or density f(x).Uniform distribution on [0, 2π]
Find the density of the marginal distribution of X in Prob. 2.Data from Prob. 2Find P(X > 4, Y > 4) and P(X ≤ 1, Y ≤ 1) if (X, Y) has the density f(x, y) = 1/32 if x ≥ 0, y ≥ 0, x + y ≤ 8.
An urn contains 2 green, 3 yellow, and 5 red balls. We draw 1 ball at random and put it aside. Then we draw the next ball, and so on. Find the probability of drawing at first the 2 green balls, then the 3 yellow ones, and finally the red ones.
In Prob. 3 find the probability of E: At least 1 defective(i) Directly(ii) By using complements; in both cases (a) and (b).Data from Prob. 3Three screws are drawn at random from a lot of 100 screws, 10 of which are defective. Find the probability of the event that all 3 screws drawn are
Let X be normal with mean 105 and variance 25. Find P(X ≤ 112.5), P(x > 100), P(110.5 < X < 111.25).
Graph a sample space for the experiments:Tossing 2 coins
Represent the data by a stem-and-leaf plot, a histogram, and a boxplot:Phone calls per minute in an office between 9:00 A.M. and 9:10 A.M.6 6 4 2 1 7 0 4 6 7
Find the mean and variance of the random variable X with probability function or density f(x).X = Number a fair die turns up
The edge chromatic number Χe(G) of a graph G is the minimum number of colors needed for coloring the edges of G so that incident edges get different colors. Clearly, Χe(G) ≥ max d(u), where d(u) is the degree of vertex u. If G = (S, T; E) is bipartite, the equality sign holds. Prove this for
Find an augmenting path, (1) (2) (3) 5 4.
The famous four-color theorem states that one can color the vertices of any planar graph (so that adjacent vertices get different colors) with at most four colors. It had been conjectured for a long time and was eventually proved in 1976 by Appel and Haken. Can you color the complete graph K5 with
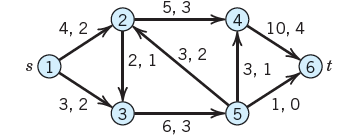
Find flow augmenting paths and the maximum flow. 5, 3 2 4, 2 10, 4 |2, 1\3, 2 s(1) 6) t 3, 1 3, 2 3. 1,0 5 6, 3
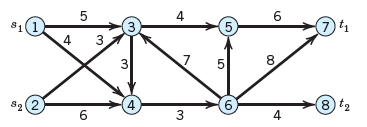
Find the maximum flow in the network in Fig. 502 with two sources (factories) and two sinks (consumers). 4 5. 81(1) 3 8) t2 82(2 3 4 LO 4. 3. 4.
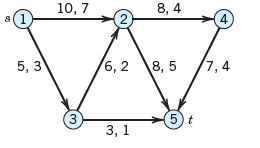
Find another maximum flow f = 15 in Prob. 19.Data from Prob. 19 10, 7 8, 4 s(1 2) 5, 3 6, 2 7, 4 \8, 5 3, 1
A graph with n vertices is a tree if and only if it has n - 1 edges and has no cycles.Data from Prob. 16If a graph has no cycles, it must have at least 2 vertices of degree 1Data from Prob. 18A tree with n vertices has n - 1 edges. (Proof by induction.)
If we switch from one computer to another that is 100 times as fast, what is our gain in problem size per hour in the use of an algorithm that is O(m), O(m2), O(m5), O(em)?
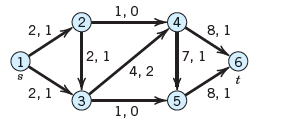
Find the maximum flow by inspection:In Prob. 12Data from Prob. 12 1,0 4 8, 1 2, 1 7, 1 2, 1 4, 2 (1) 2, 1 (3 8, 1 5. 1,0
Show that a graph G with n vertices can have at most n(n - 1)/2 edges, and G has exactly n(n - 1)/2 edges if G is complete, that is, if every pair of vertices of G is joined by an edge. (Recall that loops and multiple edges are excluded.)
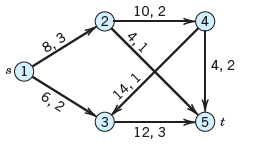
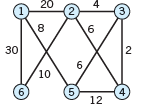
Find the maximum flow by inspection:In Prob. 13Data from Prob. 13 10, 2 4, 1 8, 3 4, 2 14, 1 3) 12, 3 6, 2 5) t
A bipartite graph G = (S, T; E) is called complete if every vertex in S is joined to every vertex in T by an edge, and is denoted by Kn1,n2, where n1 and n2 are the numbers of vertices in S and T, respectively. How many edges does this graph have?
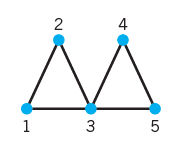
Find four different closed Euler trails in Fig. 485. 3 5 2.
(a) Distance, Eccentricity. Call the length of a shortest path u †’ v in a graph G = (V, E) the distance d(u, v) from u to v. For fixed u, call the greatest d(u, v) as v ranges over V the eccentricity ϵ(u) of u. Find the eccentricity of vertices 1, 2, 3 in the graph in Prob.
If the Ford–Fulkerson algorithm stops without reaching t, show that the edges with one end labeled and the other end unlabeled form a cut set (S, T) whose capacity equals the maximum flow.
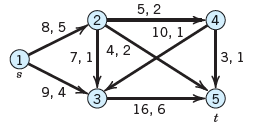
Find flow augmenting paths: 5, 2 (2 8, 5 10, 1 4, 2 7, 1 3, 1 9, 4 5 3 16, 6
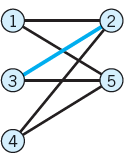
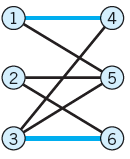
Using augmenting paths, find a maximum cardinality matching:In Prob. 10Data from Prob. 10 (1) (2 (3 (6.
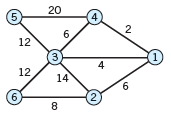
Find a shortest spanning tree by Prim€™s algorithm.For the graph in Prob. 2Data from Prob. 2 20 (2 3. 30 10 6. (5 12 2.
Showing 2400 - 2500
of 3937
First
18
19
20
21
22
23
24
25
26
27
28
29
30
31
32
Last
Step by Step Answers
![Probability function f(x) [see (5), Sec. 24.7] and distribution function F(x) A- 0.2 Fx) A- 0.3 A- 0.1 H- 04 fx) F(x) fu](https://dsd5zvtm8ll6.cloudfront.net/si.question.images/images/question_images/1545/8/1/6/7565c234ab47c64d1545516887887.jpg)