New Semester
Started
Get
50% OFF
Study Help!
--h --m --s
Claim Now
Question Answers
Textbooks
Find textbooks, questions and answers
Oops, something went wrong!
Change your search query and then try again
S
Books
FREE
Study Help
Expert Questions
Accounting
General Management
Mathematics
Finance
Organizational Behaviour
Law
Physics
Operating System
Management Leadership
Sociology
Programming
Marketing
Database
Computer Network
Economics
Textbooks Solutions
Accounting
Managerial Accounting
Management Leadership
Cost Accounting
Statistics
Business Law
Corporate Finance
Finance
Economics
Auditing
Tutors
Online Tutors
Find a Tutor
Hire a Tutor
Become a Tutor
AI Tutor
AI Study Planner
NEW
Sell Books
Search
Search
Sign In
Register
study help
mathematics
advanced engineering mathematics
Advanced Engineering Mathematics 10th edition Erwin Kreyszig - Solutions
Universal Electric, Inc., manufactures and sells two models of lamps, L1 and L2 , the profit being $150 and $100, respectively. The process involves two workers W1 and W2 who are available for this kind of work 100 and 80 hours per month, respectively. W1 assembles L1 in 20 min and L2 in
Maximize or minimize as indicated.Minimize f = 2x1 - 10x2 subject to x1 - x2 ≤ 4, 2x1 + x2 ≤ 14, x1 + x2 ≤ 9, -x1 + 3x2 ≤ 15.
Giant Ladders, Inc., wants to maximize its daily total output of large step ladders by producing x1 of them by a process P1 and x2 by a process P2, where P1 requires 2 hours of labor and 4 machine hours per ladder, and P2 requires 3 hours of labor and 2 machine hours. For this kind
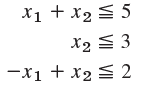
Maximize or minimize as indicated.Maximize f = 10x1 + 20x2 subject to x1 ≤ 5, x1 + x2 ≤ 6, x2 ≤ 4.
United Metal, Inc., produces alloys B1 (special brass) and B2 (yellow tombac). B1 contains 50% copper and 50% zinc. (Ordinary brass contains about 65% copper and 35% zinc.) B2 contains 75% copper and 25% zinc. Net profits are $120 per ton of B1 and $100 per ton of B2. The daily
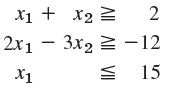
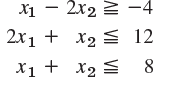
Graph or sketch the region in the first quadrant of the x1x2-plane determined by the following inequalities.
Graph or sketch the region in the first quadrant of the x1x2-plane determined by the following inequalities.
Maximize or minimize the given objective function f subject to the given constraints.Maximize f = 20x1 + 30x2 subject to 4x1 + 3x2 ≥ 12, x1 - x2 ≥ -3, x2 ≤ 6, 2x1 - 3x2 ≤ 0.
(a) Write a program for graphing a region R in the first quadrant of the x1x2-plane determined by linear constraints.(b) Write a program for maximizing z = α1x1 + α2x2 in R.(c) Write a program for maximizing z = α1x1 + · · · + αnxn subject to linear constraints.(d) Apply your
Graph or sketch the region in the first quadrant of the x1x2-plane determined by the following inequalities.
Graph or sketch the region in the first quadrant of the x1x2-plane determined by the following inequalities.
Maximize or minimize the given objective function f subject to the given constraints.Maximize f = 5x1 + 25x2 in the region in Prob. 5.Data from Prob. 5Describe and graph the regions in the first quadrant of the x1x2-plane determined by the given inequalities. -x1 + x2 ≥
Write in normal form and solve by the simplex method, assuming all xj to be nonnegative.Maximize f = 34x1 + 29x2 + 23x3 subject to 8x1 + 2x2 + x3 ≤ 54, 3x1 + 8x2 + 2x3 ≤ 59, x1 + x2 + 5x3 ≤ 39.
In Prob. 10, could you start from [0 0]T and do 5 steps?Data form Prob. 10Apply the method of steepest descent to f(x) = 9x21 + x22 + 18x1 - 4x2, 5 steps. Start from x0 = [2 4]T.
Write in normal form and solve by the simplex method, assuming all xj to be nonnegative.Prob. 22 in Problem Set 22.2.Data from Prob. 22 in Sec 22.2Foods A and B have 600 and 500 calories, contain 15 g and 30 g of protein, and cost $1.80 and $2.10 per unit, respectively. Find the minimum cost diet
(a) Write a program for the method.(b) Apply your program to f(x) = x21 + 4x22, experimenting with respect to speed of convergence depending on the choice of x0.(c) Apply your program to f(x) = x21 + x42 and to f(x) = x41 + x42, x0 = (2, 1). Graph level curves and your path of descent. (Try to
What happens in Example 1 of Sec. 22.1 if you replace f(x) = x21 + 3x22 with f(x) = x21 + 5x22? Start from x0 = [6 3]T. Do 5 steps. Is the convergence faster or slower?
What is the meaning of the slack variables x3, x4 in Example 2 in terms of the problem in Example 1?
Maximize f = 2x1 + 3x2 + 2x3, x1 ≥ 0, x2 ≥ 0, x3 ≥ 0, x1 + 2x2 - 4x3 ≤ 2, x1 + 2x2 + 2x3 ≤ 5.
Write in normal form and solve by the simplex method, assuming all xj to be nonnegative.Maximize f = 2x1 + x2 + 3x3 subject to 4x1 + 3x2 + 6x3 = 12
What are slack variables? Why did we introduce them?
What is an objective function? A feasible solution?
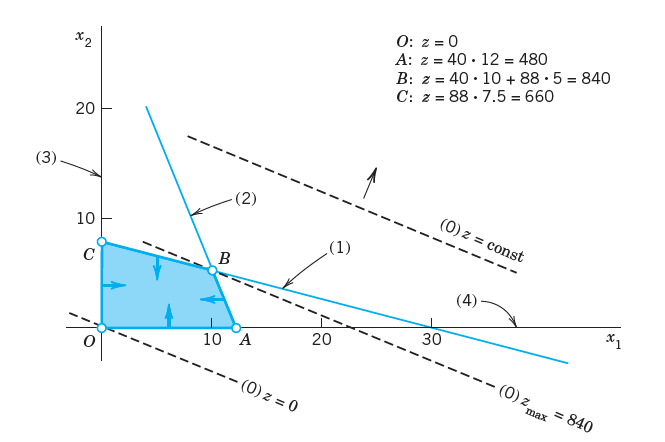
Could we find a profit f(x1, x2) = α1x1 + α2x2 whose maximum is at an interior point of the quadrangle in Fig. 474? Give reason for your answer.
Maximize f = 5x1 + 8x2 + 4x3 subject to xj ≥ 0(j = 1, · · ·, 5) and x1 + x3 + x5 = 1, x2 + x3 + x4 = 1.
Do steepest descent steps when:f(x) = x21 + cx22, x0 = (c, 1). Show that 2 steps give (c, 1) times a factor, -4c2/(c2 - 1)2. What can you conclude from this about the speed of convergence?
What is the basic idea of linear programming?
What is the method of steepest descent for a function of a single variable?
Describe and graph the regions in the first quadrant of the x1x2-plane determined by the given inequalities. -x1 + x2 ≥ 0 x1 + x2 ≤ 5-2x1 + x2 ≥ 16
Do Prob. 4 with the last two constraints interchanged. Comment on the resulting simplification. Data from Prob. 4 Maximize the daily output in producing x1 steel sheets by process PA and x2 steel sheets by process PB subject to the constraints of labor hours, machine hours, and raw material supply:
Do steepest descent steps when:f(x) = αx1 + bx2, α ≠ 0, b ≠ 0. First guess, then compute.
Write in normal form and solve by the simplex method, assuming all xj to be nonnegative.Minimize f = 5x1 - 20x2 subject to -2x1 + 10x2 ≤ 5, 2x1 + 5x2 ≤ 10.
Describe and graph the regions in the first quadrant of the x1x2-plane determined by the given inequalities. -x1 + x2 ≤ 5 2x1 + x2 ≥ 10 x2 ≥ 410x1 + 15x2 ≤ 150
Write down an algorithm for the method of steepest descent.
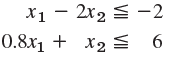
Describe and graph the regions in the first quadrant of the x1x2-plane determined by the given inequalities.-0.5x1 + x2 ≤ 2 x1 + x2 ≥ 2 -x1 + 5x2 ≥ 5
Maximize the daily output in producing x1 steel sheets by process PA and x2 steel sheets by process PB subject to the constraints of labor hours, machine hours, and raw material supply:
Do steepest descent steps when:f(x) = 2x21 + x22 - 4x1 + 4x2, x0 = 0, 3 steps
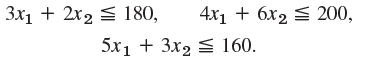
Write in normal form and solve by the simplex method, assuming all xj to be nonnegative.Maximize f = 3x1 + 2x2 subject to 3x1 + 4x2 ≤ 60, 4x1 + 3x2 ≤ 60, 10x1 + 2x2 ≤ 120.
State the idea and the formulas of the method of steepest descent.
What is unconstrained optimization? Constraint optimization? To which one do methods of calculus apply?
Describe and graph the regions in the first quadrant of the x1x2-plane determined by the given inequalities.x1 - 3x2 ≥ -6x1 + x2 ≤ 6
Solve ut = uxx (0 ≤ x ≤ 1, t ≥ 0),u(x, 0) = x2(1 - x), u(0, t) = u(1, t) = 0 by Crank–Nicolson with h = 0.2, k = 0.04, 5 time steps.
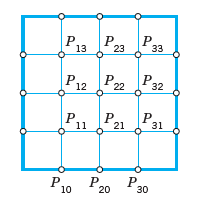
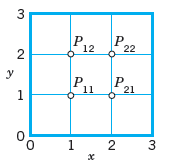
Find the potential in Fig. 472, using the given grid and the boundary values: u(P10) = u(P30) = 960, u(P20) = -480, u = 0 elsewhere on the boundary
Find the solution of the vibrating string problemutt = uxx, u(x, 0) = x(1 - x), ut = 0, u(0, t) = u(1, t) = 0 by the method with h = 0.1 and k = 0.1 for t = 0.3.
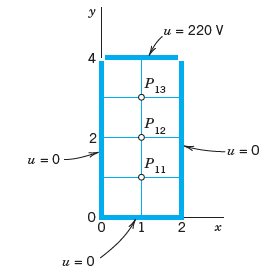
Find rough approximate values of the electrostatic potential at P11, P12, P13 in Fig. 471 that lie in a field between conducting plates (in Fig. 471 appearing as sides of a rectangle) kept at potentials 0 and 220 V as shown. (Use the indicated grid.)
Solve Prob. 19 by RK with h = 0.1, 5 steps. Compute the error. Compare with Prob. 19.Data from Prob. 19Solve y' = 1 + y2, y(0) = 0 by the improved Euler method, h = 0.1, 10 steps.
Consider the initial value problem (solution: y = 1/[2.5 - S(x)] + 0.01x2 where S(x) is the Fresnel integral (38).(a) Solve (17) by Euler, improved Euler, and RK methods for 0 ? x ? 5 with step h = 0.2. Compare the errors for x = 1, 3, 5 and comment. (b) Graph solution curves of the ODE in (17)
Do 10 steps. Compare as indicated. Show details.y' = 4x3y2, y(0) = 0.5, h = 0.1
What p0 in (18) should we choose for Prob. 16? Apply the ADI formulas (17) with that value of p0 to Prob. 16, performing 1 step. Illustrate the improved convergence by comparing with the corresponding values 0.077, 0.308 after the first step in Prob. 16. (Use the starting values zero.)Data from
In what method for PDEs did we have convergence problems?
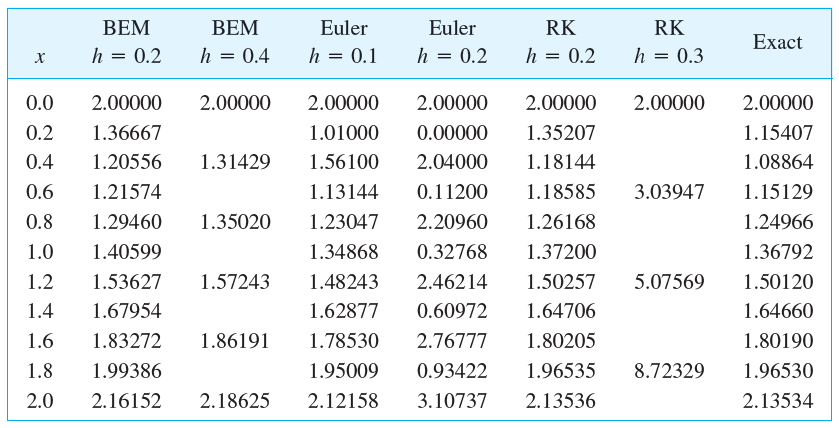
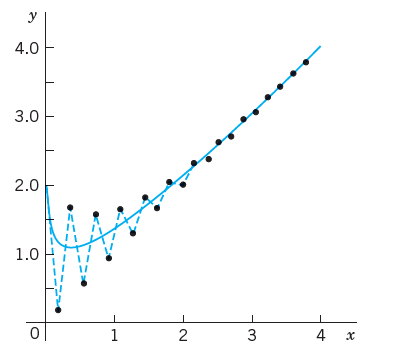
Extend Example 3 as follows.(a) Verify the values in Table 21.13 and show them graphically as in Fig. 452.Data from Table 21.13Fig 452(b) Compute and graph Euler values for h near the ?critical? h = 0.18 to determine more exactly when instability starts.(c) Compute and graph RK values for values of
Solve (1)–(3) by Crank–Nicolson with r = 1 (5 steps), where:f(x) = x(1 - x), h = 0.2
Do 10 steps. Compare as indicated. Show details.y' + y tan x = sin 2x, y(0) = 1, h = 0.1
(a) Accurate starting is important in (7a), (7b). Illustrate this in Example 1 of the text by using starting values from the improved Euler?Cauchy method and compare the results with those in Table 21.8. (b) How much does the error in Prob. 11 decrease if you use exact starting values (instead of
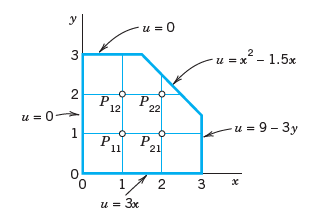
What potential do we have in Prob. 13 if V on the axes and u = 0 on the other portion of the boundary?Data from Prob. 13Solve the Laplace equation in the region and for the boundary values shown in Fig. 463, using the indicated grid. (The sloping portion of the boundary is y = 4.5 - x.) u=0- y 3 2
Can we expect a difference equation to give the exact solution of the corresponding PDE?
Find the isotherms for the square and grid in Prob. 13 if u = sin1/4 πx on the horizontal and -sin1/4πy on the vertical edges. Try to sketch some isotherms.Data from Prob. 13For the square 0 ≤ x ≤ 4, 0 ≤ y ≤ 4 let the boundary temperatures be on the horizontal and 50°C on the vertical
How many initial conditions did we prescribe for the wave equation? For the heat equation?
Solve (1)–(3) by Crank–Nicolson with r = 1 (5 steps), where:f(x) = 5x if 0 ≤ x < 0.25, f(x) = 1.25(1 - x) if 0.25 ≤ x ≤ 1, h = 0.2
Do 10 steps. Compare as indicated. Show details.y' = 1 + y2, y(0) = 0, h = 0.1
Solve the Laplace equation in the region and for the boundary values shown in Fig. 463, using the indicated grid. (The sloping portion of the boundary is y = 4.5 - x.) u=0- y 3 2 1 0 0 P₁ 12 P₁ 11 1 u = 3x u=0 P 22 P₂ 21 2 3 U = 2 x 1.5x u= 9-3y
How did we approximate the Laplace and Poisson equations?
For the square 0 ≤ x ≤ 4, 0 ≤ y ≤ 4 let the boundary temperatures be on the horizontal and 50°C on the vertical edges. Find the temperatures at the interior points of a square grid with h = 1.
When and how did we use finite differences? Give as many details as you can remember without looking into the text.
Do 10 steps. Compare as indicated. Show details.y' = xy2 = 0, y(0) = 1, h = 0.1.Compare with Prob. 7. Apply the error estimate (10) to y10. Data from Prob. 7Do 10 steps. Solve exactly. Compute the error. Show details.y' - xy2 = 0, y(0) = 1, h = 0.1
Solve Prob. 9 by (9) with h = 0.2, 2 steps. Compare with exact values obtained from the series in (2 terms) with suitable coefficients.Data from Prob. 9Solve Prob. 8 with f(x) = x if 0 ≤ x ≤ 0.2, f(x) = 0.25(1 - x) if 0.2 < x ≤ 1, the other data being as before.
Why did we have to treat the main types of PDEs in separate sections? Make a list of types of problems and numeric methods.
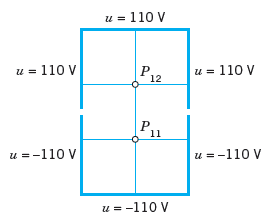
Find the potential in Fig. 457 using(a) The coarse grid.(b) The fine grid 5 × 3 and Gauss elimination. In (b), use symmetry; take u = 0 as boundary value at the two points at which the potential has a jump. u = 110 V u = -110 V u = 110 V P., 12 P.. 11 u = -110 V u = 110 V u=-110 V
How do we extend Runge–Kutta to systems of ODEs?
Do 10 steps. Solve exactly. Compute the error. Show details.Do Prob. 7 using Euler’s method with h = 0.1 and compare the accuracy.Data from Prob. 7Do 10 steps. Solve exactly. Compute the error. Show details.y' - xy2 = 0, y(0) = 1, h = 0.1
Solve by the classical RK.The system in Prob. 1Data from Prob. 1Solve by the Euler’s method. Graph the solution in the y1y2-plane. Calculate the errors.y'1 = 2y1 - 4y2, y'2 = y1 - 3y2, y1(0) = 3, y2(0) = 0, h = 0.1, 10 steps
Solve Prob. 8 with f(x) = x if 0 ≤ x ≤ 0.2, f(x) = 0.25(1 - x) if 0.2 < x ≤ 1, the other data being as before.Data from Prob. 8In a laterally insulated bar of length 1 let the initial temperature be f(x) = x if 0 ≤ x < 0.5, f(x) = 1 -x if 0.5 ≤ x ≤ 1. Let (1) and (3) hold. Apply
Solve the initial value problem by Adams–Moulton (7a), (7b), 10 steps with 1 correction per step. Solve exactly and compute the error. Use RK where no starting values are giveny' = 3x2(1 + y), y(0) = 0, h = 0.05
What is automatic step size control? When is it needed? How is it done in practice?
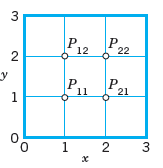
For the grid in Fig. 456 compute the potential at the four internal points by Gauss and by 5 Gauss?Seidel steps with starting values 100, 100, 100, 100 (showing the details of your work) if the boundary values on the edges are: u = sin1/3?x on the upper edge, 0 on the other edges, 10 steps. 3 2 _y
Compute u in Prob. 5 for t = 0.1 and x = 0.1, 0.2, · · ·, 0.9, using the formula in Prob. 8, and compare the values.Data from Prob. 8Compute approximate values in Prob. 7, using a finer grid (h = 0.1, k = 0.1), and notice the increase in accuracy.
What is a predictor–corrector method? Give an important example.
Do 10 steps. Solve exactly. Compute the error. Show details.y' - xy2 = 0, y(0) = 1, h = 0.1
Solve by the classical RK.The ODE in Prob. 5. By what factor did the error decrease?Data from Prob. 5Solve by the Euler’s method. Graph the solution in the y1y2-plane. Calculate the errors.y" - y = x, y(0) = 1, y'(0) = -2, h = 0.1, 5 steps
The accuracy of the explicit method depends on r(≤1/2). Illustrate this for Prob. 6, choosing r = 1/2 (and h = 0.2 as before). Do 4 steps. Compare the values for and 0.08 with the 3S-values in Prob. 6, which are 0.156, 0.254 (t = 0.04), 0.105, 0.170 (t = 0.08).Data from Prob. 6Solve the heat
Solve the initial value problem by Adams–Moulton (7a), (7b), 10 steps with 1 correction per step. Solve exactly and compute the error. Use RK where no starting values are giveny' = 3y - 12y2, y(0) = 0.2, h = 0.1
Solve Prob. 4 when un = 110 on the upper edge and u = 110 on the other edges.Data from Prob. 4Solve the mixed boundary value problem for the Laplace equation ∇2u = 0 in the rectangle in Fig. 458a (using the grid in Fig. 458b) and the boundary conditions ux = 0 on the left edge, ux = 3 on the
What does it mean that a method is not self-starting? How do we overcome this problem?
For the grid in Fig. 456 compute the potential at the four internal points by Gauss and by 5 Gauss?Seidel steps with starting values 100, 100, 100, 100 (showing the details of your work) if the boundary values on the edges are:U0 on the upper and lower edges, -U0 on the left and right. Sketch the
If the string governed by the wave equation (1) starts from its equilibrium position with initial velocity g(x) = sin πx, what is its displacement at time t = 0.4 and x = 0.2, 0.4, 0.6, 0.8? (Use the present method with h = 0.2, k = 0.2. Use (8). Compare with the exact values obtained from (12).
What are one-step methods? Multistep methods? The underlying ideas? Give examples.
Do 10 steps. Solve exactly. Compute the error. Show details.y' = y, y(0) = 1, h = 0.1
Solve by the Euler’s method. Graph the solution in the y1y2-plane. Calculate the errors.y" - y = x, y(0) = 1, y'(0) = -2, h = 0.1, 5 steps
Using (5) with h = 1 and k = 0.5, solve the heat problem (1)–(3) to find the temperature at t = 2 in a laterally insulated bar of length 10 ft and initial temperature f(x) = x(1 - 0.1x).
Solve the initial value problem by Adams–Moulton (7a), (7b), 10 steps with 1 correction per step. Solve exactly and compute the error. Use RK where no starting values are givenDo Prob. 3 by RK, 5 steps, h = 0.2. Compare the errors.Data from Prob. 3Solve the initial value problem by
What is adaptive integration? How does its idea extend to Runge–Kutta?
For the grid in Fig. 456 compute the potential at the four internal points by Gauss and by 5 Gauss?Seidel steps with starting values 100, 100, 100, 100 (showing the details of your work) if the boundary values on the edges are: u (1, 0) = 60, u (2, 0) = 300, u = 100 on the other three edges. 3 2
Illustrate the starting procedure when both f and g are not identically zero, say, f(x) = 1 - cos 2πx, g(x) = x(1 - x), h = k = 0.1, 2 time steps.
Why did we compute auxiliary values in each Runge–Kutta step? How many?
Do 10 steps. Solve exactly. Compute the error. Show details.y' = (y - x)2, y(0) = 0, h = 0.1
Solve by the Euler’s method. Graph the solution in the y1y2-plane. Calculate the errors.y" + 1/4y = 0, y(0) = 1, y'(0) = 0, h = 0.2, 5 steps
Solve the initial value problem by Adams–Moulton (7a), (7b), 10 steps with 1 correction per step. Solve exactly and compute the error. Use RK where no starting values are giveny' = 1 + y2, y(0) = 0, h = 0.1, (0.100335, 0.202710, 0.309336)
What are the local and the global orders of a method? Give examples.
Conclude from the boundary values in Example 1 that u21 = u11 and u22 = u12. Show that this leads to a system of two equations and solve it.
Using the present method, solve (1)–(4) with h = k = 0.2 for the given initial deflection and initial velocity 0 on the given t-interval.f(x) = 0.2(x - x2), 0 ≤ t ≤ 2
Derive the difference approximation (4) of the heat equation.
Showing 1700 - 1800
of 3937
First
11
12
13
14
15
16
17
18
19
20
21
22
23
24
25
Last
Step by Step Answers