New Semester
Started
Get
50% OFF
Study Help!
--h --m --s
Claim Now
Question Answers
Textbooks
Find textbooks, questions and answers
Oops, something went wrong!
Change your search query and then try again
S
Books
FREE
Study Help
Expert Questions
Accounting
General Management
Mathematics
Finance
Organizational Behaviour
Law
Physics
Operating System
Management Leadership
Sociology
Programming
Marketing
Database
Computer Network
Economics
Textbooks Solutions
Accounting
Managerial Accounting
Management Leadership
Cost Accounting
Statistics
Business Law
Corporate Finance
Finance
Economics
Auditing
Tutors
Online Tutors
Find a Tutor
Hire a Tutor
Become a Tutor
AI Tutor
AI Study Planner
NEW
Sell Books
Search
Search
Sign In
Register
study help
mathematics
elementary statistics picturing
Elementary Statistics 11th Edition Mario F. Triola - Solutions
Philip Seymour Hoffman was 38 years of age when he won a Best Actor Oscar for his role in Capote. The Oscar-winning Best Actors have a mean age of 43.8 years and a standard deviation of 8.9 years.a. What is the difference between Hoffman’s age and the mean age?b. How many standard deviations is
When designing a new thrill ride for an amusement park, the designer must consider the sitting heights of males. Listed below are the sitting heights (in millimeters) obtained from a simple random sample of adult males (based on anthropometric survey data from Gordon, Churchill, et al.). Use the
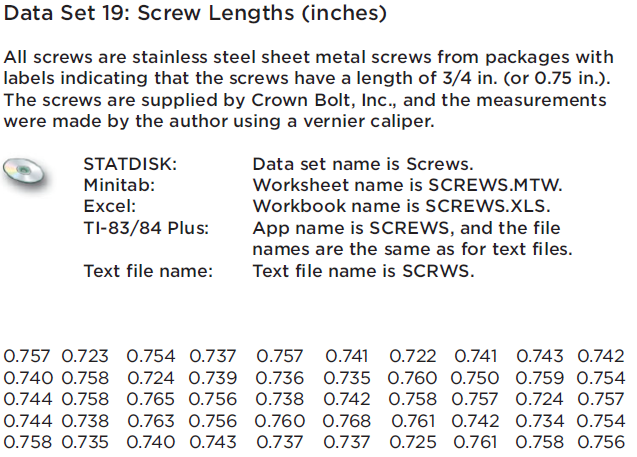
Use the listed lengths of the machine screws from Data Set 19 in Appendix B. The screws are supposed to have a length of 3/4 in. Do the results indicate that the specified length is correct? Refer to the indicated data set in Appendix B. Use computer software or a calculator to find the means and
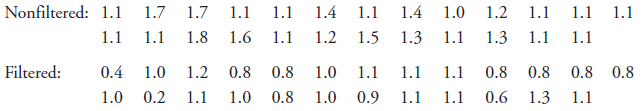
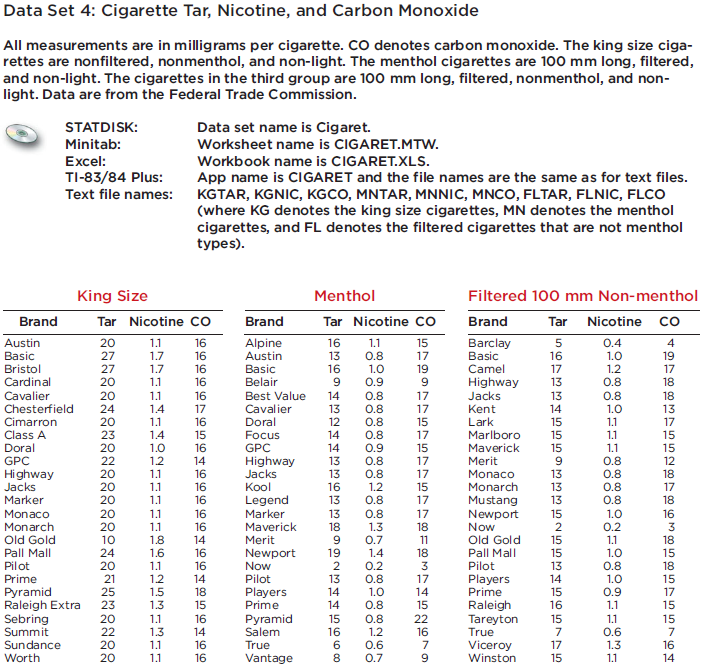
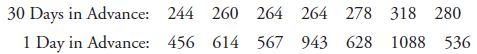
Listed below are the nicotine amounts (in mg per cigarette) for samples of filtered and nonfiltered cigarettes (from Data Set 4 in Appendix B). Do filters appear to be effective in reducing the amount of nicotine? Find the mean and median for each of the two samples, then compare the two sets of
Use the listed lengths of the machine screws from Data Set 19 in Appendix B. Refer to the indicated data set in Appendix B. Use computer software or a calculator to find the range, variance, and standard deviation. Data Set 19: Screw Lengths (inches) All screws are stainless steel sheet metal
Use the same list of 24 sorted values given for Exercises 15-18. Find the indicated percentile or quartile.Q1
Listed below are amounts of strontium-90 (in millibecquerels or mBq per gram of calcium) in a simple random sample of baby teeth obtained from Pennsylvania residents born after 1979 (based on data from ?An Unexpected Rise in Strontium-90 in U.S. Deciduous Teeth in the 1990s,? by Mangano, et al.,
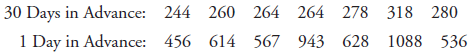
Listed below are costs (in dollars) of roundtrip flights from JFK airport in New York City to San Francisco. All flights involve one stop and a two-week stay. The airlines are US Air, Continental, Delta, United, American, Alaska, and Northwest. 30 Days in Advance: 244 260 264 264 278 318 280 1 Day
Use the same list of 24 sorted values given for Exercises 15-18. Find the indicated percentile or quartile.Q3
Listed below are costs (in dollars) of roundtrip flights from JFK airport in New York City to San Francisco. (All flights involve one stop and a two-week stay.) The airlines are US Air, Continental, Delta, United, American, Alaska, and Northwest. Does it make much of a difference if the tickets are
Use the same list of 24 sorted values given for Exercises 15-18. Find the indicated percentile or quartile.P80
Listed below are the nicotine amounts (in mg per cigarette) for samples of filtered and nonfiltered cigarettes (from Data Set 4 in Appendix B). Nonfiltered: 1.1 1.7 1.7 1.0 1.2 1.1 1.1 1.1 1.3 1.1 0.8 0.8 0.8 0.8 0.6 1.3 1.1 1.1 1.1 1.4 1.1 1.4 1.1 1.1 1.8 1.6 1.1 1.2 1.3 1.5 1.1 1.1 Filtered: 0.4
Listed below are the numbers of bankruptcy filings in Dutchess County, New York State. The numbers are listed in order for each month of a recent year (based on data from the Poughkeepsie Journal ). Identify any of the values that are unusual.59 85 98 106 120 117 97 95 143 371 14 15Find the range,
Environmental scientists measured the greenhouse gas emissions of a sample of cars. The amounts listed below are in tons (per year), expressed as CO2 equivalents. Given that the values are a simple random sample selected from Data Set 16 in Appendix B, are these values a simple random sample of
Environmental scientists measured the greenhouse gas emissions of a sample of cars. The amounts listed below are in tons (per year), expressed as equivalents. Is the value of 9.3 tons unusual?7.2 7.1 7.4 7.9 6.5 7.2 8.2 9.3Find the range, variance, and standard deviation for the given sample data.
Use the given sorted values, which are the numbers of points scored in the Super Bowl for a recent period of 24 years. Find the percentile corresponding to the given number of points.36 37 37 39 39 41 43 44 44 47 50 53 54 55 56 56 57 59 61 61 65 69 69 75
Listed below are the numbers of satellites in orbit from different countries. Does one country have an exceptional number of satellites? Can you guess which country has the most satellites?158 17 15 18 7 3 5 1 8 3 4 2 4 1 2 3 1 1 1 1 1 1 1 1
Listed below are the numbers of satellites in orbit from different countries. Based on these results, is it unusual for a country to not have any satellites? Why or why not?158 17 15 18 7 3 5 1 8 3 4 2 4 1 2 3 1 1 1 1 1 1 1 1Find the range, variance, and standard deviation for the given sample
Listed below are the playing times (in seconds) of songs that were popular at the time of this writing. (The songs are by Timberlake, Furtado, Daughtry, Stefani, Fergie, Akon, Ludacris, Beyonce, Nickelback, Rihanna, Fray, Lavigne, Pink, Mims, Mumidee, and Omarion.) Is there one time that is very
Use the given sorted values, which are the numbers of points scored in the Super Bowl for a recent period of 24 years. Find the percentile corresponding to the given number of points.36 37 37 39 39 41 43 44 44 47 50 53 54 55 56 56 57 59 61 61 65 69 69 7547
Listed below are the annual salaries for a simple random sample of NCAA football coaches (based on data from USA Today). How do the mean and median change if the highest salary is omitted?$150,000 $300,000 $350,147 $232,425 $360,000 $1,231,421 $810,000
Scores on the SAT test have a mean of 1518 and a standard deviation of 325. Scores on the ACT test have a mean of 21.1 and a standard deviation of 4.8. Which is relatively better: a score of 1190 on the SAT test or a score of 16.0 on the ACT test? Why?
Listed below are the annual salaries for a simple random sample of NCAA football coaches (based on data from USA Today). How does the standard deviation change if the highest salary is omitted?$150,000 $300,000 $350,147 $232,425 $360,000 $1,231,421 $810,000 $229,000Find the range, variance, and
Fuel consumption is commonly measured in miles per gallon. The Environmental Protection Agency designed new fuel consumption tests to be used starting with 2008 car models. Listed below are randomly selected amounts by which the measured MPG ratings decreased because of the new 2008 standards. For
Scores on the SAT test have a mean of 1518 and a standard deviation of 325. Scores on the ACT test have a mean of 21.1 and a standard deviation of 4.8. Which is relatively better: a score of 1840 on the SAT test or a score of 26.0 on the ACT test? Why?
Fuel consumption is commonly measured in miles per gallon. The Environmental Protection Agency designed new fuel consumption tests to be used starting with 2008 car models. Listed below are randomly selected amounts by which the measured MPG ratings decreased because of the new 2008 standards. For
White blood cell counts (in cells per microliter) have a mean of 7.14 and a standard deviation of 2.51 (based on data from the National Center for Health Statistics). Find the z score corresponding to a person who had a measured white blood cell count of 16.60. Is this level unusually high?
Listed below are the durations (in hours) of a simple random sample of all flights (as of this writing) of NASA’s Space Transport System (space shuttle). The data are from Data Set 10 in Appendix B. Is there a duration time that is very unusual? How might that duration time be explained?73 95 235
A woman wrote to Dear Abby and claimed that she gave birth 308 days after a visit from her husband, who was in the Navy. Lengths of pregnancies have a mean of 268 days and a standard deviation of 15 days. Find the z score for 308 days. Is such a length unusual? What do you conclude?
What is the major flaw in the histogram (in the margin) of the outcomes of 100 rolls of a fair die?
A physician routinely makes physical examinations of children. She is concerned that a three-year-old girl has a height of only 87.8 cm. Heights of three-year-old girls have a mean of 97.5 cm and a standard deviation of 6.9 cm (based on data from the National Health and Nutrition Examination
The U.S. Army requires women’s heights to be between 58 in. and 80 in. Women have heights with a mean of 63.6 in. and a standard deviation of 2.5 in. Find the z score corresponding to the minimum height requirement and find the z score corresponding to the maximum height requirement. Determine
Human body temperatures have a mean of 98.20°F and a standard deviation of 0.62°F (based on Data Set 2 in Appendix B). Convert each given temperature to a z score and determine whether it is usual or unusual.a. 101.00°Fb. 96.90°Fc. 96.98°F
Listed below are the top 10 annual salaries (in millions of dollars) of TV personalities (based on data from OK! magazine). These salaries correspond to Letterman, Cowell, Sheindlin, Leno, Couric, Lauer, Sawyer, Viera, Sutherland, and Sheen. Given that these are the top 10 salaries, do we know
Engineers consider the overhead grip reach (in millimeters) of sitting adult women when designing a cockpit for an airliner. Those grip reaches have a mean of 1212 mm and a standard deviation of 51 mm (based on anthropometric survey data from Gordon, Churchill, et al.). Use the range rule of thumb
Listed below are the top 10 annual salaries (in millions of dollars) of TV personalities (based on data from OK! magazine). These salaries correspond to Letterman, Cowell, Sheindlin, Leno, Couric, Lauer, Sawyer, Viera, Sutherland, and Sheen. Given that these are the top 10 salaries, do we know
The FICO credit rating scores obtained in a simple random sample are listed below. As of this writing, the reported mean FICO score was 678. Do these sample FICO scores appear to be consistent with the reported mean?714 751 664 789 818 779 698 836 753 834 693 802
What is a simple random sample? What is a voluntary response sample? Which of those two samples is generally better?
a. Estimate the mean length of time that traffic lights are red.b. Use the range rule of thumb to make a rough estimate of the standard deviation of the lengths of times that traffic lights are red.
Bao Xishun is the world’s tallest man with a height of 92.95 in. (or 7 ft, 8.95 in.). Men have heights with a mean of 69.6 in. and a standard deviation of 2.8 in.a. What is the difference between Bao’s height and the mean height of men?b. How many standard deviations is that (the difference
A simple random sample of FICO credit rating scores is listed below. As of this writing, the mean FICO score was reported to be 678. Based on these results, is a FICO score of 500 unusual? Why or why not?714 751 664 789 818 779 698 836 753 834 693 802Find the range, variance, and standard deviation
The Insurance Institute for Highway Safety conducted tests with crashes of new cars traveling at 6 mi/h. The total cost of the damages was found for a simple random sample of the tested cars and listed below. Do the different measures of center differ very much?$7448 $4911 $9051
Shortly after the World Trade Center towers were destroyed, America Online ran a poll of its Internet subscribers and asked this question: “Should the World Trade Center towers be rebuilt?” Among the 1,304,240 responses, 768,731 answered “yes,” 286,756 answered “no,” and 248,753 said
a. Estimate the mean age of cars driven by students at your college.b. Use the range rule of thumb to make a rough estimate of the standard deviation of the ages of cars driven by students at your college.
Eruptions of the Old Faithful geyser have duration times with a mean of 245.0 sec and a standard deviation of 36.4 sec (based on Data Set 15 in Appendix B). One eruption had a duration time of 110 sec.a. What is the difference between a duration time of 110 sec and the mean?b. How many standard
The Insurance Institute for Highway Safety conducted tests with crashes of new cars traveling at 6 mi/h. The total cost of the damages for a simple random sample of the tested cars are listed below. Based on these results, is damage of $10,000 unusual? Why or why not?$7448 $4911 $9051
SAT scores have a mean of 1518 and a standard deviation of 325. Scores on the ACT test have a mean of 21.1 and a standard deviation of 4.8. Which is relatively better: a score of 1030 on the SAT test or a score of 14.0 on the ACT test? Why?
Using the same sitting heights listed in Exercise 3, construct a boxplot and include the values of the 5-number summary. Does the boxplot suggest that the data are from a population with a normal (bell-shaped) distribution? Why or why not?
As of this writing, the most recent Oscar-winning Best Actress was Helen Mirren, who was 61 at the time of the award. The Oscar-winning Best Actresses have a mean age of 35.8 years and a standard deviation of 11.3 years.a. What is the difference between Helen Mirren’s age and the mean age?b. How
When the Indianapolis Colts recently won the Super Bowl, the numbers on the jerseys of the active players were 29, 41, 50, 58, 79, . . ., 10 (listed in the alphabetical order of the player’s names). Does it make sense to calculate the mean of those numbers? Why or why not?
Use the sitting heights listed in Review Exercise 3 to construct a dotplot.
Using the sample data from Exercise 3, find the z score corresponding to the sitting height of 878 mm. Based on the result, is the sitting height of 878 mm unusual? Why or why not?
The annual sunspot numbers are found for a recent sequence of 24 years. The data are sorted, then it is found that the mean is 81.09, the standard deviation is 50.69, the minimum is 8.6, the first quartile is 29.55, the median is 79.95, the third quartile is 123.3, and the maximum is 157.6. What
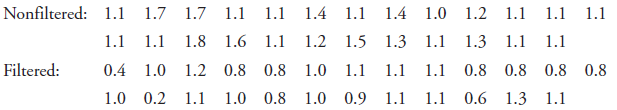
Refer to the two STATDISK-generated boxplots shown below that are drawn on the same scale. One boxplot represents weights of randomly selected men and the other represents weights of randomly selected women. Which boxplot represents women? How do you know? Which boxplot depicts weights with more
The systolic blood pressures of 40 women are given in Data Set 1 in Appendix B. They have a mean of 110.8 mm Hg and a standard deviation of 17.1 mm Hg. The highest systolic blood pressure measurement in this sample is 181 mm Hg. In this context, is a systolic blood pressure of 181 mm Hg
In an editorial, the Poughkeepsie Journal printed this statement: “The median price—the price exactly in between the highest and lowest—. . .” Does that statement correctly describe the median? Why or why not?
Use the frequency distribution from Exercise 2 to construct a histogram. Based on the result, does the distribution appear to be uniform, normal (bell-shaped), or skewed?A student of the author weighed a simple random sample of Porterhouse steaks, and the results (in ounces) are listed below. The
Nola Ochs recently became the oldest college graduate when she graduated at the age of 95. If her age is included with the ages of 25 typical college students at the times of their graduations, how much of an effect will her age have on the mean, median, standard deviation, and range?
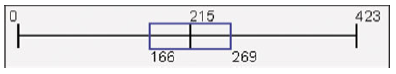
Shown below is a STATDISK-generated boxplot of the durations (in hours) of flights of NASA?s Space Shuttle. What do the values of 0, 166, 215, 269, and 423 tell us? 423 215 166 269
Which do you think has more variation: the incomes of a simple random sample of 1000 adults selected from the general population, or the incomes of a simple random sample of 1000 statistics teachers? Why?
A headline in USA Today stated that “Average family income drops 2.3%.” What is the role of the term average in statistics? Should another term be used in place of average?
Use the sitting heights listed in Review Exercise 3 to construct a frequency distribution. Use a class width of 10 mm, and use 870 mm as the lower class limit of the first class.When designing a new thrill ride for an amusement park, the designer must consider the sitting heights of males. Listed
Using the same weights listed in Exercise 1, construct a boxplot and include the values of the 5-number summary.
An article in the New York Times noted that the ZIP code of 10021 on the Upper East Side of Manhattan is being split into the three ZIP codes of 10065, 10021, and 10075 (in geographic order from south to north). The ZIP codes of 11 famous residents (including Bill Cosby, Spike Lee, and Tom Wolfe)
A set of data consists of the heights of presidents of the United States, measured in centimeters. If the height of President Kennedy is converted to a z score, what unit is used for the z score? Centimeters?
In the book How to Lie with Charts, it is stated that “the standard deviation is usually shown as plus or minus the difference between the high and the mean, and the low and the mean. For example, if the mean is 1, the high 3, and the low - 1, the standard deviation is ± 2” Is that statement
Refer to the sitting heights listed in Review Exercise 3.a. Are the sitting heights from a population that is discrete or continuous?b. What is the level of measurement of the sitting heights? (nominal, ordinal, interval, ratio)When designing a new thrill ride for an amusement park, the designer
A student of the author weighed a simple random sample of Porterhouse steaks, and the results (in ounces) are listed below. The steaks are supposed to be 21 oz because they are listed on the menu as weighing 20 ounces, and they lose an ounce when cooked. Use the listed weights to find the (a) mean;
Cans of regular Coke are supposed to contain 12 oz of cola. If a quality control engineer finds that the production process results in cans of Coke having a mean of 12 oz, can she conclude that the production process is proceeding as it should? Why or why not?
When Reese Witherspoon won an Oscar as Best Actress for the movie Walk the Line, her age was converted to a z score of - 0.61 when included among the ages of all other Oscar-winning Best Actresses at the time of this writing. Was her age above the mean or below the mean? How many standard
In statistics, how do variation and variance differ?
Listed below are blood groups of O, A, B, and AB of randomly selected blood donors (based on data from the Greater New York Blood Program). Construct a table summarizing the frequency distribution of these blood groups.O A B O O O O O AB O O O O B O B O A A A O A A B ABA B A A A A O A O O A A O O A
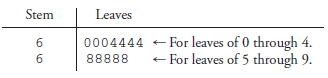
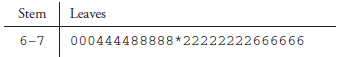
Refer to the stemplot in Example 5 to complete the following. a. The stemplot can be expanded by subdividing rows into those with leaves having digits of 0 through 4 and those with digits 5 through 9. The first two rows of the expanded stemplot are shown. Identify the next two rows. b. The
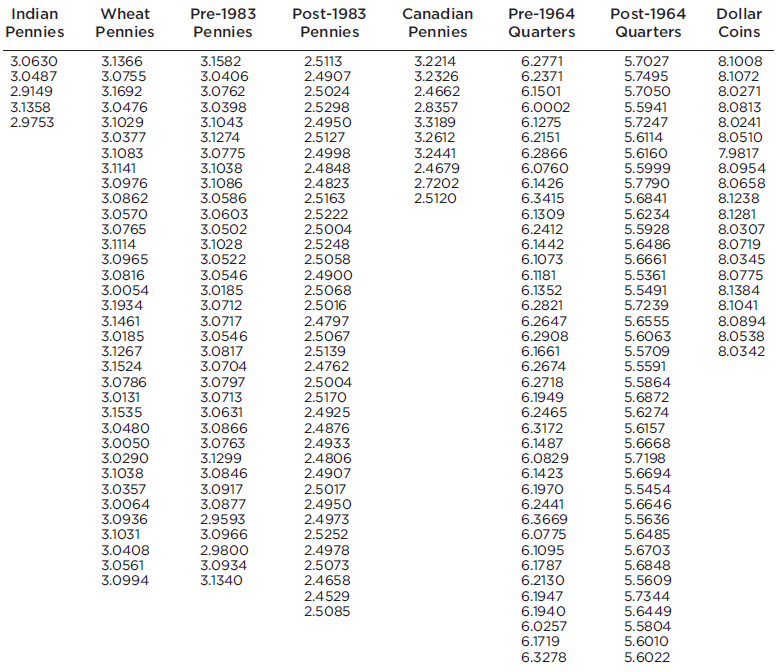
Refer to Data Set 20 in Appendix B and use the weights (grams) of the post-1964 quarters. Construct a frequency distribution. Begin with a lower class limit of 5.5000 g, and use a class width of 0.0500 g. Compare the frequency distribution to the result from Exercise 27. Indian Wheat Pre-1983
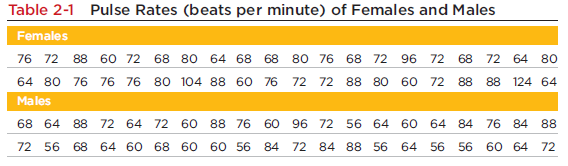
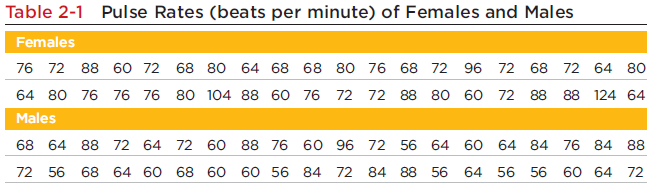
A format for back-to-back stemplots representing the pulse rates of females and males from Table 2-1 (on page 47) is shown in the margin. Complete the back-to-back stemplot, then compare the results. Table 2-1 Pulse Rates (beats per minute) of Females and Males Females 76 72 88 60 72 68 80 64 68
Refer to Data Set 20 in Appendix B and use the weights (grams) of the pre-1964 quarters. Construct a frequency distribution. Begin with a lower class limit of 6.0000 g, and use a class width of 0.0500 g. Indian Wheat Pre-1983 Post-1983 Canadian Pre-1964 Post-1964 Dollar Pennies Pennies Pennies
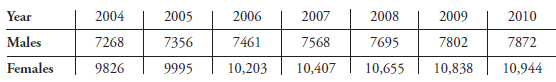
The following table lists (in thousands) the numbers of male and female higher education students for different years. (Projections are from the U.S. National Center for Education Statistics.) Construct a multiple bar graph of the data, then describe any trends. Year 2004 2005 2006 2007 2008 2009
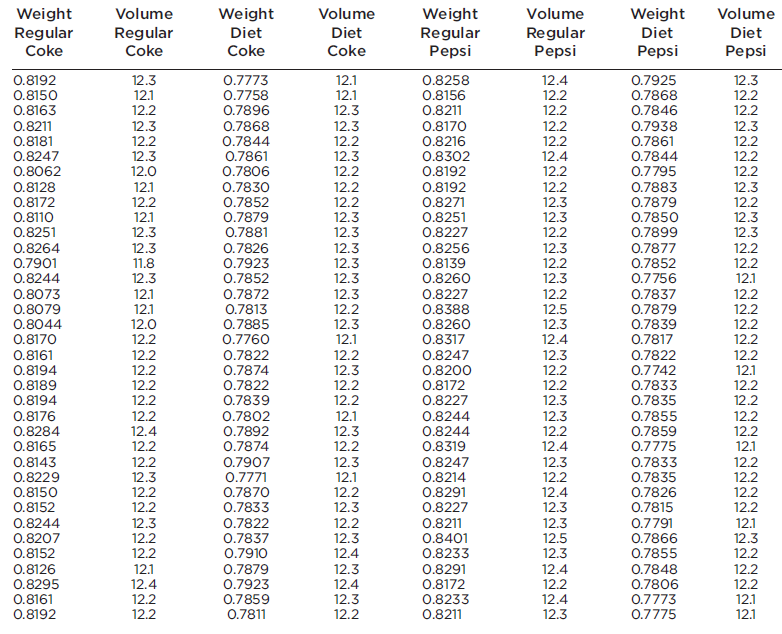
Refer to Data Set 17 in Appendix B. Construct a relative frequency distribution for the weights of regular Coke. Start with a lower class limit of 0.7900 lb, and use a class width of 0.0050 lb. Then construct another relative frequency distribution for the weights of Diet Coke by starting with a
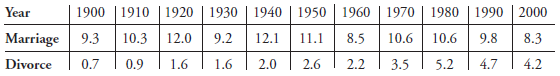
The following table lists the marriage and divorce rates per 1000 people in the United States for selected years since 1900 (based on data from the Department of Health and Human Services). Construct a multiple bar graph of the data. Why do these data consist of marriage and divorce rates rather
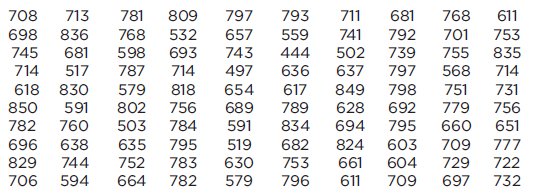
Refer to Data Set 24 in Appendix B for the FICO credit rating scores. Construct a frequency distribution beginning with a lower class limit of 400, and use a class width of 50. Does the result appear to have a normal distribution? Why or why not? 713 797 657 743 497 654 793 559 444 636 617 789 834
The following table shows the numbers of cell phone subscriptions (in thousands) in the United States for various years. Construct a time-series graph of the data. ?Linear? growth would result in a graph that is approximately a straight line. Does the time-series graph appear to show linear
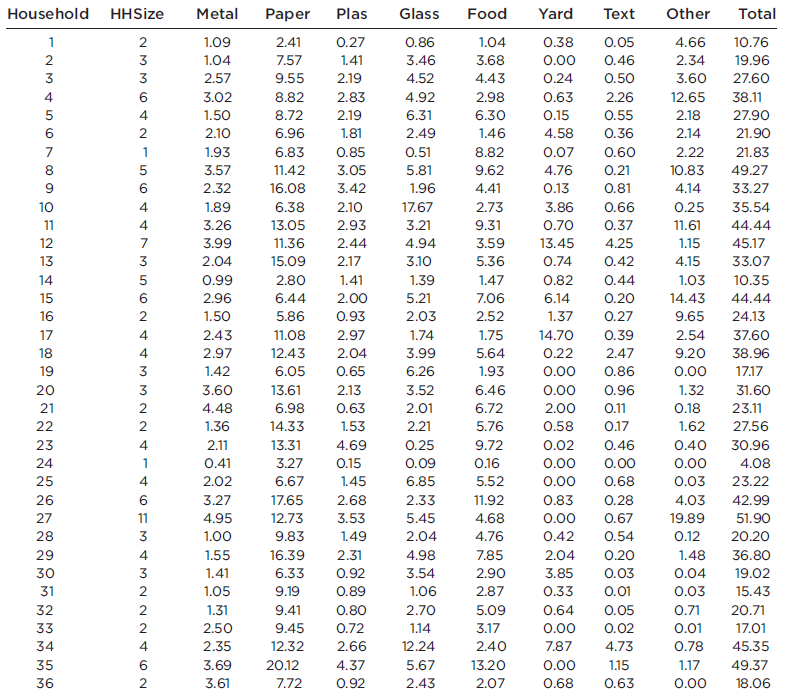
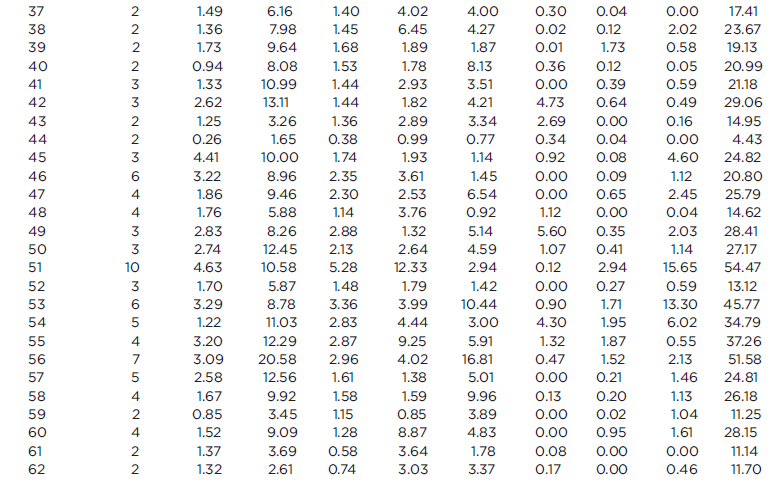
As part of the Garbage Project at the University of Arizona, the discarded garbage for 62 households was analyzed. Refer to the 62 weights of discarded paper from Data Set 22 in Appendix B and construct a frequency distribution. Begin with a lower class limit of 1.00 lb, and use a class width of
In 1965, Intel cofounder Gordon Moore proposed what has since become known as Moore?s law: the number of transistors per square inch on integrated circuits will double approximately every 18 months. The table below lists the number of transistors per square inch (in thousands) for several different
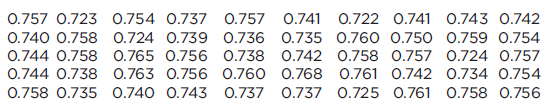
Refer to Data Set 19 in Appendix B and use the 50 screw lengths to construct a frequency distribution. Begin with a lower class limit of 0.720 in., and use a class width of 0.010 in. The screws were labeled as having a length of 3/4 in. Does the frequency distribution appear to be consistent with
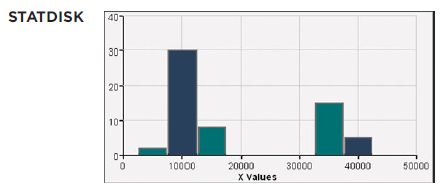
What is the minimum possible number of miles traveled by an automobile included in the histogram? What is the maximum possible number of miles traveled? The following STATDISKgenerated histogram, which represents the numbers of miles driven by automobiles in New York City. STATDISK 40 30 20- 10
A histogram is to be constructed from the durations (in hours) of NASA space shuttle flights listed in Data Set 10 in Appendix B. Without actually constructing that histogram, simply identify two key features of the histogram that would suggest that the data have a normal distribution.
In constructing a graph that compares the land areas of the five largest countries, you choose to depict the five areas with squares of different sizes. If the squares are drawn so that the areas are in proportion to the areas of the corresponding countries, is the resulting graph misleading? Why
Examples 7 and 8 show a Pareto chart and pie chart for job procurement data. For such data, why is it generally better to use a Pareto chart instead of a pie chart?
See the accompanying graph depicting the number of men and the number of women who earned associate’s degrees in mathematics for a recent year (based on data from the U.S. National Center for Education Statistics). What is wrong with this graph?
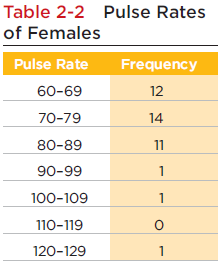
Construct a frequency distribution of the pulse rates of males listed in Table 2-1 on page 47. Use the classes of 50?59, 60?69, and so on. How does the result compare to the frequency distribution for the pulse rates of females as shown in Table 2-2 on page 47? Table 2-1 Pulse Rates (beats per
In an ad for the Club, a device used to discourage car thefts, it was stated that “The Club reduces your odds of car theft by 400%.” What is wrong with this statement?
A study compared surgery and splinting for subjects suffering from carpal tunnel syndrome. It was found that among 73 patients treated with surgery, there was a 92% success rate. Among 83 patients treated with splints, there was a 72% success rate. Calculations using those results showed that if
In a letter to the editor in the New York Times, Moorestown, New Jersey, resident Jean Mercer criticized the statement that “putting infants in the supine position has decreased deaths from SIDS.” (SIDS refers to sudden infant death syndrome, and the supine position is lying on the back with
A car is randomly selected at a traffic safety checkpoint, and the car has 6 cylinders.Determine whether the given values are from a discrete or continuous data set.
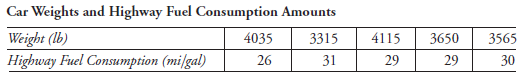
Refer to the given table of car measurements. Are the x values matched with the corresponding y values, as in Table 1-1 on page 5? That is, is each x value somehow associated with the corresponding y value in some meaningful way? If the x and y values are matched, does it make sense to use the
Six different health plans were randomly selected, and all of their members were surveyed about their satisfaction (based on a project sponsored by RAND and the Center for Health Care Policy and Evaluation).Identify which of these types of sampling is used: random, systematic, convenience,
After the last national census was conducted, the Poughkeepsie Journal ran this front-page headline: “281,421,906 in America.” What is wrong with this headline?
In Data Set 12, use the 22 average daily temperatures and use the corresponding 22 amounts of energy consumption (kWh). (Use the temperatures for the horizontal scale.) Based on the result, is there a relationship between the average daily temperatures and the amounts of energy consumed? Try to
Refer to Data Set 21 in Appendix B for the axial loads of aluminum cans that are 0.0111 in. thick. The load of 504 lb is an outlier because it is very far away from all of the other values. Construct a histogram that includes the value of 504 lb, then construct another histogram with the value of
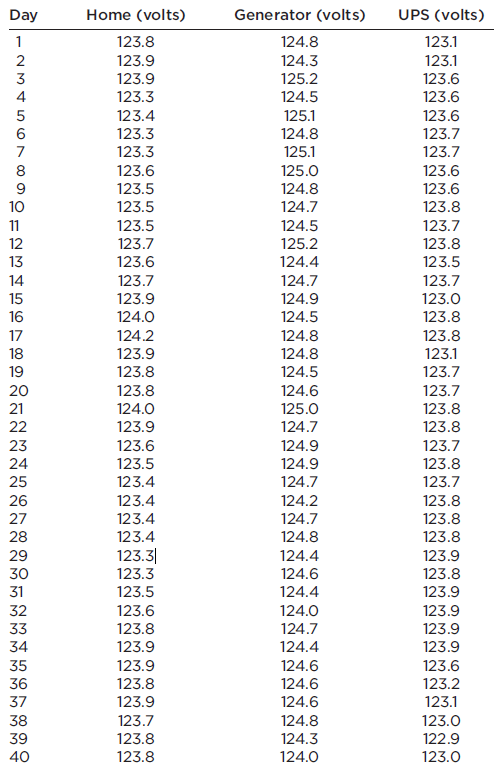
Refer to Data Set 13 in Appendix B and use the 40 voltage measurements from the generator. Construct a frequency distribution with seven classes. Begin with a lower class limit of 123.9 volts, and use a class width of 0.20 volt. Using a very loose interpretation of the relevant criteria, does the
Showing 1100 - 1200
of 2934
First
5
6
7
8
9
10
11
12
13
14
15
16
17
18
19
Last
Step by Step Answers