New Semester
Started
Get
50% OFF
Study Help!
--h --m --s
Claim Now
Question Answers
Textbooks
Find textbooks, questions and answers
Oops, something went wrong!
Change your search query and then try again
S
Books
FREE
Study Help
Expert Questions
Accounting
General Management
Mathematics
Finance
Organizational Behaviour
Law
Physics
Operating System
Management Leadership
Sociology
Programming
Marketing
Database
Computer Network
Economics
Textbooks Solutions
Accounting
Managerial Accounting
Management Leadership
Cost Accounting
Statistics
Business Law
Corporate Finance
Finance
Economics
Auditing
Tutors
Online Tutors
Find a Tutor
Hire a Tutor
Become a Tutor
AI Tutor
AI Study Planner
NEW
Sell Books
Search
Search
Sign In
Register
study help
mathematics
elementary statistics picturing
Elementary Statistics Picturing The World 7th Edition Ron Larson, Betsy Farber - Solutions
Determine the minimum sample size required when you want to be 95% confident that the sample mean is within one unit of the population mean and σ = 4.8. Assume the population is normally distributed.
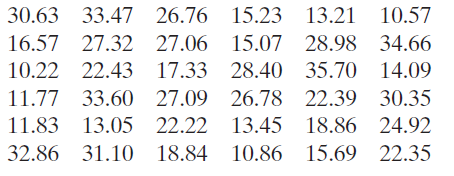
The sodium chloride concentrations (in grams per liter) for 36 randomly selected seawater samples are listed. Assume that σ is 7.61 grams per liter.Use the information to construct 90% and 99% confidence intervals for the population mean. Interpret the results and compare the widths of the
In Exercise 38, does it seem possible that the population mean could be less than 100? Explain.Data from exercise 38:From a random sample of 24 months from January 2006 through December 2016, the mean number of tornadoes per month in the United States was about 100. Assume the population standard
In Exercise 37, does it seem possible that the population mean could be greater than 90°F? Explain.Data from exercise 37:From a random sample of 64 dates, the mean record high daily temperature in the Chicago, Illinois, area has a mean of 84.13°F. Assume the population standard deviation is
In Exercise 36, does it seem possible that the population mean could be within 1% of the sample mean? Explain.Data from exercise 36:From a random sample of 36 business days from February 24, 2016, through February 24, 2017, the mean closing price of Apple stock was $116.16. Assume the population
In Exercise 35, does it seem possible that the population mean could equal the sample mean? Explain.Data from exercise 35:From a random sample of 48 business days from January 4, 2010, through February 24, 2017, U.S. gold prices had a mean of $1368.48. Assume the population standard deviation is
From a random sample of 24 months from January 2006 through December 2016, the mean number of tornadoes per month in the United States was about 100. Assume the population standard deviation is 114.You are given the sample mean and the population standard deviation. Use this information to
From a random sample of 64 dates, the mean record high daily temperature in the Chicago, Illinois, area has a mean of 84.13°F. Assume the population standard deviation is 14.56°F.You are given the sample mean and the population standard deviation. Use this information to construct 90% and 95%
From a random sample of 36 business days from February 24, 2016, through February 24, 2017, the mean closing price of Apple stock was $116.16. Assume the population standard deviation is $10.27.You are given the sample mean and the population standard deviation. Use this information to construct
A store manager reports a confidence interval of (244.07, 280.97) when estimating the mean price (in dollars) for the population of textbooks.Use the confidence interval to find the estimated margin of error. Then find the sample mean.
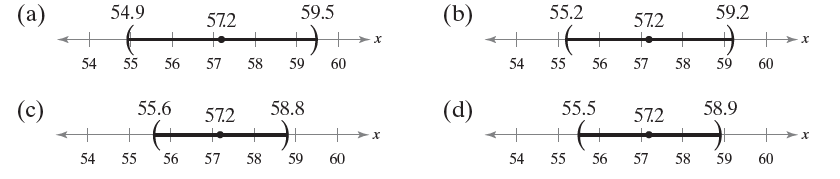
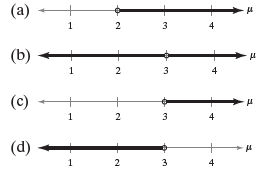
Match the level of confidence c with the appropriate confidence interval. Assume each confidence interval is constructed for the same sample statistics.c = 0.98 (a) 54.9 59.2 59.5 (b) 55.2 57.2 to 57.2 55 59 55 59 54 54 58 57 56 57 58 60 56 55.5 58.8 58.9 (c) 55.6 (d) 57.2 57.2 +>x 56 55 54 55 56
Match the level of confidence c with the appropriate confidence interval. Assume each confidence interval is constructed for the same sample statistics.c = 0.95 (a) 54.9 59.2 59.5 (b) 55.2 57.2 to 57.2 55 59 55 59 54 54 58 57 56 57 58 60 56 55.5 58.8 58.9 (c) 55.6 (d) 57.2 57.2 +>x 56 55 54 55 56
Match the level of confidence c with the appropriate confidence interval. Assume each confidence interval is constructed for the same sample statistics.c = 0.90 (a) 54.9 59.2 59.5 (b) 55.2 57.2 to 57.2 55 59 55 59 54 54 58 57 56 57 58 60 56 55.5 58.8 58.9 (c) 55.6 (d) 57.2 57.2 +>x 56 55 54 55 56
Match the level of confidence c with the appropriate confidence interval. Assume each confidence interval is constructed for the same sample statistics.c = 0.88 (a) 54.9 59.2 59.5 (b) 55.2 57.2 to 57.2 55 59 55 59 54 54 58 57 56 57 58 60 56 55.5 58.8 58.9 (c) 55.6 (d) 57.2 57.2 +>x 56 55 54 55 56
A sports statistician claims that the mean winning times for Boston Marathon women’s open division champions is at least 2.68 hours. The mean winning time of a sample of 30 randomly selected Boston Marathon women’s open division champions is 2.60 hours. Assume the population standard deviation
A random sample of 100 medical school applicants at a university has a mean total score of 502 on the MCAT. According to a report, the mean total score for the school’s applicants is more than 499. Assume the population standard deviation is 10.6. At α = 0.01, is there enough evidence to support
Test the claim about the population mean μ at the level of significance a. Assume the population is normally distributed.Claim: μ ≤ 22500; α = 0.01; σ = 1200Sample statistics: x̅ = 23,500, n = 45
Test the claim about the population mean μ at the level of significance a. Assume the population is normally distributed.Claim: μ ≠ 5880; α = 0.03; σ = 413Sample statistics: x̅ = 5771, n = 67
Test the claim about the population mean μ at the level of significance a. Assume the population is normally distributed.Claim: μ ≥ 1475; α = 0.07; σ = 29Sample statistics: x̅ = 1468, n = 26
Test the claim about the population mean μ at the level of significance a. Assume the population is normally distributed.Claim: μ = 40; α = 0.05; σ = 1.97Sample statistics: x̅ = 39.2, n = 25
Find the critical value(s) and rejection region(s) for the type of z-test with level of significance a. Include a graph with your answer.Two-tailed test, α = 0.12
Find the critical value(s) and rejection region(s) for the type of z-test with level of significance a. Include a graph with your answer.Two-tailed test, α = 0.02
Find the critical value(s) and rejection region(s) for the type of z-test with level of significance a. Include a graph with your answer.Right-tailed test, α = 0.08
Find the critical value(s) and rejection region(s) for the type of z-test with level of significance a. Include a graph with your answer.Right-tailed test, α = 0.05
Find the critical value(s) and rejection region(s) for the type of z-test with level of significance a. Include a graph with your answer.Left-tailed test, α = 0.09
Find the critical value(s) and rejection region(s) for the type of z-test with level of significance a. Include a graph with your answer.Left-tailed test, α = 0.03
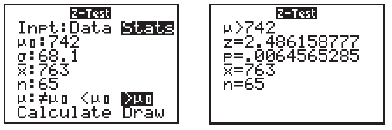
Use the TI-84 Plus displays to make a decision to reject or fail to reject the null hypothesis at the level of significance.a = 0.01 E-Test E-Test H>742 z=2.486158777 2=.0064565285 Inpt:Data Stats HO:742 g:68.1 763 X=763 X: n:65 n=65 Calculate Draw
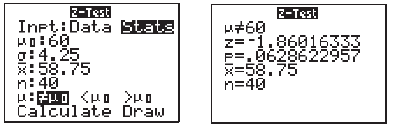
Use the TI-84 Plus displays to make a decision to reject or fail to reject the null hypothesis at the level of significance.α = 0.05 E-Test Inpț:Data Stats E-Test z=-1.8601633 P=.0628622957 H760 g:4.25 X:58.75 X=58.75 n:40 n=40 Calculate Draw
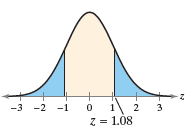
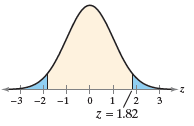
Match each P-value with the graph that displays its area without performing any calculations. Explain your reasoning.P = 0.0688 and P = 0.2802(a)(b) -3 -2 -1 Z = 1.08 -3 -2 -1 2 Z = 1.82
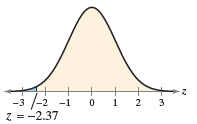
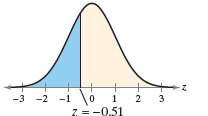
Match each P-value with the graph that displays its area without performing any calculations. Explain your reasoning.P = 0.0089 and P = 0.3050(a)(b) -3 /-2 Z =-2.37 0 1 2 3 -3 -2 -1 1 2 3 7 = -0,51
Find the P-value for the hypothesis test with the standardized test statistic z. Decide whether to reject H0 for the level of significance α.Two-tailed testz = 1.95α = 0.08
Find the P-value for the hypothesis test with the standardized test statistic z. Decide whether to reject H0 for the level of significance α.Two-tailed testz = 1.68α = 0.05
Find the P-value for the hypothesis test with the standardized test statistic z. Decide whether to reject H0 for the level of significance α.Right-tailed testz = 1.23α = 0.10
Find the P-value for the hypothesis test with the standardized test statistic z. Decide whether to reject H0 for the level of significance α.Right-tailed testz = 2.46α = 0.10
Find the P-value for the hypothesis test with the standardized test statistic z. Decide whether to reject H0 for the level of significance α.Left-tailed testz = -1.55α = 0.05
Find the P-value for the hypothesis test with the standardized test statistic z. Decide whether to reject H0 for the level of significance α.Left-tailed testz = -1.32α = 0.10
The P-value for a hypothesis test is shown. Use the P-value to decide whether to reject H0 when the level of significance is (a) a = 0.01, (b) a = 0.05, and (c) a = 0.10.P = 0.0062
Explain the difference between the z-test for m using a P-value and the z-test for μ using rejection region(s).
A null hypothesis is rejected with a level of significance of 0.10. Is it also rejected at a level of significance of 0.05? Explain.
A null hypothesis is rejected with a level of significance of 0.05. Is it also rejected at a level of significance of 0.10? Explain.
Explain why a level of significance of a = 0 is not used.
An Internet provider is trying to gain advertising deals and claims that the mean time a customer spends online per day is greater than 28 minutes. You are asked to test this claim. How would you write the null and alternative hypotheses when(a) You represent the Internet provider and want to
A backpack manufacturer claims that the mean life of its competitor’s backpacks is less than 5 years. You are asked to perform a hypothesis test to test this claim. How would you write the null and alternative hypotheses when(a) You represent the manufacturer and want to support the claim?(b) You
A transportation network company claims that the mean travel time between two destinations is about 16 minutes. You work for one of the company’s competitors and want to reject this claim. How would you write the null and alternative hypotheses?
A medical research team is investigating the mean cost of a 30-day supply of a heart medication. A pharmaceutical company thinks that the mean cost is less than $60. You want to support this claim. How would you write the null and alternative hypotheses?
A marketing organization claims that none of its employees are paid minimum wage.Determine whether the claim represents the null hypothesis or the alternative hypothesis. If a hypothesis test is performed, how should you interpret a decision that(a) Rejects the null hypothesis?(b) Fails to reject
A report claims that at least 65% of individuals convicted of terrorism or terrorism-related offenses in the United States are foreign born.Determine whether the claim represents the null hypothesis or the alternative hypothesis. If a hypothesis test is performed, how should you interpret a
A report claims that more than 40% of households in a New York county struggle to afford basic necessities.Determine whether the claim represents the null hypothesis or the alternative hypothesis. If a hypothesis test is performed, how should you interpret a decision that(a) Rejects the null
A polling organization reports that the number of responses to a survey mailed to 100,000 U.S. residents is not 100,000.State H0 and Ha in words and in symbols. Then determine whether the hypothesis test is left-tailed, right-tailed, or two-tailed. Explain your reasoning. Sketch a normal sampling
A high school claims that its mean graduation rate is more than 97%.State H0 and Ha in words and in symbols. Then determine whether the hypothesis test is left-tailed, right-tailed, or two-tailed. Explain your reasoning. Sketch a normal sampling distribution and shade the area for the P-value.
A report claims that lung cancer accounts for 25% of all cancer diagnoses.State H0 and Ha in words and in symbols. Then determine whether the hypothesis test is left-tailed, right-tailed, or two-tailed. Explain your reasoning. Sketch a normal sampling distribution and shade the area for the P-value.
A cellphone repair shop advertises that the mean cost of repairing a phone screen is less than $75.Describe type I and type II errors for a hypothesis test of the indicated claim.
A campus security department publicizes that at most 25% of applicants become campus security officers.Describe type I and type II errors for a hypothesis test of the indicated claim.
An urban planner claims that the noontime mean traffic flow rate on a busy downtown college campus street is 35 cars per minute.Describe type I and type II errors for a hypothesis test of the indicated claim.
A used textbook selling website claims that at least 60% of its new customers will return to buy their next textbook.Describe type I and type II errors for a hypothesis test of the indicated claim.
According to a recent survey, 52% of college students used their own income or savings to pay for college.Write the claim as a mathematical statement. State the null and alternative hypotheses, and identify which represents the claim.
According to a recent survey, 73% of college students did not use student loans to pay for college.Write the claim as a mathematical statement. State the null and alternative hypotheses, and identify which represents the claim.
An amusement park claims that the mean daily attendance at the park is at least 20,000 people.Write the claim as a mathematical statement. State the null and alternative hypotheses, and identify which represents the claim.
The standard deviation of the base price of an all-terrain vehicle is no more than $320.Write the claim as a mathematical statement. State the null and alternative hypotheses, and identify which represents the claim.
As stated by a company’s shipping department, the number of shipping errors per million shipments has a standard deviation that is less than 3.Write the claim as a mathematical statement. State the null and alternative hypotheses, and identify which represents the claim.
A tablet manufacturer claims that the mean life of the battery for a certain model of tablet is more than 8 hours.Write the claim as a mathematical statement. State the null and alternative hypotheses, and identify which represents the claim.
Determine whether the hypothesis test is left-tailed, right-tailed, or two-tailed.H0: p = 0.25Ha: p ≠ 0.25
Determine whether the hypothesis test is left-tailed, right-tailed, or two-tailed.H0: σ2 = 142 Ha: σ2 ≠ 142
Determine whether the hypothesis test is left-tailed, right-tailed, or two-tailed.H0: σ ≥ 5.2 Ha: σ < 5.2
Determine whether the hypothesis test is left-tailed, right-tailed, or two-tailed.H0: μ ≤ 8.0 Ha: μ > 8.0
Match the alternative hypothesis with its graph. Then state the null hypothesis and sketch its graph.H0: μ > 2 и (b) и (c) и 3 Э
Match the alternative hypothesis with its graph. Then state the null hypothesis and sketch its graph.H0: μ ≠ 3 и (b) и (c) и 3 Э
Match the alternative hypothesis with its graph. Then state the null hypothesis and sketch its graph.H0: μ < 3 и (b) и (c) и 3 Э
The statement represents a claim. Write its complement and state which is H0 and which is Ha.p = 0.21
The statement represents a claim. Write its complement and state which is H0 and which is Ha.p < 0.45
The statement represents a claim. Write its complement and state which is H0 and which is Ha.σ2 ≥ 1.2
The statement represents a claim. Write its complement and state which is H0 and which is Ha.σ ≠ 5
The statement represents a claim. Write its complement and state which is H0 and which is Ha.μ < 128
The statement represents a claim. Write its complement and state which is H0 and which is Ha.μ ≤ 645
To support a claim, state it so that it becomes the null hypothesis.Determine whether the statement is true or false. If it is false, rewrite it as a true statement.
A large P-value in a test will favor rejection of the null hypothesis.Determine whether the statement is true or false. If it is false, rewrite it as a true statement.
The level of significance is the maximum probability you allow for rejecting a null hypothesis when it is actually true.Determine whether the statement is true or false. If it is false, rewrite it as a true statement.
If you decide to reject the null hypothesis, then you can support the alternative hypothesis.Determine whether the statement is true or false. If it is false, rewrite it as a true statement.
A statistical hypothesis is a statement about a sample.Determine whether the statement is true or false. If it is false, rewrite it as a true statement.
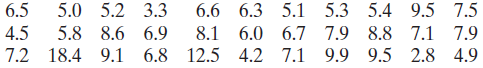
The acceleration times (in seconds) from 0 to 60 miles per hour for 33 randomly selected sedans are listed. Use a 98% level of confidence.Assume the sample is from a normally distributed population and construct the indicated confidence intervals for (a) The population variance σ2
The maximum wind speeds (in knots) of 13 randomly selected hurricanes that have hit the U.S. mainland are listed. Use a 95% level of confidence. 70 85 70 75 100 100 110 105 130 75
Find the critical values χ2 R and χ2 L for the level of confidence c and sample size n.c = 0.99, n = 10
Find the critical values χ2 R and χ2 L for the level of confidence c and sample size n.c = 0.90, n = 16
Find the critical values χ2 R and χ2 L for the level of confidence c and sample size n.c = 0.98, n = 25
Find the critical values χ2 R and χ2 L for the level of confidence c and sample size n.c = 0.95, n = 13
In Exercise 25(b), would a sample size of 369 be acceptable? Explain.Data from Exercise 25:You wish to estimate, with 95% confidence, the population proportion of U.S. adults who have taken or planned to take a winter vacation in a recent year. Your estimate must be accurate within 5% of the
You wish to estimate, with 95% confidence, the population proportion of U.S. adults who have taken or planned to take a winter vacation in a recent year. Your estimate must be accurate within 5% of the population proportion. (a) No preliminary estimate is available. Find the minimum sample
In Exercise 22, does it seem possible that the population proportion could be within 1% of the point estimate? Explain.Data from Exercise 22:In a survey of 2223 U.S. adults, 1334 say an occupation as an athlete is prestigious.
In Exercise 19, does it seem possible that the population proportion could equal 0.75? Explain.Data from Exercise 19:In a survey of 1035 U.S. adults, 745 say they want the U.S. to play a leading or major role in global affairs.
In a survey of 2223 U.S. adults, 1334 say an occupation as an athlete is prestigious.Let p be the population proportion for the situation. (a) Find point estimates of p and q, (b) Construct 90% and 95% confidence intervals for p, and (c) Interpret the results of part (b) and compare
In a survey of 2202 U.S. adults, 1167 think antibiotics are effective against viral infections.Let p be the population proportion for the situation. (a) Find point estimates of p and q, (b) Construct 90% and 95% confidence intervals for p, and (c) Interpret the results of part (b)
In a survey of 1003 U.S. adults, 451 believe that for a person to be considered truly American, it is very important that he or she share American customs and traditions.Let p be the population proportion for the situation. (a) Find point estimates of p and q, (b) Construct 90% and 95%
In a survey of 1035 U.S. adults, 745 say they want the U.S. to play a leading or major role in global affairs.Let p be the population proportion for the situation. (a) Find point estimates of p and q, (b) Construct 90% and 95% confidence intervals for p, and (c) Interpret the results
You research the heights of top-rated roller coasters and find that the population mean is 160 feet. In Exercise 17, does the t-value fall between -t0.95 and t0.95?Data from Exercise 17:In a random sample of 36 top-rated roller coasters, the average height is 165 feet and the standard deviation is
In a random sample of 36 top-rated roller coasters, the average height is 165 feet and the standard deviation is 67 feet. Construct a 90% confidence interval for μ. Interpret the results.
(a) Find the margin of error for the values of c, s, and n, and(b) Construct the confidence interval for μ using the t-distribution. Assume the population is normally distributed.c = 0.99, s = 16.5, n = 20, x̅ = 25.2
(a) Find the margin of error for the values of c, s, and n, and(b) Construct the confidence interval for μ using the t-distribution. Assume the population is normally distributed.c = 0.98, s = 0.9, n = 12, x̅ = 6.8
(a) Find the margin of error for the values of c, s, and n, and(b) Construct the confidence interval for μ using the t-distribution. Assume the population is normally distributed.c = 0.95, s = 1.1, n = 25, x̅ = 3.5
(a) Find the margin of error for the values of c, s, and n, and(b) Construct the confidence interval for μ using the t-distribution. Assume the population is normally distributed.c = 0.90, s = 25.6, n = 16, x̅ = 72.1
Find the critical value tc for the level of confidence c and sample size n.c = 0.99, n = 30
Showing 1800 - 1900
of 2934
First
12
13
14
15
16
17
18
19
20
21
22
23
24
25
26
Last
Step by Step Answers