New Semester
Started
Get
50% OFF
Study Help!
--h --m --s
Claim Now
Question Answers
Textbooks
Find textbooks, questions and answers
Oops, something went wrong!
Change your search query and then try again
S
Books
FREE
Study Help
Expert Questions
Accounting
General Management
Mathematics
Finance
Organizational Behaviour
Law
Physics
Operating System
Management Leadership
Sociology
Programming
Marketing
Database
Computer Network
Economics
Textbooks Solutions
Accounting
Managerial Accounting
Management Leadership
Cost Accounting
Statistics
Business Law
Corporate Finance
Finance
Economics
Auditing
Tutors
Online Tutors
Find a Tutor
Hire a Tutor
Become a Tutor
AI Tutor
AI Study Planner
NEW
Sell Books
Search
Search
Sign In
Register
study help
mathematics
elementary statistics picturing
Elementary Statistics Picturing The World 7th Edition Ron Larson, Betsy Farber - Solutions
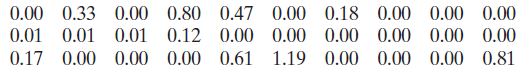
A climatologist claims that the temperature in Seattle, Washington, was lower than in Birmingham, Alabama, in a recent year. The maximum daily temperatures (in degrees Fahrenheit) for 30 days in a recent year in Seattle are shown below. Assume the population standard deviation is 13.6ºF.The
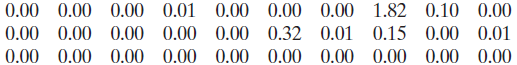
A climatologist claims that the precipitation in Seattle, Washington, was greater than in Birmingham, Alabama, in a recent year. The daily precipitation amounts (in inches) for 30 days in a recent year in Seattle are shown below. Assume the population standard deviation is 0.24 inch.The daily
Refer to Exercise 21. Two more samples are taken, one from Casper and one from Cheyenne. For 50 homes in Casper, x̅1 = $231,581. For 50 homes in Cheyenne, x̅2 = $315,706. Use a = 0.01. Do the new samples lead to a different conclusion?(a) Identify the claim and state H0, and Ha, (b) Find the
A real estate agency says that the mean home sales price in Casper, Wyoming, is the same as in Cheyenne, Wyoming. The mean home sales price for 25 homes in Casper is $294,220. Assume the population standard deviation is $135,387. The mean home sales price for 25 homes in Cheyenne is $287,984.
The mean ACT English score for 120 high school students is 20.1. Assume the population standard deviation is 6.8. The mean ACT reading score for 150 high school students is 21.3. Assume the population standard deviation is 6.5. At α = 0.10, can you support the claim that ACT reading scores are
The mean ACT mathematics score for 60 high school students is 20.6. Assume the population standard deviation is 5.4. The mean ACT science score for 75 high school students is 20.8. Assume the population standard deviation is 5.6. At α = 0.01, can you reject the claim that ACT mathematics and
You want to buy a washing machine, and a salesperson tells you that the mean repair costs for Model A and Model B are equal. You research the repair costs. The mean repair cost of 24 Model A washing machines is $208. Assume the population standard deviation is $18. The mean repair cost of 26 Model
To compare customer satisfaction with holiday gift purchases of digital gear from online and walk-in retailers, a researcher randomly selects 30 customer ratings of online retailers and 31 customer ratings of walk-in retailers. The mean customer rating of online retailers is 90 out of 100. Assume
To compare the dry braking distances from 60 to 0 miles per hour for two makes of automobiles, a safety engineer conducts braking tests for 23 models of Make A and 24 models of Make B. The mean braking distance for Make A is 137 feet. Assume the population standard deviation is 5.5 feet. The mean
Test the claim about the difference between two population means μ1 and μ2 at the level of significance a. Assume the samples are random and independent, and the populations are normally distributed.Claim: μ1 ≤ μ2; α = 0.03Population statistics: σ1 = 136 and σ2 = 215Sample statistics:
Test the claim about the difference between two population means μ1 and μ2 at the level of significance a. Assume the samples are random and independent, and the populations are normally distributed.Claim: μ1 < μ2; α = 0.05Population statistics: σ1 = 75 and σ2 = 105Sample statistics:
Test the claim about the difference between two population means μ1 and μ2 at the level of significance a. Assume the samples are random and independent, and the populations are normally distributed.Claim: μ1 > μ2; α = 0.10Population statistics: σ1 = 40 and σ2 = 15Sample statistics:
Test the claim about the difference between two population means μ1 and μ2 at the level of significance a. Assume the samples are random and independent, and the populations are normally distributed.Claim: μ1 = μ2; α = 0.1Population statistics: σ1 = 3.4 and σ2 = 1.5Sample statistics:
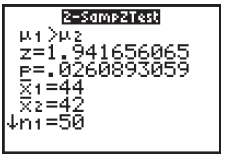
Use the TI-84 Plus display to make a decision to reject or fail to reject the null hypothesis at the level of significance. Make your decision using the standardized test statistic and using the P-value. Assume the sample sizes are equal.α = 0.01 2-Samp2Test z=1.941656065 P=.0260893059 X1=44 X2=42
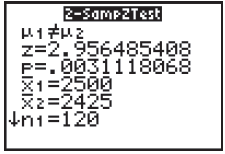
Use the TI-84 Plus display to make a decision to reject or fail to reject the null hypothesis at the level of significance. Make your decision using the standardized test statistic and using the P-value. Assume the sample sizes are equal.α = 0.05 2-SamPZTest z=2.956485408 P=. 0031118068 X1=2500
Sample 1: The commute times of 10 workers when they use their own vehiclesSample 2: The commute times of the same 10 workers when they use public transportationClassify the two samples as independent or dependent and justify your answer.
Sample 1: The average speed of 23 powerboats using an old hull designSample 2: The average speed of 14 powerboats using a new hull designClassify the two samples as independent or dependent and justify your answer.
Sample 1: The IQ scores of 60 femalesSample 2: The IQ scores of 60 malesClassify the two samples as independent or dependent and justify your answer.
Sample 1: The maximum bench press weights for 53 football playersSample 2: The maximum bench press weights for the same 53 football players after completing a weight lifting programClassify the two samples as independent or dependent and justify your answer.
Describe another way you can perform a hypothesis test for the difference between the means of two populations using independent samples with σ1 and σ2 known that does not use rejection regions.
A researcher claims that the mean age of the residents of a small town is more than 38 years. The ages (in years) of a random sample of 30 residents are listed below. At α = 0.10, is there enough evidence to support the researcher’s claim? Assume the population standard deviation is 9 years.For
A nonprofit consumer organization says that the mean price of the vehicles the organization rated in a recent year is at least $41,000. In a random sample of 150 vehicles the organization rated in a recent year, the mean price is $40,600 and the standard deviation is $17,300. At α = 0.01, is there
Use the P-value method to perform the hypothesis test for the indicated exercise.Exercise 26Data from Exercise 26;A school administrator claims that the standard deviation for grade 12 students on a vocabulary assessment test is greater than 45 points. A random sample of 25 grade 12 test scores has
Use the P-value method to perform the hypothesis test for the indicated exercise.Exercise 25Data from Exercise 25:A school administrator claims that the standard deviation for grade 12 students on a mathematics assessment test is less than 35 points. A random sample of 28 grade 12 test scores has a
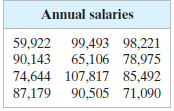
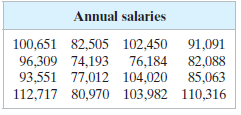
The annual salaries (in dollars) of 12 randomly chosen nursing supervisors are shown in the table at the left. At a = 0.10, is there enough evidence to reject the claim that the standard deviation of the annual salaries is $16,500?(a) Identify the claim and state H0 and Ha, (b) Find the
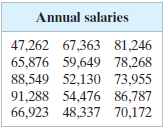
The annual salaries (in dollars) of 15 randomly chosen senior level graphic design specialists are shown in the table at the left. At α = 0.05, is there enough evidence to support the claim that the standard deviation of the annual salaries is different from $10,300?(a) Identify the claim and
A travel analyst claims that the standard deviation of the room rates for two adults at three-star hotels in Denver is at least $68. A random sample of 18 three-star hotels has a standard deviation of $40. At α = 0.01, is there enough evidence to reject the claim?(a) Identify the claim and state
A school administrator claims that the standard deviation for grade 12 students on a vocabulary assessment test is greater than 45 points. A random sample of 25 grade 12 test scores has a standard deviation of 46 points. At α = 0.01, is there enough evidence to support the claim?(a) Identify the
A school administrator claims that the standard deviation for grade 12 students on a mathematics assessment test is less than 35 points. A random sample of 28 grade 12 test scores has a standard deviation of 34 points. At α = 0.10, is there enough evidence to support the claim?(a) Identify the
An auto manufacturer claims that the variance of the gas mileages in a model of hybrid vehicle is 0.16. A random sample of 30 vehicles has a variance of 0.26. At a = 0.05, is there enough evidence to reject the claim?(a) Identify the claim and state H0 and Ha, (b) Find the critical value(s)
Test the claim about the population variance s2 or standard deviation s at the level of significance a. Assume the population is normally distributed.Claim: σ2 < 40; α = 0.01. Sample statistics: s2 = 40.8, n = 12
Test the claim about the population variance s2 or standard deviation s at the level of significance a. Assume the population is normally distributed.Claim: σ2 = 63; α = 0.01. Sample statistics: s2 = 58, n = 29
Test the claim about the population variance s2 or standard deviation s at the level of significance a. Assume the population is normally distributed.Claim: σ2 ≠ 32.8; α = 0.1. Sample statistics: s2 = 40.9, n = 101
Test the claim about the population variance s2 or standard deviation s at the level of significance a. Assume the population is normally distributed.Claim: σ2 > 19; α = 0.1. Sample statistics: s2 = 28, n = 17
Test the claim about the population variance s2 or standard deviation s at the level of significance a. Assume the population is normally distributed.Claim: σ2 ≤ 17.6; α = 0.01. Sample statistics: s2 = 28.33, n = 41
Find the critical value(s) and rejection region(s) for the type of chi-square test with sample size n and level of significance α.Two-tailed test,n = 31, α = 0.05
Find the critical value(s) and rejection region(s) for the type of chi-square test with sample size n and level of significance α.Right-tailed test,n = 30, α = 0.01
Find the critical value(s) and rejection region(s) for the type of chi-square test with sample size n and level of significance α.Two-tailed test,n = 61, α = 0.01
Find the critical value(s) and rejection region(s) for the type of chi-square test with sample size n and level of significance α.Two-tailed test,n = 81, α = 0.10
Find the critical value(s) and rejection region(s) for the type of chi-square test with sample size n and level of significance α.Left-tailed test,n = 24, α = 0.05
Find the critical value(s) and rejection region(s) for the type of chi-square test with sample size n and level of significance α.Left-tailed test,n = 7, α = 0.01
Find the critical value(s) and rejection region(s) for the type of chi-square test with sample size n and level of significance α.Right-tailed test,n = 10, α = 0.10
Find the critical value(s) and rejection region(s) for the type of chi-square test with sample size n and level of significance α.Right-tailed test,n = 27, α = 0.05
Can a critical value for the chi-square test be negative? Explain.
Rework Exercise 7 using the alternative formula and verify that the results are the same.Data from Exercise 7:A medical researcher says that less than 80% of U.S. adults think that healthy children should be required to be vaccinated. In a random sample of 200 U.S. adults, 82% think that healthy
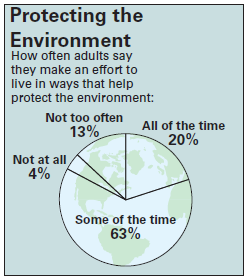
You interview a random sample of 100 adults. The results of the survey show that 59% of the adults said they live in ways that help protect the environment some of the time. At α = 0.05, can you reject the claim that at least 63% of adults make an effort to live in ways that help protect the
A humane society claims that 5% of U.S. households have taken in a stray dog. In a random sample of 200 U.S. households, 12 say they have taken in a stray dog. At α = 0.05, is there enough evidence to reject the society’s claim?(a) Identify the claim and state H0 and Ha, (b) Use technology
A humane society claims that less than 67% of U.S. households own a pet. In a random sample of 600 U.S. households, 390 say they own a pet. At α = 0.10, is there enough evidence to support the society’s claim?(a) Identify the claim and state H0 and Ha, (b) Use technology to find the
A research center claims that at most 18% of U.S. adults’ online food purchases are for snacks. In a random sample of 1995 U.S. adults, 20% say their online food purchases are for snacks. At α = 0.10, is there enough evidence to support the center’s claim?(a) Identify the claim and state H0
A research center claims that 27% of U.S. adults would travel into space on a commercial flight if they could afford it. In a random sample of 1000 U.S. adults, 30% say that they would travel into space on a commercial flight if they could afford it. At α = 0.05, is there enough evidence to reject
A research center claims that more than 29% of U.S. employees have changed jobs in the past three years. In a random sample of 180 U.S. employees, 63 have changed jobs in the past three years. At α = 0.10, is there enough evidence to support the center’s claim?(a) Identify the claim and state H0
An education researcher claims that 57% of college students work year-round. In a random sample of 300 college students, 171 say they work year-round. At α = 0.10, is there enough evidence to support the researcher’s claim?(a) Identify the claim and state H0 and Ha, (b) Find the critical
A researcher claims that 85% percent of Americans think they are unlikely to contract the Zika virus. In a random sample of 250 Americans, 225 think they are unlikely to contract the Zika virus. At α = 0.05, is there enough evidence to reject the researcher’s claim?(a) Identify the claim and
An education researcher claims that at most 3% of working college students are employed as teachers or teaching assistants. In a random sample of 200 working college students, 4% are employed as teachers or teaching assistants. At α = 0.01, is there enough evidence to reject the researcher’s
A research center claims that at least 27% of U.S. adults think that the IRS will audit their taxes. In a random sample of 1000 U.S. adults in a recent year, 23% say they are concerned that the IRS will audit their taxes. At α = 0.01, is there enough evidence to reject the center’s claim?(a)
A medical researcher says that less than 80% of U.S. adults think that healthy children should be required to be vaccinated. In a random sample of 200 U.S. adults, 82% think that healthy children should be required to be vaccinated. At α = 0.05, is there enough evidence to support the
Determine whether a normal sampling distribution can be used. If it can be used, test the claim.Claim: p > 0.70; α = 0.04. Sample statistics: p̂ = 0.64, n = 225
Determine whether a normal sampling distribution can be used. If it can be used, test the claim.Claim: p ≠ 0.15; α = 0.05. Sample statistics: p̂ = 0.12, n = 500
Determine whether a normal sampling distribution can be used. If it can be used, test the claim.Claim: p ≥ 0.48; α = 0.08. Sample statistics: p̂ = 0.40, n = 90
Determine whether a normal sampling distribution can be used. If it can be used, test the claim.Claim: p < 0.12; α = 0.01. Sample statistics: p̂ = 0.10, n = 40
Explain how to test a population proportion p.
Explain how to determine whether a normal distribution can be used to approximate a binomial distribution.
An oceanographer claims that the mean dive duration of a North Atlantic right whale is 11.5 minutes. A random sample of 34 dive durations has a mean of 12.2 minutes and a standard deviation of 2.2 minutes. Is there enough evidence to reject the claim at α = 0.10?(a) Identify the claim and state H0
A consumer group claims that the mean minimum time it takes for a sedan to travel a quarter mile is greater than 14.7 seconds. A random sample of 22 sedans has a mean minimum time to travel a quarter mile of 15.4 seconds and a standard deviation of 2.10 seconds. At α = 0.10, do you have enough
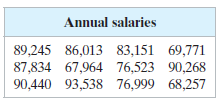
An employment information service claims the mean annual salary for home care physical therapists is more than $80,000. The annual salaries (in dollars) for a random sample of 12 home care physical therapists are shown in the table at the left. At α = 0.10, is there enough evidence to support the
An employment information service claims the mean annual salary for senior level product engineers is $98,000. The annual salaries (in dollars) for a random sample of 16 senior level product engineers are shown in the table at the left. At a = 0.05, test the claim that the mean salary is
As part of your work for an environmental awareness group, you want to test a claim that the mean amount of lead in the air in U.S. cities is less than 0.036 microgram per cubic meter. You find that the mean amount of lead in the air for a random sample of 56 U.S. cities is 0.039 microgram per
As part of your work for an environmental awareness group, you want to test a claim that the mean amount of carbon monoxide in the air in U.S. cities is less than 2.34 parts per million. You find that the mean amount of carbon monoxide in the air for a random sample of 64 U.S. cities is 2.37 parts
A credit reporting agency claims that the mean credit card debt by state is greater than $5500 per person. You want to test this claim. You find that a random sample of 30 states has a mean credit card debt of $5594 per person and a standard deviation of $597 per person. At α = 0.05, can you
A state Department of Transportation claims that the mean wait time for various services at its different locations is at most 6 minutes. A random sample of 34 services at different locations has a mean wait time of 10.3 minutes and a standard deviation of 8.0 minutes. Is there enough evidence to
Test the claim about the population mean μ at the level of significance α. Assume the population is normally distributed.Claim: μ ≠ 52,200; α = 0.05. Sample statistics: x̅ = 53,220, s = 2700, n = 34
Test the claim about the population mean μ at the level of significance α. Assume the population is normally distributed.Claim: μ < 4915; α = 0.02. Sample statistics: x̅ = 5017, s = 5613, n = 51
Test the claim about the population mean μ at the level of significance α. Assume the population is normally distributed.Claim: μ ≤ 1600; α = 0.02. Sample statistics: x̅ = 1550, s = 165, n = 46
Test the claim about the population mean μ at the level of significance α. Assume the population is normally distributed.Claim: μ ≥ 8000; α = 0.01. Sample statistics: x̅ = 7700, s = 450, n = 25
Test the claim about the population mean μ at the level of significance α. Assume the population is normally distributed.Claim: μ = 25; α = 0.05. Sample statistics: x̅ = 26.2, s = 2.32, n = 17
Test the claim about the population mean μ at the level of significance α. Assume the population is normally distributed.Claim: μ = 15; α = 0.01. Sample statistics: x̅ = 13.9, s = 3.23, n = 36
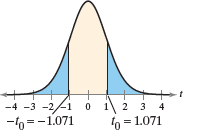
State whether each standardized test statistic t allows you to reject the null hypothesis. Explain.(a) t = -1.1(b) t = 1.01c) t = 1.7 -4 -3 -2-1 0 -0 =-1.071 1 2 3 4 6 = 1.071
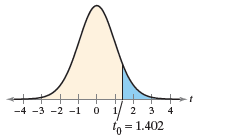
State whether each standardized test statistic t allows you to reject the null hypothesis. Explain.(a) t = 1.4(b) t = 1.42(c) t = -1.402 3 4 o = 1.402 2 3 -4 -3 -2 -1 1.
Find the critical value(s) and rejection region(s) for the type of t-test with level of significance a and sample size n.Two-tailed test, α = 0.10, n = 38
Find the critical value(s) and rejection region(s) for the type of t-test with level of significance a and sample size n.Two-tailed test, α = 0.05, n = 27
Find the critical value(s) and rejection region(s) for the type of t-test with level of significance a and sample size n.Right-tailed test, α = 0.01, n = 31
Find the critical value(s) and rejection region(s) for the type of t-test with level of significance a and sample size n.Right-tailed test, α = 0.05, n = 23
Find the critical value(s) and rejection region(s) for the type of t-test with level of significance a and sample size n.Left-tailed test, α = 0.01, n = 35
Find the critical value(s) and rejection region(s) for the type of t-test with level of significance a and sample size n.Left-tailed test, α = 0.10, n = 20
In a right-tailed test where P < α, does the standardized test statistic lie to the left or the right of the critical value? Explain your reasoning.
When P > α, does the standardized test statistic lie inside or outside of the rejection region(s)? Explain your reasoning.
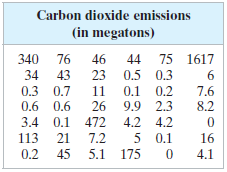
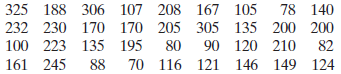
A scientist estimates that the mean carbon dioxide emissions per country in a recent year are greater than 150 megatons. You want to test this estimate. To do so, you determine the carbon dioxide emissions for 42 randomly selected countries for that year. The results (in megatons) are shown in the
An education researcher claims that the mean high school graduation rate per state in the United States is 80%. You want to test this claim. You find that a random sample of 30 states has a mean high school graduation rate of 82%. Assume the population standard deviation is 5.1%. At α = 0.05, do
A consumer research organization states that the mean caffeine content per 12-ounce bottle of a population of caffeinated soft drinks is 37.7 milligrams. You want to test this claim. During your tests, you find that a random sample of thirty-six 12-ounce bottles of caffeinated soft drinks has a
An analyst claims that the mean annual salary for intermediate level architects in Wichita, Kansas, is more than the national mean, $52,000. The annual salaries (in dollars) for a random sample of 21 intermediate level architects in Wichita are listed. Assume the population is normally distributed
The heights (in feet) of 36 randomly selected top-rated roller coasters are listed. Assume the population standard deviation is 71.6 feet. At α = 0.05, is there enough evidence to reject the claim that the mean height of top-rated roller coasters is 160 feet?(a) Identify the claim and state H0 and
A consumer group claims that the mean acceleration time from 0 to 60 miles per hour for a sedan is 6.3 seconds. A random sample of 33 sedans has a mean acceleration time from 0 to 60 miles per hour of 7.2 seconds. Assume the population standard deviation is 2.5 seconds. At α = 0.05, can you reject
When estimating the population mean, why not construct a 99% confidence interval every time?
A tennis ball manufacturer wants to estimate the mean circumference of tennis balls within 0.05 inch. Assume the population of circumferences is normally distributed. (a) Determine the minimum sample size required to construct a 99% confidence interval for the population mean. Assume the
A soccer ball manufacturer wants to estimate the mean circumference of soccer balls within 0.15 inch.(a) Determine the minimum sample size required to construct a 99% confidence interval for the population mean. Assume the population standard deviation is 0.5 inch.(b) The sample mean is 27.5
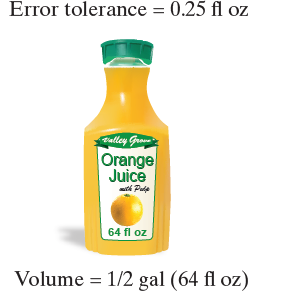
A beverage company uses a machine to fill half-gallon bottles with fruit juice (see figure). The company wants to estimate the mean volume of water the machine is putting in the bottles within 0.25 fluid ounce.(a) Determine the minimum sample size required to construct a 95% confidence interval for
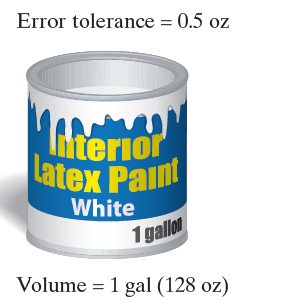
A paint manufacturer uses a machine to fill gallon cans with paint (see figure). The manufacturer wants to estimate the mean volume of paint the machine is putting in the cans within 0.5 ounce. Assume the population of volumes is normally distributed.(a) Determine the minimum sample size required
An admissions director wants to estimate the mean age of all students enrolled at a college. The estimate must be within 1.5 years of the population mean. Assume the population of ages is normally distributed.(a) Determine the minimum sample size required to construct a 90% confidence interval for
A cheese processing company wants to estimate the mean cholesterol content of all one-ounce servings of a type of cheese. The estimate must be within 0.75 milligram of the population mean.(a) Determine the minimum sample size required to construct a 95% confidence interval for the population mean.
Determine the minimum sample size required when you want to be 99% confident that the sample mean is within two units of the population mean and σ = 1.4. Assume the population is normally distributed.
Showing 1700 - 1800
of 2934
First
11
12
13
14
15
16
17
18
19
20
21
22
23
24
25
Last
Step by Step Answers