New Semester
Started
Get
50% OFF
Study Help!
--h --m --s
Claim Now
Question Answers
Textbooks
Find textbooks, questions and answers
Oops, something went wrong!
Change your search query and then try again
S
Books
FREE
Study Help
Expert Questions
Accounting
General Management
Mathematics
Finance
Organizational Behaviour
Law
Physics
Operating System
Management Leadership
Sociology
Programming
Marketing
Database
Computer Network
Economics
Textbooks Solutions
Accounting
Managerial Accounting
Management Leadership
Cost Accounting
Statistics
Business Law
Corporate Finance
Finance
Economics
Auditing
Tutors
Online Tutors
Find a Tutor
Hire a Tutor
Become a Tutor
AI Tutor
AI Study Planner
NEW
Sell Books
Search
Search
Sign In
Register
study help
mathematics
elementary statistics picturing
Elementary Statistics 11th Edition Mario F. Triola - Solutions
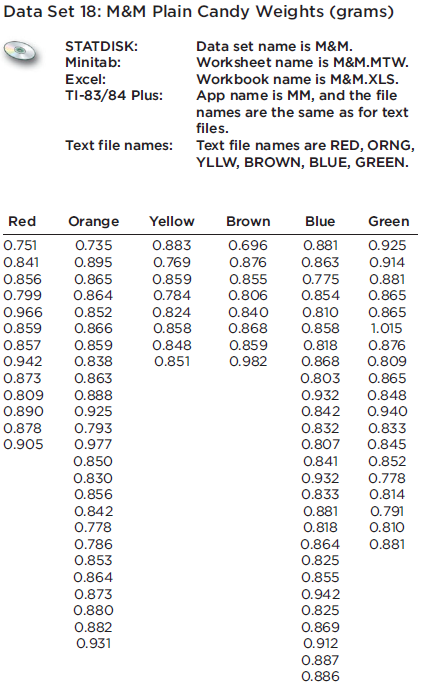
M&M plain candies have a mean weight of 0.8565 g and a standard deviation of 0.0518 g (based on Data Set 18 in Appendix B). The M&M candies used in Data Set 18 came from a package containing 465 candies, and the package label stated that the net weight is 396.9 g. (If every package has 465
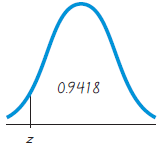
Find the indicated z score. The graph depicts the standard normal distribution with mean 0 and standard deviation 1. 0.9418
With n = 15 and p = 0.4, find P (fewer than 3).Do the following: (a) Find the indicated binomial probability by using Table A-1 in Appendix A. (b) If np ≥ 5 and nq ≥ 5, also estimate the indicated probability by using the normal distribution as an approximation to the binomial distribution; if
Repeat Exercise 13 using variances instead of means.The ages (years) of the four U.S. presidents when they were assassinated in office are 56 (Lincoln), 49 (Garfield), 58 (McKinley), and 46 (Kennedy).a. Assuming that 2 of the ages are randomly selected with replacement, list the 16 different
When women were allowed to become pilots of fighter jets, engineers needed to redesign the ejection seats because they had been originally designed for men only. The ACES-II ejection seats were designed for men weighing between 140 lb and 211 lb. The weights of women are normally distributed with a
Using the heights of women and the cholesterol levels of women, as listed in Data Set 1 in Appendix B, analyze each of the two data sets and determine whether each appears to come from a normally distributed population. Compare the results and give a possible explanation for any notable differences
Between - 4.50Assume that thermometer readings are normally distributed with a mean of 0°C and a standard deviation of 1.00°C. A thermometer is randomly selected and tested. In each case, draw a sketch, and find the probability of each reading. (The given values are in Celsius degrees.) If using
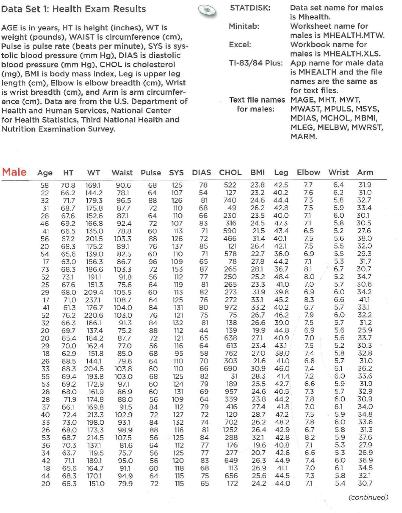
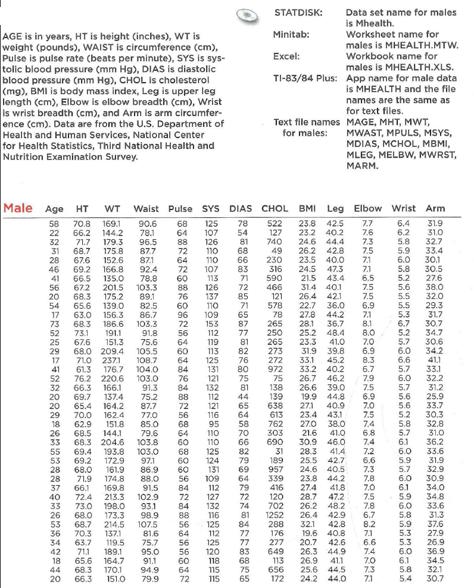
Refer to Data Set 1 in Appendix B and use the systolic blood pressure levels for males.a. Using the systolic blood pressure levels for males, find the mean and standard deviation, and verify that the data have a distribution that is roughly normal.b. Assuming that systolic blood pressure levels of
Assume that thermometer readings are normally distributed with a mean of 0°C and a standard deviation of 1.00°C. A thermometer is randomly selected and tested. In each case, draw a sketch, and find the probability of each reading. (The given values are in Celsius degrees.) If using technology
Refer to Data Set 10 in Appendix B and use the durations (hours) of the NASA shuttle flights.a. Find the mean and standard deviation, and verify that the data have a distribution that is roughly normal.b. Treat the statistics from part (a) as if they are population parameters and assume a normal
The distribution of IQ scores is a nonstandard normal distribution with a mean of 100 and a standard deviation of 15. What are the values of the mean and standard deviation after all IQ scores have been standardized by converting them to z scores using z = (x - μ)/σ?
Assume that thermometer readings are normally distributed with a mean of 0°C and a standard deviation of 1.00°C. A thermometer is randomly selected and tested. In each case, draw a sketch, and find the probability of each reading. (The given values are in Celsius degrees.) If using technology
Heights of women are normally distributed.a. If heights of individual women are expressed in units of centimeters, what are the units used for the z scores that correspond to individual heights?b. If heights of all women are converted to z scores, what are the mean, standard deviation, and
You want to estimate the proportion of all U.S. college students who have the profound wisdom to take a statistics course. You obtain a simple random sample of students at New York University. Is the resulting sample proportion a good estimator of the population proportion? Why or why not?
There are many situations in which a normal distribution can be used as a good approximation to a random variable that has only discrete values. In such cases, we can use this continuity correction: Represent each whole number by the interval extending from 0.5 below the number to 0.5 above it.
What does it mean when we say that the sample mean is an unbiased estimator, or that the sample mean “targets” the population mean?
Data Set 24 in Appendix B includes a sample of FICO credit rating scores from randomly selected consumers. If we investigate this sample by constructing a histogram and finding the sample mean and standard deviation, are we investigating the sampling distribution of the mean? Why or why not?
In your own words describe a sampling distribution.
A statistics professor gives a test and finds that the scores are normally distributed with a mean of 25 and a standard deviation of 5. She plans to curve the scores.a. If she curves by adding 50 to each grade, what is the new mean? What is the new standard deviation?b. Is it fair to curve by
Scores on the SAT test are normally distributed with a mean of 1518 and a standard deviation of 325. Scores on the ACT test are normally distributed with a mean of 21.1 and a standard deviation of 4.8. Assume that the two tests use different scales to measure the same aptitude.a. If someone gets a
Find the indicated value.z0.10
The distribution of IQ scores is a nonstandard normal distribution with a mean of 100 and a standard deviation of 15, and a bell-shaped graph is drawn to represent this distribution.a. What is the area under the curve?b. What is the value of the median?c. What is the value of the mode?
Find the indicated value.z0.02
Assume that the readings on the thermometers are normally distributed with a mean of 0°C and a standard deviation of 1.00°. Find the indicated probability, where z is the reading in degrees.P(-1.96 < z < 1.96)
Assume that the readings on the thermometers are normally distributed with a mean of 0°C and a standard deviation of 1.00°. Find the indicated probability, where z is the reading in degrees.P(z < 1.645)
Assume that the readings on the thermometers are normally distributed with a mean of 0°C and a standard deviation of 1.00°. Find the indicated probability, where z is the reading in degrees.P (z < -2.575 or z > 2.575)
Assume that the readings on the thermometers are normally distributed with a mean of 0°C and a standard deviation of 1.00°. Find the indicated probability, where z is the reading in degrees.P(z < -1.96 or z > 1.96)
Find P95, the 95th percentile. This is the temperature reading separating the bottom 95% from the top 5%.
Find P1, the 1st percentile. This is the temperature reading separating the bottom 1% from the top 99%.
If 0.5% of the thermometers are rejected because they have readings that are too low and another 0.5% are rejected because they have readings that are too high, find the two readings that are cutoff values separating the rejected thermometers from the others.
For a standard normal distribution, find the percentage of data that area. within 2 standard deviations of the mean.b. more than 1 standard deviation away from the mean.c. more than 1.96 standard deviations away from the mean.d. between μ-3σ and μ + 3σe. more than 3 standard deviations away
If a continuous uniform distribution has parameters of μ = 0 and σ = 1, then the minimum is - √3 and the maximum is √3a. For this distribution, find P(-1 < x < 1).b. Find P(-1 < x < 1) if you incorrectly assume that the distribution is normal instead of uniform.c. Compare the
Assume that z scores are normally distributed with a mean of 0 and a standard deviation of 1.a. If P(z < a) = 0.9599, find a.b. If P(z > b) = 0.9772, find b.c. If P(z > c) = 0.0668, find c.d. If P(-d < z< d) = 0.5878, find d.e. If P(- e < z < e) = 0.0956, find e.
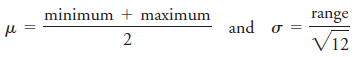
In a continuous uniform distribution, Find the mean and standard deviation for the uniform distribution represented in Figure 6-2. minimum + maximum range and o = 2 V12
Find the indicated value.z0.01
Find the indicated value.z0.05
Less than 0Assume that thermometer readings are normally distributed with a mean of 0°C and a standard deviation of 1.00°C. A thermometer is randomly selected and tested. In each case, draw a sketch, and find the probability of each reading. (The given values are in Celsius degrees.) If using
Greater than 0Assume that thermometer readings are normally distributed with a mean of 0°C and a standard deviation of 1.00°C. A thermometer is randomly selected and tested. In each case, draw a sketch, and find the probability of each reading. (The given values are in Celsius degrees.) If using
Between - 2.50 and 5.00Assume that thermometer readings are normally distributed with a mean of 0°C and a standard deviation of 1.00°C. A thermometer is randomly selected and tested. In each case, draw a sketch, and find the probability of each reading. (The given values are in Celsius degrees.)
Between 0.50 and 1.00Assume that thermometer readings are normally distributed with a mean of 0°C and a standard deviation of 1.00°C. A thermometer is randomly selected and tested. In each case, draw a sketch, and find the probability of each reading. (The given values are in Celsius degrees.) If
Assume that you have a data set consisting of the ages of all New York City police officers. Examination of a histogram and normal quantile plot are two different ways to assess the normality of that data set. Identify a third way.
If you select a simple random sample of M&M plain candies and construct a normal quantile plot of their weights, what pattern would you expect in the graph?
Identify two different characteristics of a normal quantile plot, where each characteristic would lead to the conclusion that the data are not from a normally distributed population.
What is the purpose of constructing a normal quantile plot?
This section included the statement that almost all practical applications of the binomial probability distribution can now be handled well with computer software or a TI-83/84 Plus calculator. Using specific computer software or a TI-83/84 Plus calculator, identify a case in which the technology
An American Airlines Boeing 767-300 aircraft has 213 seats. When fully loaded with passengers, baggage, cargo, and fuel, the pilot must verify that the gross weight is below the maximum allowable limit, and the weight must be properly distributed so that the balance of the aircraft is within safe
Polygraph experiments conducted by researchers Charles R. Honts (Boise State University) and Gordon H. Barland (Department of Defense Polygraph Institute) showed that among 57 polygraph indications of a lie, the truth was told 15 times, so the proportion of false positive results among the 57
The probability of flu symptoms for a person not receiving any treatment is 0.019. In a clinical trial of Lipitor (atorvastatin), a drug commonly used to lower cholesterol, 863 patients were given a treatment of 10-mg atorvastatin tablets, and 19 of those patients experienced flu symptoms (based on
Six percent of typical people have blood that is group O and type Rh-. These people are considered to be universal donors, because they can give blood to anyone. Providence Memorial Hospital is conducting a blood drive because it needs blood from at least 10 universal donors. If 200 volunteers
The U.S. Marine Corps requires that men have heights between 64 in. and 80 in.a. Find the percentage of men who meet the height requirements. Are many men denied the opportunity to become a Marine because they do not satisfy the height requirements?b. If the height requirements are changed so that
Between 1.00 and 3.00Assume that thermometer readings are normally distributed with a mean of 0°C and a standard deviation of 1.00°C. A thermometer is randomly selected and tested. In each case, draw a sketch, and find the probability of each reading. (The given values are in Celsius degrees.) If
With the procedure called acceptance sampling, a sample of items is randomly selected and the entire batch is either rejected or accepted, depending on the results. The Telektronics Company has just manufactured a large batch of backup power supply units for computers, and 7.5% of them are
A common design requirement is that an item (such as an aircraft or theater seat) must fit the range of people who fall between the 5th percentile for women and the 95th percentile for men. If this requirement is adopted, what is the minimum sitting distance and what is the maximum sitting
Birth weights in Norway are normally distributed with a mean of 3570 g and a standard deviation of 500 g.a. If the Ulleval University Hospital in Oslo requires special treatment for newborn babies weighing less than 2700 g, what is the percentage of newborn babies requiring special treatment?b. If
Between - 2.87 and 1.34Assume that thermometer readings are normally distributed with a mean of 0°C and a standard deviation of 1.00°C. A thermometer is randomly selected and tested. In each case, draw a sketch, and find the probability of each reading. (The given values are in Celsius degrees.)
Between -1.20 and 1.95Assume that thermometer readings are normally distributed with a mean of 0°C and a standard deviation of 1.00°C. A thermometer is randomly selected and tested. In each case, draw a sketch, and find the probability of each reading. (The given values are in Celsius degrees.)
Between - 3.00 andAssume that thermometer readings are normally distributed with a mean of 0°C and a standard deviation of 1.00°C. A thermometer is randomly selected and tested. In each case, draw a sketch, and find the probability of each reading. (The given values are in Celsius degrees.) If
According to Mars (the candy company, not the planet), 24% of M&M plain candies are blue. Data Set 18 in Appendix B shows that among 100 M&Ms chosen, 27 are blue. Assuming that the claimed blue M&Ms rate of 24% is correct, find the probability of randomly selecting 100 M&Ms and
Between - 1.00 and - 0.50Assume that thermometer readings are normally distributed with a mean of 0°C and a standard deviation of 1.00°C. A thermometer is randomly selected and tested. In each case, draw a sketch, and find the probability of each reading. (The given values are in Celsius
When working for the Brooklyn District Attorney, investigator Robert Burton analyzed the leading digits of amounts on checks from companies that were suspected of fraud. Among 784 checks, 479 had amounts with leading digits of 5, but checks issued in the normal course of honest transactions were
Based on recent results, the probability of someone in the United States being injured while using sports or recreation equipment is 1/500 (based on data from Statistical Abstract of the United States). What does it mean when we say that the probability is 1/500? Is such an injury unusual?
Listed below are samples of weights (ounces) of steaks listed on a restaurant menu as ?20-ounce Porterhouse? steaks (based on data collected by a student of the author). The weights are supposed to be 21 oz because the steaks supposedly lose an ounce when cooked. a. Find the mean weight. b. Find
Researchers conducted a study of helmet use and head injuries among skiers and snowboarders. Results of the study included a “P-Value” (probability value) of 0.004 (based on data from “Helmet Use and Risk of Head Injuries in Alpine Skiers and Snowboarders,” by Sullheim, et al., Journal of
What is the basic difference between a situation requiring application of the permutations rule and one that requires the combinations rule?
When two dice are rolled, the total is between 2 and 12 inclusive. A student simulates the rolling of two dice by randomly generating numbers between 2 and 12. Does this simulation behave in a way that is similar to actual dice? Why or why not?
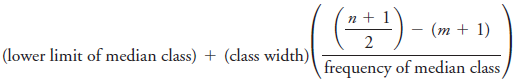
When data are summarized in a frequency distribution, the median can be found by first identifying the median class (the class that contains the median). We then assume that the values in that class are evenly distributed and we can interpolate. Letting n denote the sum of all class frequencies,
The geometric mean is often used in business and economics for finding average rates of change, average rates of growth, or average ratios. Given n values (all of which are positive), the geometric mean is the nth root of their product. The average growth factor for money compounded at annual
For a given data set, there are nine deciles, denoted by D1, D2, ???, D9, which separate the sorted data into 10 groups, with about 10% of the values in each group. There are also four quintiles, which divide the sorted data into 5 groups, with about 20% of the values in each group. (Note the
Let a population consist of the values of 1, 3, and 14. (These are the same values used in Example 1, and they are the numbers of military intelligence satellites owned by India, Japan, and Russia.) Show that when samples of size 2 are randomly selected with replacement, the samples have mean
The harmonic mean is often used as a measure of center for data sets consisting of rates of change, such as speeds. It is found by dividing the number of values n by the sum of the reciprocals of all values, expressed as (No value can be zero.) The author drove 1163 miles to a conference in
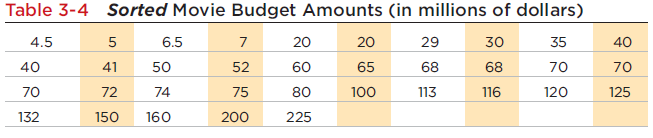
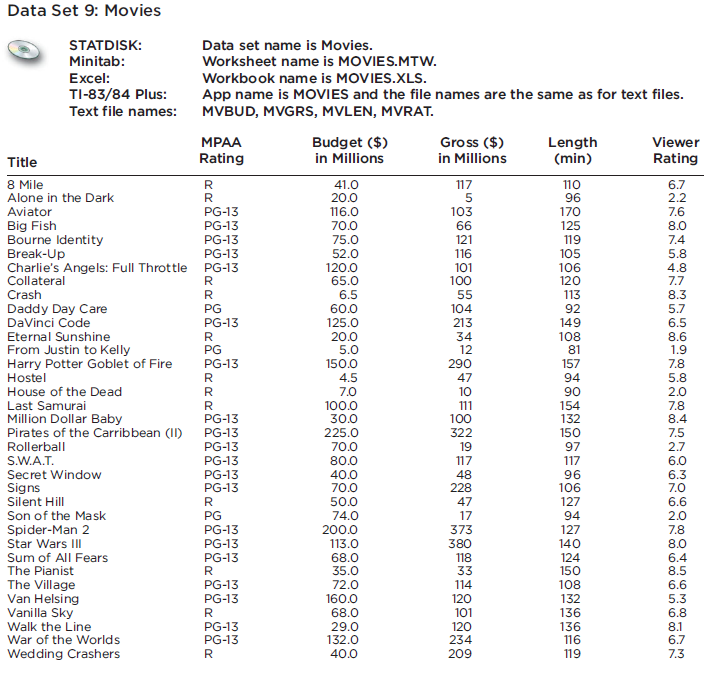
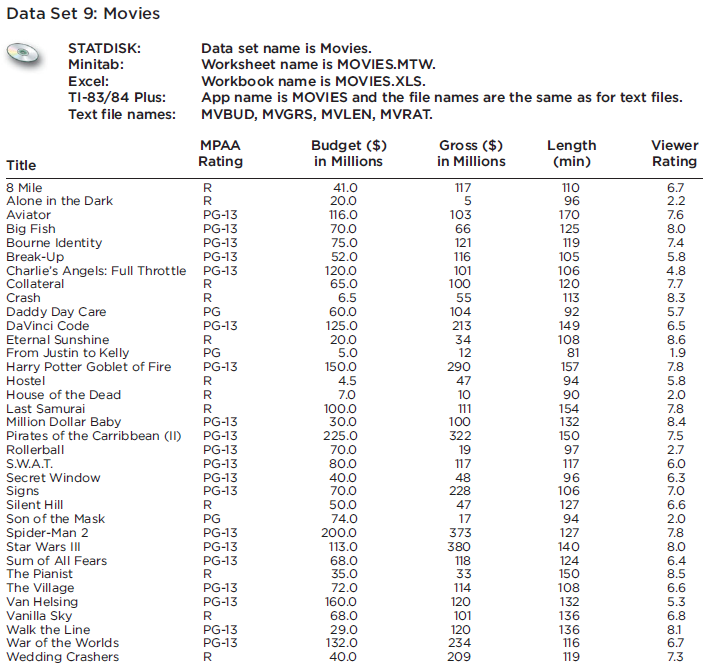
Use the gross amounts from movies from Data Set 9 in Appendix B. Construct a modified boxplot. Identify any outliers as defined in Part 2 of this section. Data Set 9: Movies STATDISK: Data set name is Movies. Minitab: Worksheet name is MOVIES.MTW. Excel: Workbook name is MOVIES.XLS. TI-83/84 Plus:
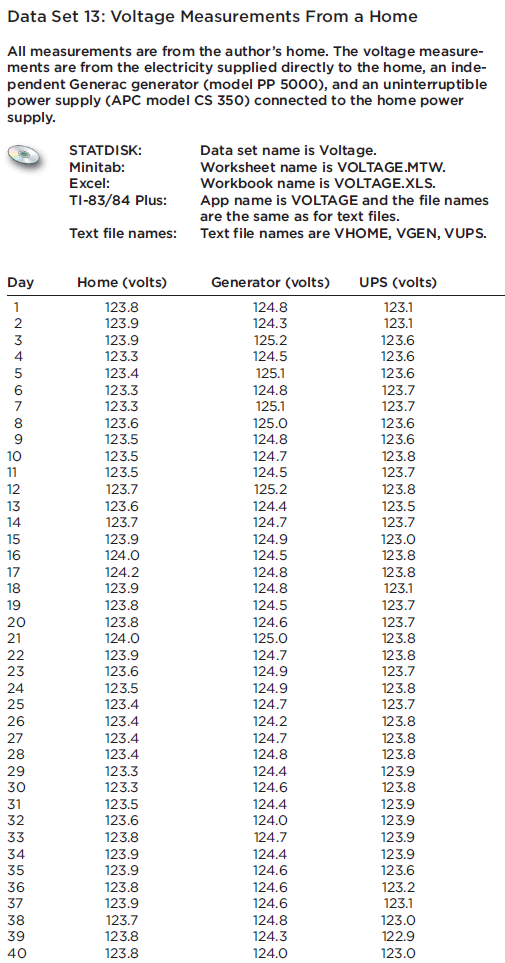
The author’s Generac generator produces voltage amounts with a mean of 125.0 volts and a standard deviation of 0.3 volt. Using Chebyshev’s theorem, what do we know about the percentage of voltage amounts that are within 3 standard deviations of the mean? What are the minimum and maximum voltage
As of this writing, there have been 42 different presidents of the United States, and four of them are alive. Listed below are the numbers of years that they lived after their first inauguration, and the four values with the plus signs represent the four presidents who are still alive. (These
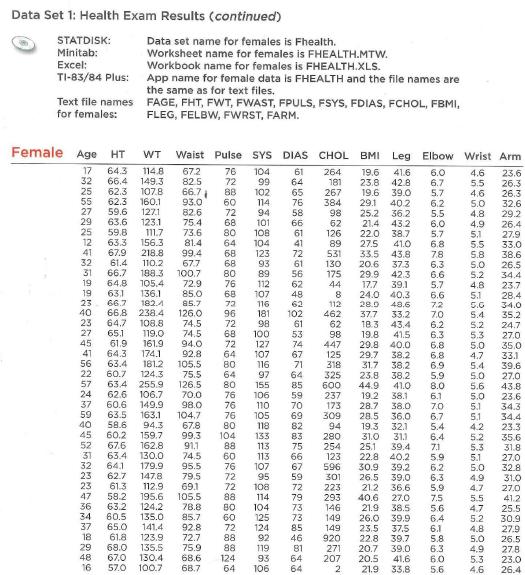
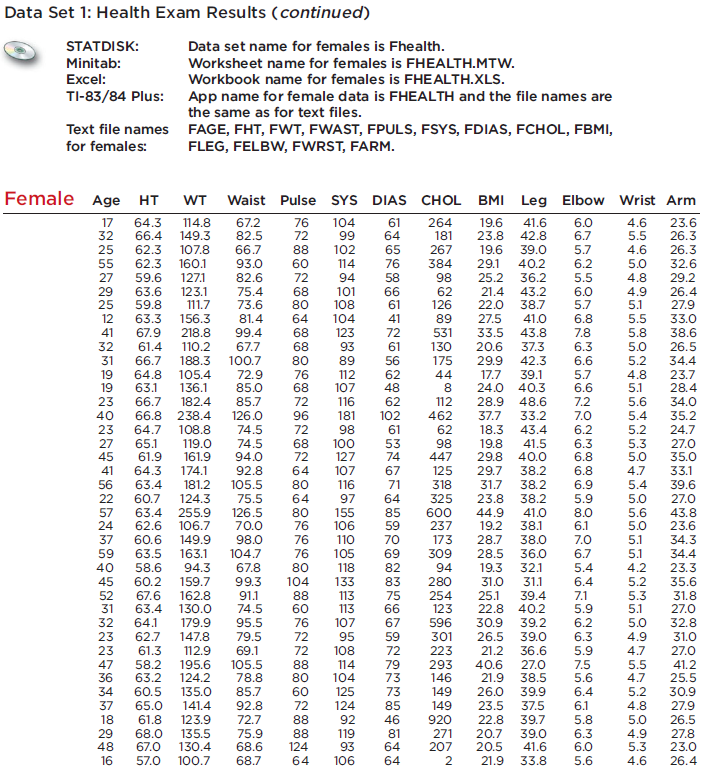
Use the 40 upper leg lengths (cm) listed for females from Data Set 1 in Appendix B. Construct a modified boxplot. Identify any outliers as defined in Part 2 of this section. Data Set 1: Health Exam Results (continued) STATDISK: Data set name for females is Fhealth. Minitab: Worksheet name for
Heights of women have a bell-shaped distribution with a mean of 161 cm and a standard deviation of 7 cm. Using Chebyshev’s theorem, what do we know about the percentage of women with heights that are within 2 standard deviations of the mean? What are the minimum and maximum heights that are
A secondary standard mass is periodically measured and compared to the standard for one kilogram (or 1000 grams). Listed below is a sample of measured masses (in micrograms) that the secondary standard is below the true mass of 1000 grams. One of the sample values is missing and is not shown below.
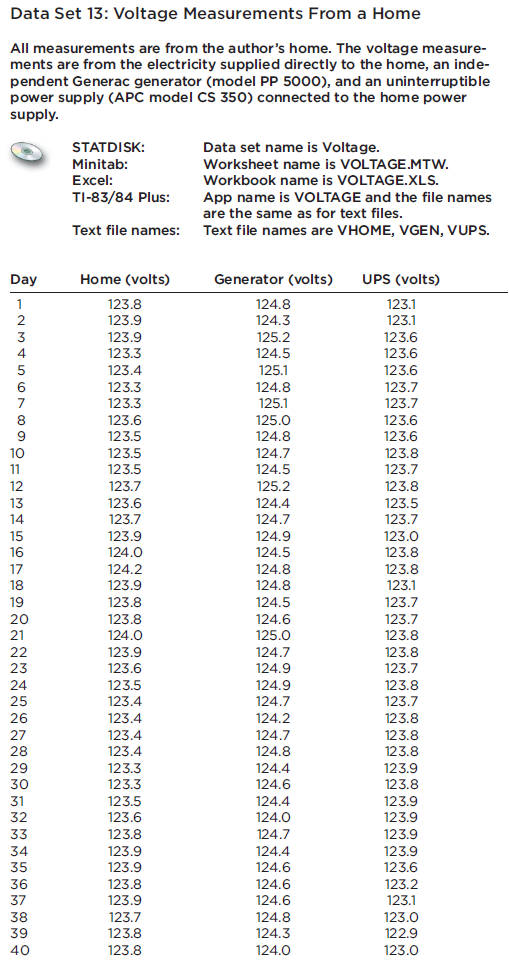
Use the same scale to construct boxplots for the home voltage amounts and the generator voltage amounts from Data Set 13 in Appendix B. Use the boxplots to compare the two data sets. Data Set 13: Voltage Measurements From a Home All measurements are from the author's home. The voltage measure-
The author’s Generac generator produces voltage amounts with a mean of 125.0 volts and a standard deviation of 0.3 volt, and the voltages have a bell-shaped distribution. Using the empirical rule, what is the approximate percentage of voltage amounts betweena. 124.4 volts and 125.6 volts?b. 124.1
A student of the author earned grades of 92, 83, 77, 84, and 82 on her five regular tests. She earned grades of 88 on the final exam and 95 on her class projects. Her combined homework grade was 77. The five regular tests count for 60% of the final grade, the final exam counts for 10%, the project
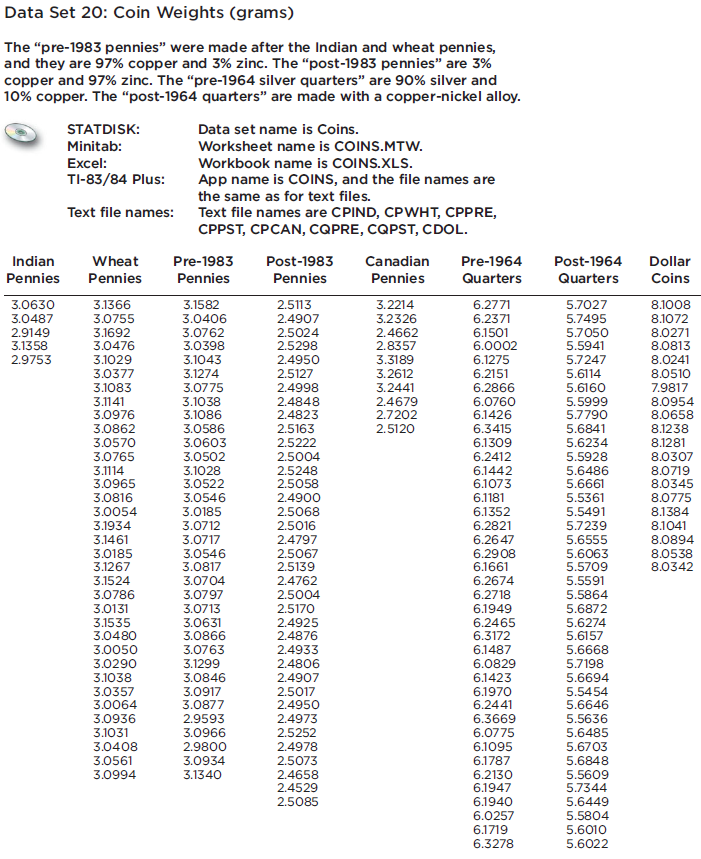
Use the same scale to construct boxplots for the weights of the pre-1964 silver quarters and the post-1964 quarters from Data Set 20 in Appendix B. Use the boxplots to compare the two data sets. Data Set 20: Coin Weights (grams) The "pre-1983 pennies" were made after the Indian and wheat pennies,
Heights of women have a bell-shaped distribution with a mean of 161 cm and a standard deviation of 7 cm. Using the empirical rule, what is the approximate percentage of women betweena. 154 cm and 168 cm?b. 147 cm and 175 cm?
A student of the author earned grades of B, C, B, A, and D. Those courses had these corresponding numbers of credit hours: 3, 3, 4, 4, and 1. The grading system assigns quality points to letter grades as follows: A = 4; B = 3; C = 2; D = 1; F = 0. Compute the grade point average (GPA) and round the
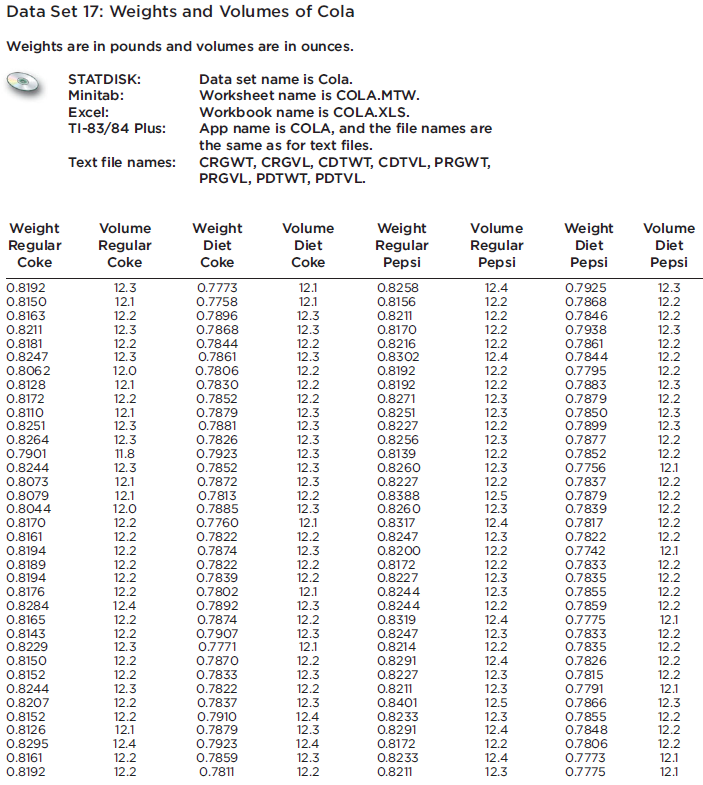
Use the same scale to construct boxplots for the weights of regular Coke and regular Pepsi from Data Set 17 in Appendix B. Use the boxplots to compare the two data sets. Data Set 17: Weights and Volumes of Cola Weights are in pounds and volumes are in ounces. STATDISK: Data set name is Cola.
Find the mean of the data summarized in the given frequency distribution. Also, compare the computed means to the actual means obtained by using the original list of data values, which are as follows: (Exercise 29) 21.1 mg; (Exercise 30) 76.3 beats per minute; (Exercise 31) 46.7 mi/h; (Exercise 32)
Use the same scale to construct boxplots for the weights of regular Coke and diet Coke from Data Set 17 in Appendix B. Use the boxplots to compare the two data sets. Data Set 17: Weights and Volumes of Cola Weights are in pounds and volumes are in ounces. STATDISK: Data set name is Cola. Minitab:
As of this writing, all of the ages of winners of the Miss America Pageant are between 18 years and 24 years. Estimate the standard deviation of those ages.
The given frequency distribution describes the speeds of drivers ticketed by the Town of Poughkeepsie police. These drivers were traveling through a 30mi/h speed zone on Creek Road, which passes the author’s college. How does the mean speed compare to the posted speed limit of 30mi/h?
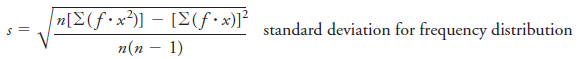
Find the standard deviation of sample data summarized in a frequency distribution table by using the formula below, where x represents the class midpoint, f represents the class frequency, and n represents the total number of sample values. Also, compare the computed standard deviations to these
Find the mean of the data summarized in the given frequency distribution. Also, compare the computed means to the actual means obtained by using the original list of data values, which are as follows: (Exercise 29) 21.1 mg; (Exercise 30) 76.3 beats per minute; (Exercise 31) 46.7 mi/h; (Exercise 32)
A simple random sample of FICO credit rating scores was obtained, and the sorted scores are listed below. Construct a boxplot and include the values of the 5-number summary.664 693 698 714 751 753 779 789 802 818 834 836
Find the standard deviation of sample data summarized in a frequency distribution table by using the formula below, where x represents the class midpoint, f represents the class frequency, and n represents the total number of sample values. Also, compare the computed standard deviations to these
Find the mean of the data summarized in the given frequency distribution. Also, compare the computed means to the actual means obtained by using the original list of data values, which are as follows: (Exercise 29) 21.1 mg; (Exercise 30) 76.3 beats per minute; (Exercise 31) 46.7 mi/h; (Exercise 32)
Refer to Data Set 9 in Appendix B and consider the gross amounts from two different categories of movies: those with R ratings, and those with ratings of PG or PG-13. Use the coefficients of variation to determine whether the two categories appear to have the same amount of variation. Refer to
Refer to Data Set 9 in Appendix B and consider the gross amounts from two different categories of movies: Movies with R ratings and movies with ratings of PG or PG-13. Do the results appear to support a claim that R-rated movies have greater gross amounts because they appeal to larger audiences
Refer to Data Set 13 in Appendix B. Compare the variation from the three different sets of measured voltage levels. Refer to the indicated data set in Appendix B. Use computer software or a calculator to find the range, variance, and standard deviation. Data Set 13: Voltage Measurements From a
Listed below are amounts of strontium-90 (in millibecquerels or mBq) in a simple random sample of baby teeth obtained from Pennsylvania residents born after 1979 (based on data from ?An Unexpected Rise in Strontium-90 in U.S. Deciduous Teeth in the 1990s,? by Mangano, et al., Science of the Total
Use the same list of 24 sorted values given for Exercises 15-18. Find the indicated percentile or quartile.P20
Use the given sorted values, which are the numbers of points scored in the Super Bowl for a recent period of 24 years. Find the percentile corresponding to the given number of points.36 37 37 39 39 41 43 44 44 47 50 53 54 55 56 56 57 59 61 61 65 69 69 7541
Use the given sorted values, which are the numbers of points scored in the Super Bowl for a recent period of 24 years. Find the percentile corresponding to the given number of points.36 37 37 39 39 41 43 44 44 47 50 53 54 55 56 56 57 59 61 61 65 69 69 7565
Listed below are the playing times (in seconds) of songs that were popular at the time of this writing. (The songs are by Timberlake, Furtado, Daughtry, Stefani, Fergie, Akon, Ludacris, Beyonce, Nickelback, Rihanna, Fray, Lavigne, Pink, Mims, Mumidee, and Omarion.) Does the standard deviation
Showing 1000 - 1100
of 2934
First
4
5
6
7
8
9
10
11
12
13
14
15
16
17
18
Last
Step by Step Answers