New Semester
Started
Get
50% OFF
Study Help!
--h --m --s
Claim Now
Question Answers
Textbooks
Find textbooks, questions and answers
Oops, something went wrong!
Change your search query and then try again
S
Books
FREE
Study Help
Expert Questions
Accounting
General Management
Mathematics
Finance
Organizational Behaviour
Law
Physics
Operating System
Management Leadership
Sociology
Programming
Marketing
Database
Computer Network
Economics
Textbooks Solutions
Accounting
Managerial Accounting
Management Leadership
Cost Accounting
Statistics
Business Law
Corporate Finance
Finance
Economics
Auditing
Tutors
Online Tutors
Find a Tutor
Hire a Tutor
Become a Tutor
AI Tutor
AI Study Planner
NEW
Sell Books
Search
Search
Sign In
Register
study help
mathematics
elementary statistics picturing
Elementary Statistics 11th Edition Mario F. Triola - Solutions
Nonparametric tests are typically not as efficient as a corresponding parametric test, provided the necessary requirements are satisfied. What does the efficiency measure? If nonparametric tests are less efficient than parametric tests, why should we use them?
Refer to the body temperatures listed in Exercise 2. Use only the decimal parts of the temperatures (0, 0, 0, 7, and so on) to test the claim that the sequence of odd and even digits is random. Listed below are measured body temperatures (in ?F) of randomly selected subjects (from Data Set 2 in
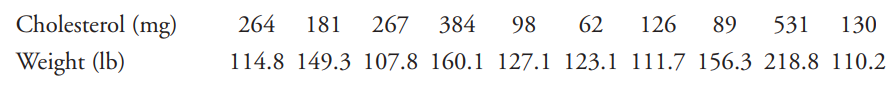
Find the equation of the regression line for the cholesterol weight data. What is the best predicted weight of a woman with a cholesterol level of 100 mg? Use the data in the table below, which are cholesterol levels (in mg per dL of blood) and corresponding weights (in lb) for randomly selected
Divide into groups of three or four students. Investigate the relationship between two variables by collecting your own paired sample data and using the methods of Section 13-6 to determine whether there is a correlation. Suggested topics:• Is there a relationship between taste and cost of
Using the matched data listed in Exercise 3, the differences are as follows: -5.75, -1.25, -1, -5, 0, 0.25, 2.25, -0.5, 0.75, -1.5, and -0.25.List the corresponding ranksof those differences after discarding the 0 and ignoring their signs.
Listed below are the genders of the younger winner in the categories of Best Actor and Best Actress for recent and consecutive years. Do the genders of the younger winners appear to occur randomly?F F F M M F F F F F F M M M M MUse the runs test with a significance level of (All data are listed in
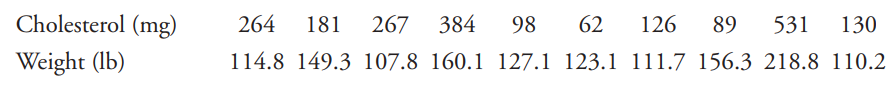
Use a 0.05 significance level with rank correlation to test for a correlation between cholesterol level and weight. Use the data in the table below, which are cholesterol levels (in mg per dL of blood) and corresponding weights (in lb) for randomly selected adult women from Data Set 1 in Appendix
See this chapter’s “From Data to Decision” project, which involves analysis of the 1970 lottery used for drafting men into the U.S. Army. Because the 1970 results raised concerns about the randomness of selecting draft priority numbers, design a new procedure for generating the 366 priority
Positive signs: 13; negative signs: 1; ties: 0 (from a preliminary test of the MicroSort method of gender selection)Assume that matched pairs of data result in the given number of signs when the value of the second variable is subtracted from the corresponding value of the first variable. Use the
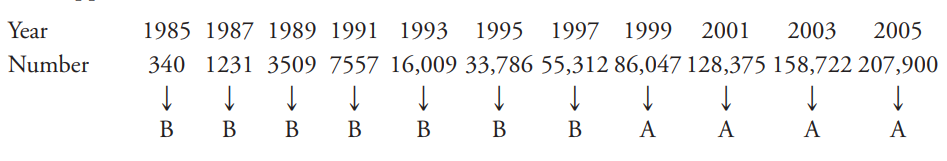
Listed below are the numbers of cell phone subscriptions (in thousands) in the United States for 11 recent years. Shown below the numbers are letters indicating whether the number is below (B) the mean or above (A) the mean, which is 63,526.2 thousand. Test for randomness of the numbers below and
Listed below are actual high temperatures and the high temperatures forecast five days in advance (based on Data Set 11 in Appendix B). Use a 0.05 significance level with the sign test to test the claim that the population of differences has a median of zero. What do the results suggest about the
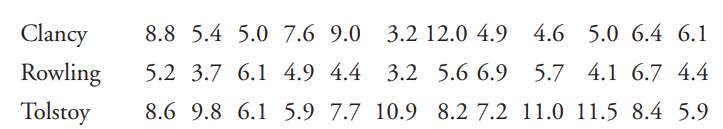
Use a 0.05 significance level with the Kruskal-Wallis test to test the claim that the samples of Flesch-Kincaid Grade Level measurements are from books with the same median reading level. Use the Flesch-Kincaid Grade Level measurements from randomly selected pages in Tom Clancy?s The Bear and the
Divide into groups of 8 to 12 people. For each group member, measure the person’s height and also measure his or her navel height, which is the height from the floor to the navel. Use the rank correlation coefficient to determine whether there is a correlation between height and navel height.
Positive signs: 360; negative signs: 374; ties: 22 (from a Gallup poll of Internet users who were asked if they make travel plans through the Internet)Assume that matched pairs of data result in the given number of signs when the value of the second variable is subtracted from the corresponding
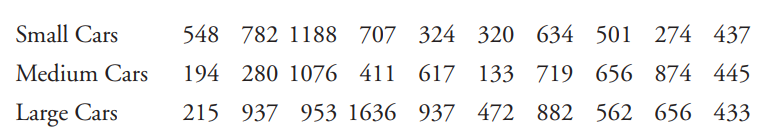
Listed below are measured loads (in lb) on the left femur of crash test dummies. (The data are from the same cars used in the Chapter Problem for Chapter 12.) Use a 0.05 significance level to test the null hypothesis that the different car categories have the same median. Do these data suggest that
Use a 0.05 significance level with a t test to test the claim that the samples of FleschKincaid Grade Level scores from Clancy and Rowling have the same mean. Use the Flesch-Kincaid Grade Level measurements from randomly selected pages in Tom Clancy?s The Bear and the Dragon, J. K. Rowling?s Harry
Divide into groups of three or four people. Appendix B includes many data sets not yet addressed by the methods of this chapter. Search Appendix B for variables of interest, then investigate using appropriate methods of nonparametric statistics. State your conclusions and try to identify practical
Positive signs: 512; negative signs: 327; ties: 0 (from challenges to referee calls in the U.S. Open tennis tournament)Assume that matched pairs of data result in the given number of signs when the value of the second variable is subtracted from the corresponding value of the first variable. Use
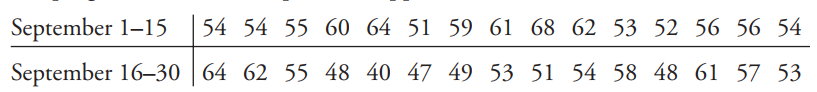
Listed below are low temperatures (in ?F) from the first half of September and the second half of September (from Data Set 11 in Appendix B). Use the Wilcoxon rank-sum test to test the claim that temperatures in the first half of September and temperatures in the second half of September have the
Use a 0.05 significance level with the Wilcoxon rank-sum test to test the claim that the samples of Flesch-Kincaid Grade Level scores from Clancy and Rowling are from populations having the same median. Use the Flesch-Kincaid Grade Level measurements from randomly selected pages in Tom Clancy?s
Divide into groups of three or four, with at least one member of each group having an iPod. Establish two categories of songs, such as those by males or females, then test the sequence of iPod songs for randomness.
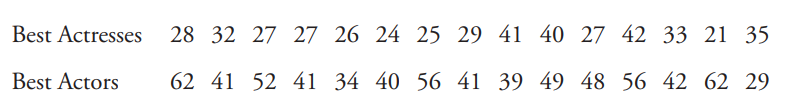
Listed below are ages of actresses and actors at the times that they won Oscars. The data are paired according to the years that they won. Use a 0.05 significance level to test the claim that there is no difference between the ages of best actresses and the ages of best actors at the time that the
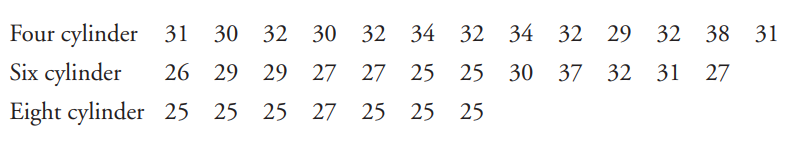
Listed below are the highway fuel consumption amounts (in mi gal) from cars in three different categories (from Data Set 16 in Appendix B). Use a 0.05 significance level to test the claim that the different car categories have the same median highway fuel consumption. Based on the results, does the
Listed below are the high temperatures (in ?F) near the author?s home on consecutive days beginning with September 1 of a recent year (from Data Set 11 in Appendix B). The mean of these high temperatures is 73.8?F. Test for randomness above and below the mean. Use the runs test with a significance
Refer to the temperatures listed in Exercise 9 and consider them to be one consecutive sequence of 30 temperatures. Test for randomness of even and odd temperatures. Listed below are low temperatures (in ?F) from the first half of September and the second half of September (from Data Set 11 in
Associated Press, it was reported that researchers ?randomly selected 100 New York motorists who had been in an accident and 100 who had not been in an accident. Of those in accidents, 13.7 percent owned a cellular phone, while just 10.6 percent of the accident-free drivers had a phone in the car.?
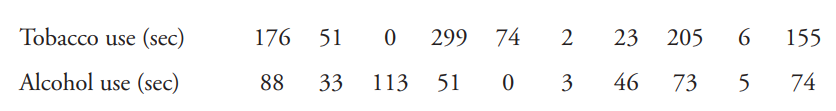
Listed below are times (in sec) that animated Disney movies showed the use of tobacco and alcohol. (See Data Set 7 in Appendix B.) Use a 0.05 significance level to test the claim that for a typical animated movie, the time spent depicting the use of alcohol is less than the time spent depicting the
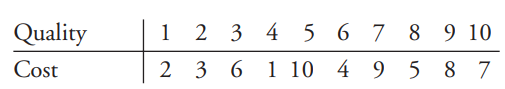
Consumer Reports magazine tested large plasma TVs. The table below shows the rankings of TVs by overall quality score and cost. High values are given low ranks, so the TV with a quality rank of 1 is the TV with the highest quality score, and a TV given a cost rank of 1 is the most expensive TV.
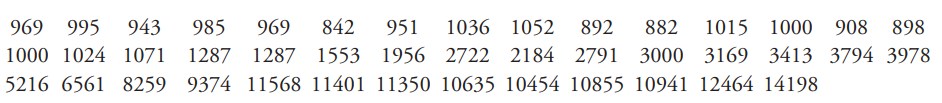
Listed below are the annual high values of the Dow Jones Industrial Average for a recent sequence of years. Test for randomness below and above the median. What does the result suggest about the stock market as an investment consideration? 969 995 943 985 969 842 951 1036 1052 892 882 1015 1000 908
The Genetics and IVF Institute conducted a clinical trial of its methods for gender selection. As of this writing, 172 of 211 babies born to parents using the YSORT method were boys. Use a 0.01 significance level to test the claim that the YSORT method is effective in increasing the likelihood of a
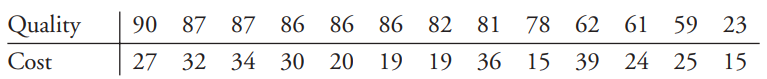
Consumer Reports magazine tested paints. The table below shows the overall quality score and cost in dollars per gallon. Test for a correlation. Based on these results, do you get better quality paint by paying more? Quality 90 87 87 86 86 86 82 81 78 62 61 59 23 Cost 27 32 34 30 20 19 19 36 15 39
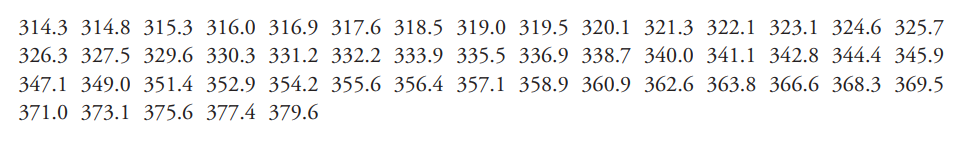
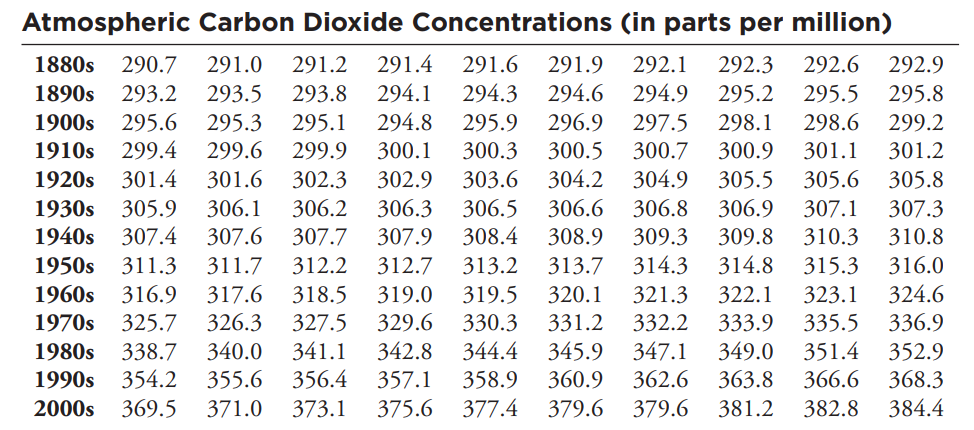
Listed below are carbon dioxide concentrations (in parts per million) at the earth?s surface for 50 recent and consecutive years (based on data from the Goddard Institute for Space Studies). Test for randomness above and below the mean. 314.3 314.8 315.3 316.0 316.9 317.6 318.5 319.0 319.5 320.1
When testing gas pumps in Michigan for accuracy, fuel-quality enforcement specialists tested pumps and found that 1299 were not accurate (within 3.3 oz when 5 gal is pumped), and 5686 were accurate. Use a 0.01 significance level to test the claim of an industry representative that less than half of
a. If we have sample paired data with 50 nonzero differences and the sum of the positive ranks is 300, find the absolute value of the sum of the negative ranks.b. If we have sample paired data with n nonzero differences and one of the two rank sums is k, find an expression for the other rank sum.
A study addressed the issue of whether women have the ability to predict the sex of their babies. Among 104 recruited subjects, 55% correctly guessed the sex of the baby (based on data from “Are Women Carrying ‘Basketballs’ Really Having Boys? Testing Pregnancy Folklore,” by Perry,
The title of this chapter is “Statistical Process Control.” What does that mean?
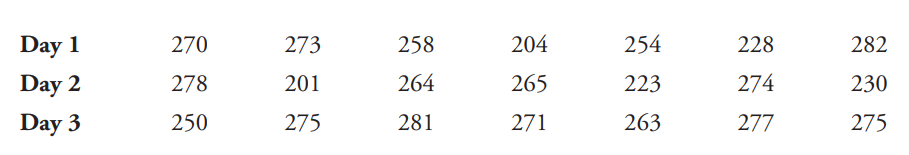
Construct a run chart for the 21 axial loads from the first three days, as listed below. Based on the result, does there appear to be a pattern suggesting that the process is not within statistical control? Day 1 270 273 258 204 254 228 282 Day 2 278 201 264 265 223 274 230 Day 3 250 275 281 271
The labels on a bottle of Bayer aspirin indicate that the tablets contain 325 mg of aspirin. Suppose manufacturing specifications require that tablets have between 315 mg and 335 mg of aspirin, so a tablet is considered to be a defect if the amount of aspirin is not within those limits. If the
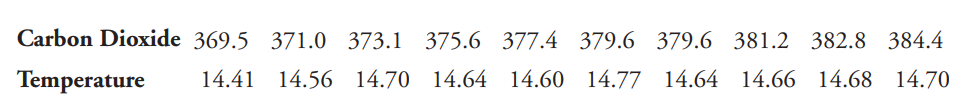
Listed below are concentrations of carbon dioxide (in parts per million) of the earth?s atmosphere and the earth?s mean temperature (in ?C) for each of ten recent and consecutive years. (The last few pairs of values are projections.) a. Use a 0.05 significance level to test for a linear correlation
Collect your own process data and analyze them using the methods of this chapter. It would be ideal to collect data from a real manufacturing process, but that may be difficult to accomplish. If so, consider using a simulation or referring to published data, such as those found in an almanac. Here
Consider process data consisting of the amounts of Coke (in oz) in randomly selected cans of regular Coke. The process is to be monitored with and R control charts based on samples of 50 cans randomly selected each day for 20 consecutive days of production. In this context, what do , , UCL, and LCL
Lipitor is a drug designed to lower cholesterol levels. With current sales of Lipitor exceeding $13 billion each year, it has become the best selling drug ever. One dosage level of Lipitor is provided with tablets containing 10 mg of the drug atorvastatin. If the manufacturing process is set up to
Using subgroups of size corresponding to the rows of the table for the first three days given in Exercise 1, find the values of R̅, the lower control limit, and the upper control limit that would be used to construct an R chart.
Assume that Bayer aspirin tablets are monitored to ensure that the proportions of defects are within statistical control. A quality control inspector randomly selects samples with 100 tablets in each sample. If the numbers of defects for the first five samples are 2, 1, 0, 4, and 3, find the value
The Flint Accessory Corporation manufactures seat belts for cars. Federal specifications require that the webbing must have a breaking strength of at least 5000 lb. During each week of production, 200 belts are randomly selectedand tested for breaking strength. A belt is considered defective if it
If the instructor can distribute the numbers of absences for each class meeting, groups of three or four students can analyze them for statistical stability and make recommendations based on the conclusions.
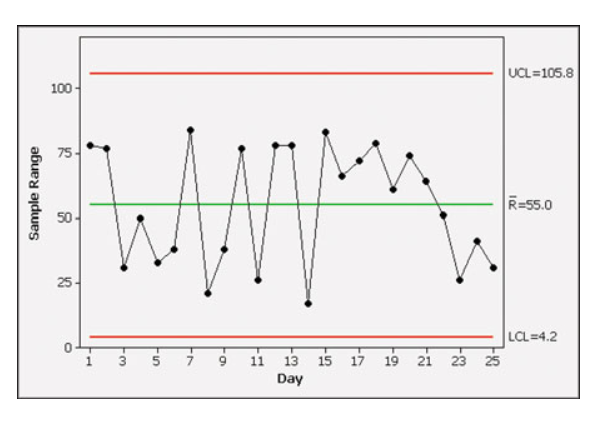
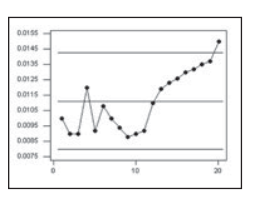
If we use subgroups of size corresponding to the rows of the table, and if we use all of the data from 25 days of production, we get the R chart shown below. Interpret that R chart. UCL=105.8 100- 75 R=55.0 50- 25- LCL=4.2 11 13 15 17 19 21 23 9. Day Sample Range
Refer to the data in Exercise 2 and, using all of the data from the 2000 seat belts that were tested, construct a 95% confidence interval for the proportion of defects. Also, write a statement that interprets the confidence interval. The Flint Accessory Corporation manufactures seat belts for
Conduct research to identify Deming’s funnel experiment, then use a funnel and marbles to collect data for the different rules for adjusting the funnel location. Construct appropriate control charts for the different rules of funnel adjustment. What does the funnel experiment illustrate? What do
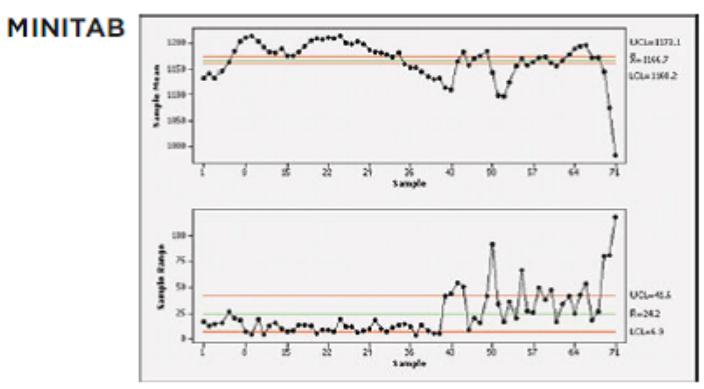
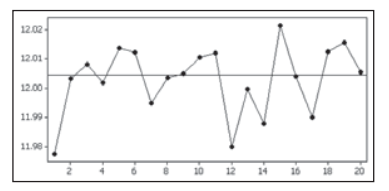
Shown below are an chart (top) and an R chart (bottom) obtained using the monthly elevations of Lake Mead at Hoover Dam (based on data from the U.S. Department of the Interior). The elevations are in feet above sea level. The control charts are based on the 12 monthly elevations for each of the 71
Assume that the proportion of defective Bayer aspirin tablets is monitored with a control chart and we conclude that the process is not within statistical control because there is a downward pattern that is not random. Should the downward pattern be corrected? What should the company do?
Refer to the data in Exercise 2 and, using all of the data from the 2000 seat belts that were tested, use a 0.05 significance level to test the claim that the rate of defects is greater than 3%. The Flint Accessory Corporation manufactures seat belts for cars. Federal specifications require that
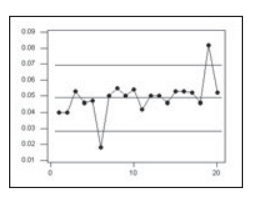
Examine the run chart from a process of filling 12-oz cans of cola and do the following:? (a) Determine whether the process is within statistical control;? (b) If the process is not within statistical control, identify reasons why it is not;? (c) Apart from being within statistical control, does
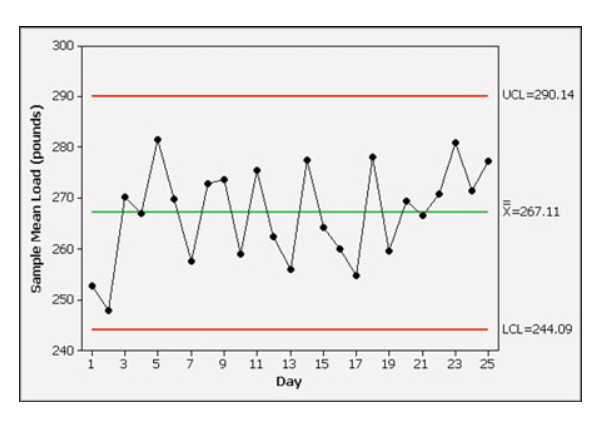
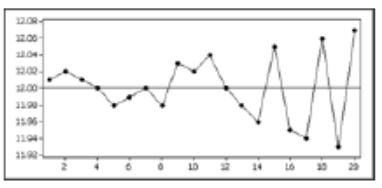
If we use subgroups of size corresponding to the rows of the table, and if we use all of the data from 25 days of production, we get the x? chart shown below. Interpret that x? chart. 300 290 - UCL=290.14 280 - 270- -267.11 260- 250 LCL=244.09 240 7 11 13 15 17 19 21 23 25 Day Sample Mean Load
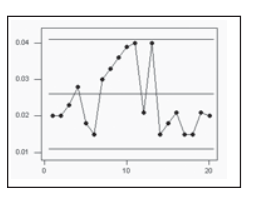
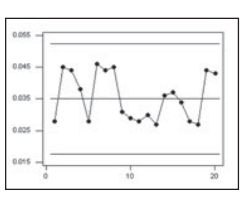
Examine the given control chart for p and determine whether the process is within statistical control. If it is not, identify which of the three out-of-control criteria apply. 004 01 10 20
When interpreting control charts, one of the three out-of-control criteria is that there are eight consecutive points all above or all below the centerline. For a statistically stable process, there is a 0.5 probability that a point will be above the centerline and a 0.5 probability that a point
Examine the run chart from a process of filling 12-oz cans of cola and do the following: (a) Determine whether the process is within statistical control; (b) if the process is not within statistical control, identify reasons why it is not; (c) apart from being within statistical control, does the
Examine the given control chart for p and determine whether the process is within statistical control. If it is not, identify which of the three out-of-control criteria apply. cens 10 20
Engineers must consider the breadths of male heads when designing motorcycle helmets. Men have head breadths that are normally distributed with a mean of 6.0 in. and a standard deviation of 1.0 in. (based on anthropometric survey data from Gordon, Churchill, et al.).a. What percentage of men have
Examine the run chart from a process of filling 12-oz cans of cola and do the following: (a) Determine whether the process is within statistical control; (b) If the process is not within statistical control, identify reasons why it is not; (c) Apart from being within statistical
The Acton Pharmaceutical Company manufactures antacid tablets that are supposed to contain 750 mg of calcium carbonate, similar to the Tums tablets manufactured by GlaxoSmithKline. Each day, 100 tablets are randomly selected and the amount of calcium carbonate is measured. A tablet is considered
Examine the given control chart for p and determine whether the process is within statistical control. If it is not, identify which of the three out-of-control criteria apply. 00145 00135 00125 00115 000rs 10 20
America Online conducted an online poll in which Internet users were asked, “Have you ever seen a UFO?” There were 37,021 Internet users who responded with “yes,” and there were 80,806 Internet users who responded with “no.” Based on the results, can we conclude that most people have
Examine the run chart from a process of filling 12-oz cans of cola and do the following: (a) Determine whether the process is within statistical control; (b) if the process is not within statistical control, identify reasons why it is not; (c) apart from being within statistical control, does the
Examine the given control chart for p and determine whether the process is within statistical control. If it is not, identify which of the three out-of-control criteria apply. 009 0.00 006 000 0.02 01 10 20
After finding the values of the mean and range for each decade, find the values of x?, and R?. Also find the values of LCL and UCL for an R chart, and find the values of LCL and UCL for an x? chart. Use the data in the following table, which lists carbon dioxide concentrations (in parts per
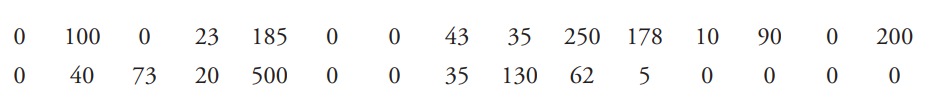
Refer to the sample values listed in Exercise 8 and find the mean, median, and standard deviation. The author conducted a survey of his students and requested the value of the coins that each student possessed. Some of the results (in cents) are listed below. Do these values appear to be from a
Construct a run chart for the 130 values. Does there appear to be a pattern suggesting that the process is not within statistical control? What are the practical implications of the run chart? Use the data in the following table, which lists carbon dioxide concentrations (in parts per million) for
Use the sample values listed in Exercise 8 to test the claim that most students have some change in their possession. Use a 0.05 significance level. The author conducted a survey of his students and requested the value of the coins that each student possessed. Some of the results (in cents) are
Let each subgroup consist of the 10 values within a decade. Construct an R chart and determine whether the process variation is within statistical control. If it is not, identify which of the three out-of-control criteria lead to rejection of statistically stable variation. Use the data in the
In each of 15 recent and consecutive years, 1000 high school completers were randomly selected and the number who enrolled in college was determined, with the results listed below. Does the p chart indicate that such college enrollments are high enough? (The values are based on data from the U.S.
Let each subgroup consist of the 10 values within a decade. Construct an chart and determine whether the process mean is within statistical control. If it is not, identify which of the three out-of-control criteria lead to rejection of a statistically stable mean. Use the data in the following
In each of 15 recent and consecutive years, 100,000 people in the United States were randomly selected and the number who were victims of violent crime was determined, with the results listed below. Does the rate of violent crime appear to exhibit acceptable behavior? (The values are based on data
In each of 23 recent and consecutive years of national elections, 1000 people of voting age in the United States were randomly selected and the number who voted was determined, with the results listed below. Odd-numbered years correspond to years of presidential elections. Comment on the voting
In each of 20 recent and consecutive years, 10,000 people were randomly selected and the numbers of births they generated were found, with the results given below. How might the results be explained? (The listed values are based on data from the U.S. Department of Health and Human Services, and
After finding the values of the mean and range for each subgroup, find the values of x̅, and R̅. Then find the values of LCL and UCL for an R chart and for an x̅ chart.
Using subgroups of five voltage amounts, construct an chart and determine whether the process mean is within statistical control. If it is not, identify which of the three out-of-control criteria lead to rejection of a statistically stable mean.
Construct a run chart for the 40 voltage amounts. Does there appear to be a pattern suggesting that the process is not within statistical control?
Using subgroups of five voltage amounts, construct an R chart and determine whether the process variation is within statistical control. If it is not, identify which of the three out-of-control criteria lead to rejection of statistically stable variation.
Use the existing seating arrangement in your class and apply the runs test to determine whether the students are arranged randomly according to gender. After recording the seating arrangement, analysis can be done in subgroups of three or four students.
Find the mean, median, range, standard deviation, and variance of the cholesterol levels. Given that the cholesterol levels are in mg, express the results using the appropriate units. Use the data in the table below, which are cholesterol levels (in mg per dL of blood) and corresponding weights
The last 103 baseball seasons (as of this writing) ended with 61 World Series wins by American League teams, compared to 42 wins by National League teams. Use the sign test with a 0.05 significance level to test the claim that in each World Series, the American League team has a 0.5 probability of
What is the difference between a nonparametric test and a distribution-free test?
What is a nonparametric test? What is a parametric test?
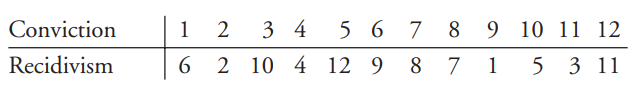
Judges in Bernalillo County in New Mexico were ranked for their DWI conviction rates and their recidivism rates, where recidivism refers to a subsequent DWI arrest for a person previously charged with DWI. The results for judges Gentry, Ashanti, Niemczyk, Baca, Clinton, Gomez, Barnhart, Walton,
On January 1, 2005, the bar codes put on retail products were changed so that they now represent 13 digits instead of 12. How many different products can now be identified with the new bar codes?
When Mendel conducted his famous genetics experiments with peas, one sample of offspring consisted of 428 green peas and 152 yellow peas. Based on those results, estimate the probability of getting an offspring pea that is green. Is the result reasonably close to the expected value of 3/4, as
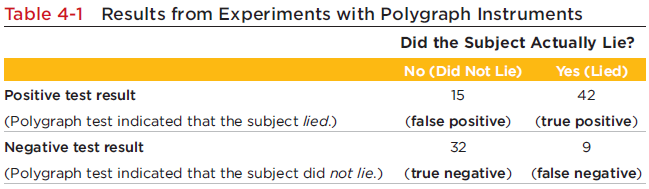
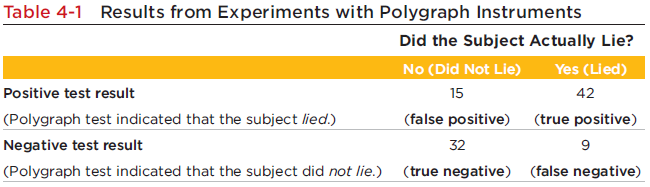
Refer to the sample data in Table 4-1. If one of the responses is randomly selected, what is the probability that it is a false negative? (Express the answer as a decimal.) What does this probability suggest about the accuracy of the polygraph test? Table 4-1 Results from Experiments with
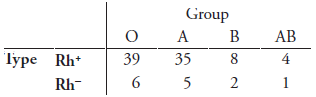
People with blood that is group AB and type Rh are considered to be universal recipients, because they can receive blood from anyone. If three of the 100 subjects are randomly selected, find the probability that they are all universal recipients. a. Assume that the selections are made with
Refer to Table 4-1 and assume that 1 of the 98 test subjects is randomly selected. Find the probability of selecting a subject with a negative test result, given that the subject lied. What does this result suggest about the polygraph test? Table 4-1 Results from Experiments with Polygraph
The 110th Congress of the United States included 84 male Senators and 16 female Senators. If one of these Senators is randomly selected, what is the probability that a woman is selected? Does this probability agree with a claim that men and women have the same chance of being elected as Senators?
If S denotes the event of selecting a successful challenge, find P(S̅).Use the data in the accompanying table, which summarizes challenges by tennis players (based on data reported in USA Today). The results are from the first U.S. Open that used the Hawk-Eye electronic system for displaying an
A quick quiz consists of a true/false question followed by a multiple-choice question with four possible answers (a, b, c, d). An unprepared student makes random guesses for both answers.a. Consider the event of being correct with the first guess and the event of being correct with the second
Refer to Table 4-1. Find P(subject lied negative test result). Compare this result to the result found in Exercise 20. Are P(subject lied negative test result) and P(negative test result | subject lied) equal? Table 4-1 Results from Experiments with Polygraph Instruments Did the Subject Actually
If M denotes the event of selecting a challenge made by a man, find P(M̅).Use the data in the accompanying table, which summarizes challenges by tennis players (based on data reported in USA Today). The results are from the first U.S. Open that used the Hawk-Eye electronic system for displaying an
With one method of a procedure called acceptance sampling, a sample of items is randomly selected without replacement and the entire batch is accepted if every item in the sample is okay. The Telektronics Company manufactured a batch of 400 backup power supply units for computers, and 8 of them are
Refer to Table 4-1. a. Find P (negative test result | subject did not lie). b. Find P(subject did not lie | negative test result). c. Compare the results from parts (a) and (b). Are they equal? Table 4-1 Results from Experiments with Polygraph Instruments Did the Subject Actually Lie? No (Did Not
In designing a computer, if a byte is defined to be a sequence of 8 bits and each bit must be a 0 or 1, how many different bytes are possible? (A byte is often used to represent an individual character, such as a letter, digit, or punctuation symbol. For example, one coding system represents the
In a recent year, 281 of the 290,789,000 people in the United States were struck by lightning. Estimate the probability that a randomly selected person in the United States will be struck by lightning this year. Is a golfer reasoning correctly if he or she is caught out in a thunderstorm and does
Find the probability that the selected challenge was made by a man or was successful.Use the data in the accompanying table, which summarizes challenges by tennis players (based on data reported in USA Today). The results are from the first U.S. Open that used the Hawk-Eye electronic system for
Showing 600 - 700
of 2934
1
2
3
4
5
6
7
8
9
10
11
12
13
14
15
Last
Step by Step Answers