New Semester
Started
Get
50% OFF
Study Help!
--h --m --s
Claim Now
Question Answers
Textbooks
Find textbooks, questions and answers
Oops, something went wrong!
Change your search query and then try again
S
Books
FREE
Study Help
Expert Questions
Accounting
General Management
Mathematics
Finance
Organizational Behaviour
Law
Physics
Operating System
Management Leadership
Sociology
Programming
Marketing
Database
Computer Network
Economics
Textbooks Solutions
Accounting
Managerial Accounting
Management Leadership
Cost Accounting
Statistics
Business Law
Corporate Finance
Finance
Economics
Auditing
Tutors
Online Tutors
Find a Tutor
Hire a Tutor
Become a Tutor
AI Tutor
AI Study Planner
NEW
Sell Books
Search
Search
Sign In
Register
study help
mathematics
elementary statistics picturing
Elementary Statistics Picturing The World 7th Edition Ron Larson, Betsy Farber - Solutions
A nutrition bar manufacturer claims that the standard deviation of the number of grams of carbohydrates in a bar is 1.11 grams. A random sample of 26 bars has a standard deviation of 1.19 grams. At α = 0.05, is there enough evidence to reject the manufacturer’s claim? Assume the population is
A research center claims that more than 80% of U.S. adults think that mothers should have paid maternity leave. In a random sample of 50 U.S. adults, 82% think that mothers should have paid maternity leave. At α = 0.05, is there enough evidence to support the center’s claim?For each exercise,
A travel analyst says that the mean price of a meal for a family of 4 in a resort restaurant is at most $100. A random sample of 33 meal prices for families of 4 has a mean of $110 and a standard deviation of $19. At α = 0.01, is there enough evidence to reject the analyst’s claim?For each
A travel analyst claims that the mean of the room rates for two adults at three-star hotels in Salt Lake City is $134. In a random sample of 37 three-star hotels in Salt Lake City, the mean room rate for two adults is $143. Assume the population standard deviation is $30. At α = 0.10, is there
A retail grocery chain owner claims that more than 30% of adults havepurchased a meal kit in a recent year. In a random sample of 36 adults, 25% have purchased a meal kit in a recent year. At α = 0.10, is there enough evidence to support the owner’s claim?For each exercise, perform the steps
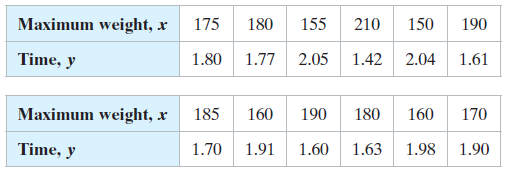
In Exercise 26, let the time (in seconds) to sprint 10 meters represent the x-values and the maximum weight (in kilograms) for which one repetition of a half squat can be performed represent the y-values. Calculate the correlation coefficient r. What effect does switching the explanatory and
The table in Exercise 26 shows the maximum weights (in kilograms) for which one repetition of a half squat can be performed and the times (in seconds) to run a 10-meter sprint for 12 international soccer players. At a = 0.01, is there enough evidence to conclude that there is a significant linear
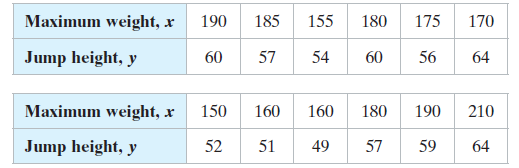
The table in Exercise 25 shows the maximum weights (in kilograms) for which one repetition of a half squat can be performed and the jump heights (in centimeters) for 12 international soccer players. At a = 0.05, is there enough evidence to conclude that there is a significant linear correlation
In Exercise 26, add data for an international soccer player who can perform the half squat with a maximum of 210 kilograms and can sprint 10 meters in 2.00 seconds to the data set. Describe how this affects the correlation coefficient r.Data from Exercise 26:The maximum weights (in kilograms) for
In Exercise 25, remove the data for the international soccer player with a maximum weight of 170 kilograms and a jump height of 64 centimeters from the data set. Describe how this affects the correlation coefficient r.Data from Exercise 25:The maximum weights (in kilograms) for which one repetition
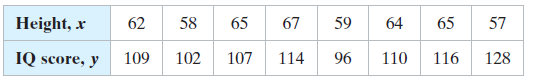
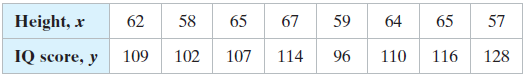
In Exercise 24, remove the data for the girl who is 57 inches tall and scored 128 on the IQ test from the data set. Describe how this affects the correlation coefficient r.Data from Exercise 24:The height (in inches) of 8 high school girls and their scores on an IQ test. Height, x 62 58 59 67 65 64
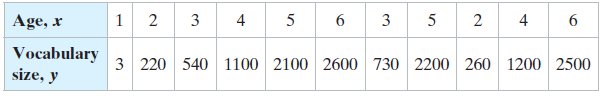
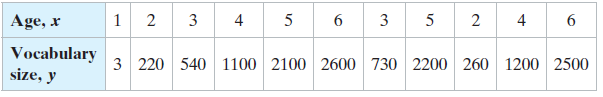
In Exercise 23, add data for a child who is 6 years old and has a vocabulary size of 900 words to the data set. Describe how this affects the correlation coefficient r.Data from Exercise 23;The ages (in years) of 11 children and the numbers of words in their vocabulary 5 3 4 5 Age, x 3 1 2
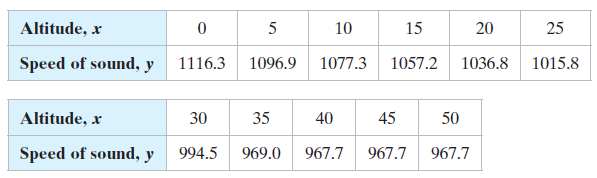
Eleven altitudes (in thousands of feet) and the speeds of sound (in feet per second) at these altitudes.(a) Display the data in a scatter plot, (b) Calculate the sample correlation coefficient r, (c) Describe the type of correlation, if any, and interpret the correlation in the context of
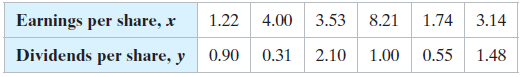
The earnings per share (in dollars) and the dividends per share (in dollars) for 6 companies in a recent year.(a) Display the data in a scatter plot, (b) Calculate the sample correlation coefficient r, (c) Describe the type of correlation, if any, and interpret the correlation in the
The height (in inches) of 8 high school girls and their scores on an IQ test(a) Display the data in a scatter plot, (b) Calculate the sample correlation coefficient r, (c) Describe the type of correlation, if any, and interpret the correlation in the context of the data, and (d) Use
The ages (in years) of 11 children and the numbers of words in their vocabulary(a) Display the data in a scatter plot, (b) Calculate the sample correlation coefficient r, (c) Describe the type of correlation, if any, and interpret the correlation in the context of the data, and (d)
Two variables are given that have been shown to have correlation but no cause-and-effect relationship. Describe at least one possible reason for the correlation.Marriage rate in Kentucky and number of deaths caused by falling out of a fishing boat.
Two variables are given that have been shown to have correlation but no cause-and-effect relationship. Describe at least one possible reason for the correlation.Ice cream sales and homicide rates.
Two variables are given that have been shown to have correlation but no cause-and-effect relationship. Describe at least one possible reason for the correlation.Alcohol use and tobacco use.
Two variables are given that have been shown to have correlation but no cause-and-effect relationship. Describe at least one possible reason for the correlation.Value of home and life span.
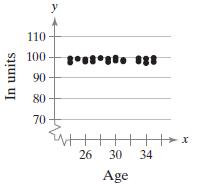
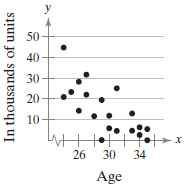
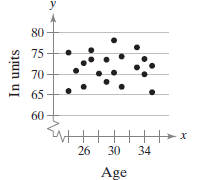
The scatter plots show the results of a survey of 20 randomly selected males ages 24 –35. Using age as the explanatory variable, match each graph with the appropriate description. Explain your reasoning.(a) Age and body temperature (b) Age and balance on student loans(c) Age and
The scatter plots show the results of a survey of 20 randomly selected males ages 24 –35. Using age as the explanatory variable, match each graph with the appropriate description. Explain your reasoning.(a) Age and body temperature (b) Age and balance on student loans(c) Age and
The scatter plots show the results of a survey of 20 randomly selected males ages 24 –35. Using age as the explanatory variable, match each graph with the appropriate description. Explain your reasoning.(a) Age and body temperature (b) Age and balance on student loans(c) Age and
An actuary at an insurance company wants to determine whether the number of hours of safety driving classes can be used to predict the number of driving accidents for each driver.Identify the explanatory variable and the response variable.
A nutritionist wants to determine whether the amounts of water consumed each day by persons of the same weight and on the same diet can be used to predict individual weight loss.Identify the explanatory variable and the response variable.
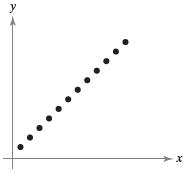
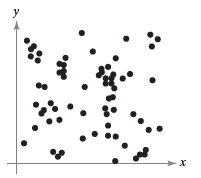
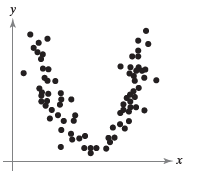
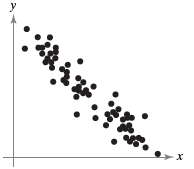
Determine whether there is a perfect positive linear correlation, a strong positive linear correlation, a perfect negative linear correlation, a strong negative linear correlation, or no linear correlation between the variables. y
Determine whether there is a perfect positive linear correlation, a strong positive linear correlation, a perfect negative linear correlation, a strong negative linear correlation, or no linear correlation between the variables. y х
Determine whether there is a perfect positive linear correlation, a strong positive linear correlation, a perfect negative linear correlation, a strong negative linear correlation, or no linear correlation between the variables. х
Determine whether there is a perfect positive linear correlation, a strong positive linear correlation, a perfect negative linear correlation, a strong negative linear correlation, or no linear correlation between the variables. х
In your own words, what does it mean to say “correlation does not imply causation”? List a pair of variables that have correlation but no cause-and-effect relationship.
What are the null and alternate hypotheses for a two-tailed t-test for the population correlation coefficient r? When do you reject the null hypothesis?
Discuss the difference between r and ρ.
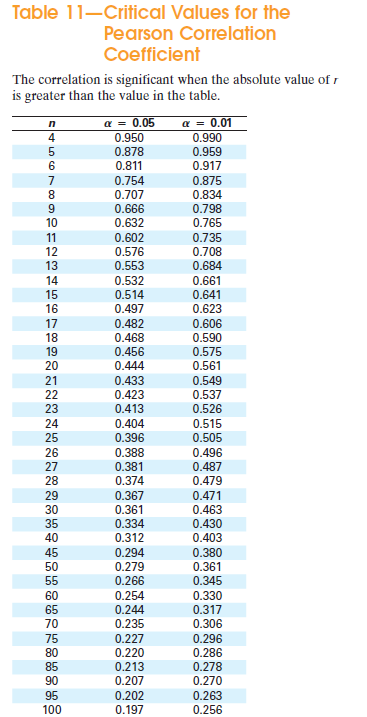
Explain how to determine whether a sample correlation coefficient indicates that the population correlation coefficient is significant.
Give examples of two variables that have perfect positive linear correlation and two variables that have perfect negative linear correlation.
Describe the range of values for the correlation coefficient.
Two variables have a positive linear correlation. Does the dependent variable increase or decrease as the independent variable increases? What if the variables have a negative linear correlation?
A demographics researcher claims that the mean household income in a recent year is different in Polk County, Iowa, than it is in Woodward County, Oklahoma. In Polk County, a sample of 13 residents has a mean household income of $61,300 and a standard deviation of $1770. In Woodward County, a
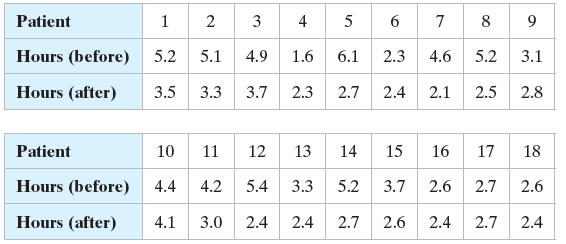
A physical therapist suggests that soft tissue massage therapy helps to reduce the lengths of time patients suffer from headaches. The table shows the numbers of hours per day 18 patients suffered from headaches before and after 6 weeks of receiving treatment. At a = 0.05, is there enough evidence
A real estate agency says that the mean home sales price in Olathe, Kansas, is greater than in Rolla, Missouri. The mean home sales price for 64 homes in Olathe is $356,889. Assume the population standard deviation is $537,407. The mean home sales price for 36 homes in Rolla is $189,389. Assume the
In a survey of 5000 students taking the SAT, 350 were undecided on an intended college major. In another survey of 12,000 students taken 10 years before, 360 were undecided on an intended college major. At α = 0.10, can you reject the claim that the proportion of students taking the SAT who are
A traffic safety research team conducted a survey over two years on the use of motorcycle helmets. In the survey, each year 1000 motorcyclists were asked whether they use helmets that are compliant with federal safety regulations. The results are shown below. At α = 0.01, can you support the claim
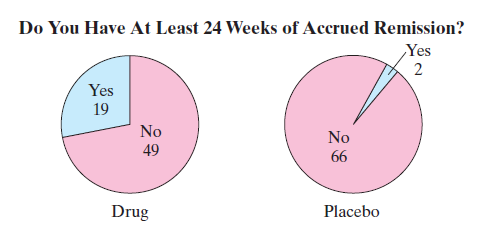
A medical research team conducted a study to test the effect of a drug used to treat a type of inflammation. In the study, 68 subjects took the drug and 68 subjects took a placebo. The results are shown below. At α = 0.05, can you reject the claim that the proportion of subjects who had at least
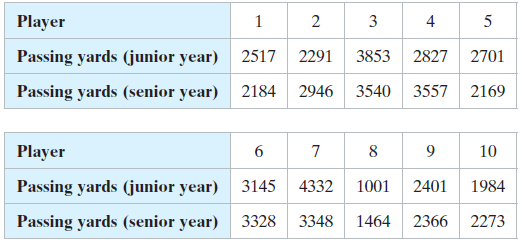
A sports statistician claims that the numbers of passing yards for college football quarterbacks change from their junior to their senior years. The table shows the numbers of passing yards for 10 college football quarterbacks in their junior and senior years. At α = 0.05, is there enough evidence
A real estate agent claims that there is no difference between the mean household incomes of two neighborhoods. The mean income of 12 randomly selected households from the first neighborhood is $52,750 with a standard deviation of $2900. In the second neighborhood, 10 randomly selected households
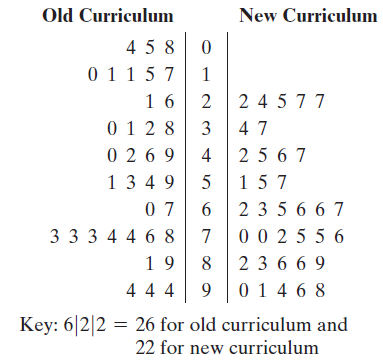
A new method of teaching mathematics is being tested on sixth grade students. A group of sixth grade students is taught using the new curriculum. A control group of sixth grade students is taught using the old curriculum. The mathematics test scores for the two groups are shown in the back-to-back
A career counselor claims that the mean annual salary of entry-level paralegals in Peoria, Illinois, and Gary, Indiana, is the same. The mean annual salary of 40 randomly selected entry-level paralegals in Peoria is $50,410. Assume the population standard deviation is $9320. The mean annual salary
Test the claim about the difference between two population means μ1 and μ2 at the level of significance a. Assume the samples are random and independent, and the populations are normally distributed.Claim: μ1 ≠ μ2; α = 0.05Population statistics: σ1 = 14 and σ2 = 15Sample statistics: x̅1 =
Test the claim about the difference between two population means μ1 and μ2 at the level of significance a. Assume the samples are random and independent, and the populations are normally distributed.Claim: μ1 < μ2; α = 0.10Population statistics: σ1 = 0.11 and σ2 = 0.10Sample statistics:
Test the claim about the difference between two population means μ1 and μ2 at the level of significance a. Assume the samples are random and independent, and the populations are normally distributed.Claim: μ1 = μ2; α = 0.01Population statistics: σ1 = 52 and σ2 = 68Sample statistics: x̅1 =
Test the claim about the difference between two population means μ1 and μ2 at the level of significance a. Assume the samples are random and independent, and the populations are normally distributed.Claim: μ1 ≥ μ2; α = 0.05Population statistics: σ1 = 0.30 and σ2 = 0.23Sample statistics:
Sample 1: The fuel efficiencies of 12 carsSample 2: The fuel efficiencies of the same 12 cars using an alternative fuel.Classify the two samples as independent or dependent and justify your answer.
Sample 1: The fuel efficiencies of 20 sports utility vehiclesSample 2: The fuel efficiencies of 20 minivansClassify the two samples as independent or dependent and justify your answer.
Sample 1: The weights of 39 dogsSample 2: The weights of 39 catsClassify the two samples as independent or dependent and justify your answer.
Sample 1: The weights of 43 adultsSample 2: The weights of the same 43 adults after participating in a diet and exercise programClassify the two samples as independent or dependent and justify your answer.
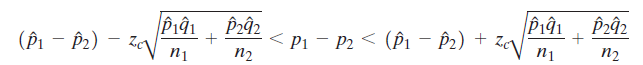
Repeat Exercise 25 but with a 99% confidence interval. Compare your result with the result in Section 6.3, Exercise 27, part (b).You can construct a confidence interval for the difference between two population proportions p1 - p2 by using the inequality below.Construct the indicated confidence
In Section 6.3, Exercises 27 and 28, let p1 be the proportion of the population of U.S. college graduates who expect to stay at their first employer for 3 or more years and let p2 be the proportion of the population of U.S. college graduates who are employed in their field of study. Construct a 95%
In a survey of 10,000 students taking the SAT, 7% were undecided on an intended college major. In another survey of 8000 students taken 10 years before, 3% were undecided on an intended college major. Construct a 90% confidence interval for p1 - p2, where p1 is the proportion from the recent survey
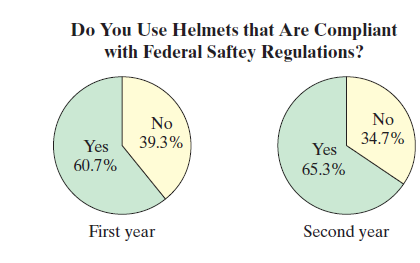
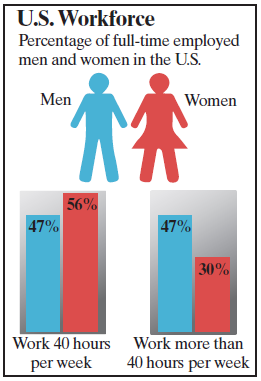
At α = 0.10, can you support the claim that the proportion of the U.S. workforce that works more than 40 hours per week is less for women than for men?Use the figure shown at the left, which gives the percentages of full-time employed men and women in the United States who work 40 hours per week
At α = 0.05, can you support the claim that the proportion of the U.S. workforce that works 40 hours per week is greater for women than for men?Use the figure shown at the left, which gives the percentages of full-time employed men and women in the United States who work 40 hours per week and who
At α = 0.05, can you support the claim that the proportion of women who work 40 hours per week is greater than the proportion of women who work more than 40 hours per week?Use the figure shown at the left, which gives the percentages of full-time employed men and women in the United States who
At α = 0.01, can you reject the claim that the proportion of men who work 40 hours per week is the same as the proportion of men who work more than 40 hours per week?Use the figure shown at the left, which gives the percentages of full-time employed men and women in the United States who work 40
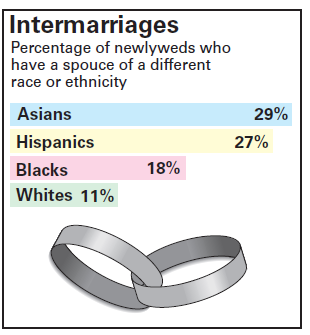
At α = 0.05, can you support the claim that the proportion of newlywed Hispanics who have a spouse of a different race or ethnicity is greater than the proportion of newlywed whites who have a spouse of a different race or ethnicity?Use the figure, which shows the percentages of newlyweds in the
At α = 0.01, can you support the claim that the proportion of newlywed whites who have a spouse of a different race or ethnicity is less than the proportion of newlywed blacks who have a spouse of a different race or ethnicity?Use the figure, which shows the percentages of newlyweds in the United
At α = 0.05, can you support the claim that the proportion of newlywed Hispanics who have a spouse of a different race or ethnicity is different from the proportion of newlywed blacks who have a spouse of a different race or ethnicity?Use the figure, which shows the percentages of newlyweds in the
At α = 0.01, can you support the claim that the proportion of newlywed Asians who have a spouse of a different race or ethnicity is greater than the proportion of newlywed whites who have a spouse of a different race or ethnicity?Use the figure, which shows the percentages of newlyweds in the
At α = 0.01, can you support the claim that the proportion of newlywed blacks who have a spouse of a different race or ethnicity is less than the proportion of newlywed Asians who have a spouse of a different race or ethnicity?Use the figure, which shows the percentages of newlyweds in the United
At α = 0.05, can you reject the claim that the proportion of newlywed Asians who have a spouse of a different race or ethnicity is the same as the proportion of newlywed Hispanics who have a spouse of a different race or ethnicity?Use the figure, which shows the percentages of newlyweds in the
In a survey of 1000 drivers from the Midwest, 855 wear a seat belt. In a survey of 1000 drivers from the South, 909 wear a seat belt. At α = 0.10, can you support the claim that the proportion of drivers who wear seat belts in the Midwest is less than the proportion of drivers who wear seat belts
In a survey of 1000 drivers from the West, 934 wear a seat belt. In a survey of 1000 drivers from the Northeast, 909 wear a seat belt. At α = 0.05, can you support the claim that the proportion of drivers who wear seat belts is greater in the West than in the Northeast?(a) Identify the claim and
In a survey of 500 males ages 20 to 24, 15.8% were neither in school nor working. In a survey of 500 females ages 20 to 24, 17.8% were neither in school nor working. At α = 0.05, can you support the claim that the proportion of males ages 20 to 24 who were neither in school nor working is less
In a survey of 1750 females ages 20 to 24 whose highest level of education is completing high school, 64.4% were employed. In a survey of 2000 males ages 20 to 24 whose highest level of education is completing high school, 73.2% were employed. At α = 0.01, can you support the claim that there is a
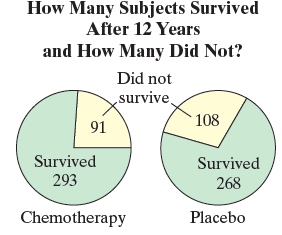
In a study, 760 men with recurrent prostate cancer underwent radiation with or without a type of hormone-based chemotherapy. For 24 months, 384 subjects were given the chemotherapy and 376 subjects were given a placebo. The numbers who survived and did not survive after 12 years were tracked. The
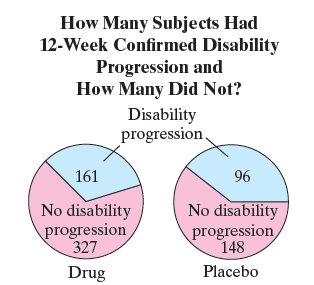
In a study to determine the effectiveness of using a drug to treat multiple sclerosis, 488 subjects were given the drug and 244 subjects were given a placebo. The numbers of subjects who had 12-week confirmed disability progression were tracked. The results are shown at the left. At a = 0.01, can
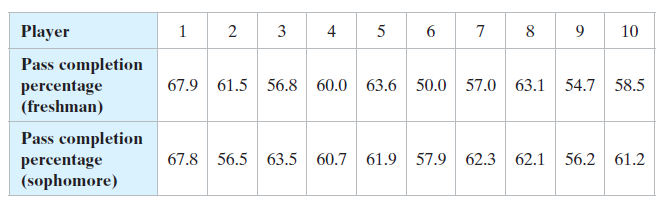
In Exercise 18, use technology to perform the hypothesis test with a P-value. Compare your result with the result obtained using rejection regions. Are they the same?Data from Exercise 18:The pass completion percentages of 10 college football quarterbacks for their freshman and sophomore seasons
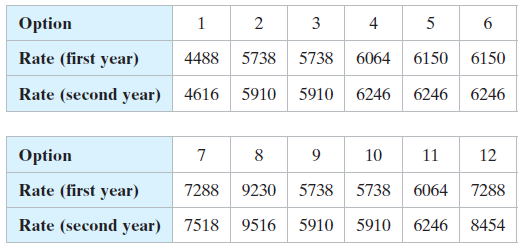
In Exercise 15, use technology to perform the hypothesis test with a P-value. Compare your result with the result obtained using rejection regions. Are they the same?Data from Exercise 15:A college administrator suggests that student housing rates have increased from one academic year to the next.
The pass completion percentages of 10 college football quarterbacks for their freshman and sophomore seasons are shown in the table below. At α = 0.10, is there enough evidence to support the claim that the pass completion percentages have changed?(a) Identify the claim and state H0 and
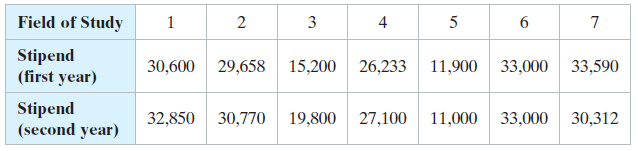
An education researcher claims that stipends for PhD students have increased from one academic year to the next. The table shows the PhD stipends (in dollars per academic year) for seven different fields of study at various institutions in two consecutive academic years. At α = 0.05, is there
A college administrator suggests that student housing rates have increased from one academic year to the next. The table shows the rates (in dollars per academic year) for 12 student housing arrangement options in two consecutive academic years. At α = 0.05, is there enough evidence to support the
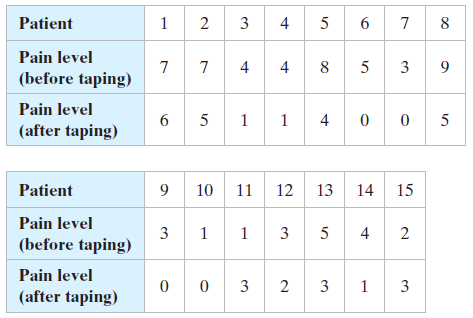
A physical therapist claims that the use of a specific type of therapeutic tape reduces pain in patients with chronic tennis elbow. The table shows the pain levels on a scale of 0 to 10, where 0 is no pain and 10 is the worst pain possible, for 15 patients with chronic tennis elbow when holding a 1
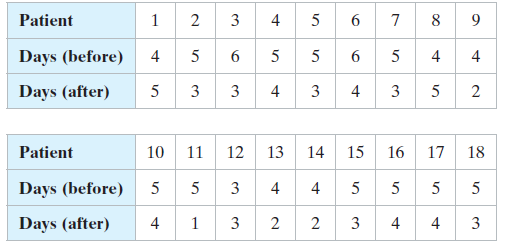
A physical therapist suggests that soft tissue massage therapy helps to reduce the numbers of days per week patients suffer from headaches. The table shows the numbers of days per week 18 patients suffered from headaches before and after 6 weeks of receiving massage therapy. At α = 0.01, is there
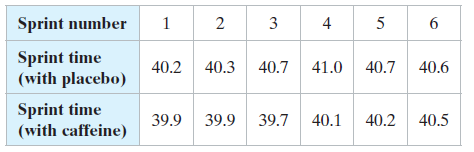
A researcher claims that caffeine ingestion improves repeated freestyle sprints in trained male swimmers. The table shows the mean performance times (in seconds) for a group of trained male swimmers who complete six 75-meter maximal freestyle sprints after ingesting a placebo and after ingesting
A stock market analyst claims that seven of the stocks that make up the Dow Jones Industrial Average lost value from one hour to the next on one business day. The table shows the prices (in dollars per share) of the seven stocks at one time during the day and then an hour later. At α = 0.01, is
Explain what the symbols d̅ and sd represent.
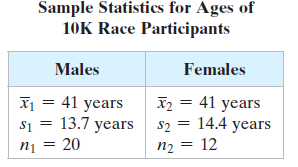
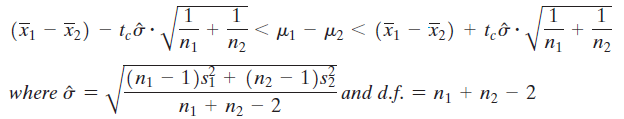
To compare the mean ages of male and female participants in a 10K race, you randomly select several ages from both sexes. The results are shown below. Construct a 95% confidence interval for the difference in mean ages of male and female participants in the race.When the sampling distribution for
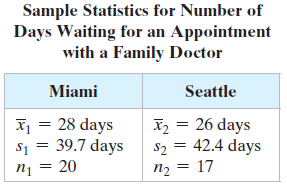
To compare the mean number of days spent waiting to see a family doctor for two large cities, you randomly select several people in each city who have had an appointment with a family doctor. The results are shown at the left. Construct a 90% confidence interval for the difference in mean number of
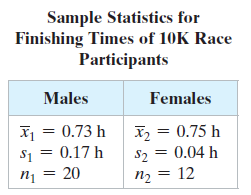
To compare the mean finishing times of male and female participants in a 10K race, you randomly select several finishing times from both sexes. The results are shown at the left. Construct an 80% confidence interval for the difference in mean finishing times of male and female participants in the
A demographics researcher claims that the mean household income in a recent year is the same in Ada County, Idaho, and Cameron Parish, Louisiana. In Ada County, a sample of 18 residents has a mean household income of $58,300 and a standard deviation of $9000. In Cameron Parish, a sample of 20
A demographics researcher claims that the mean household income in a recent year is greater in Cuyahoga County, Ohio, than it is in Wayne County, Michigan. In Cuyahoga County, a sample of 19 residents has a mean household income of $45,600 and a standard deviation of $2800. In Wayne County, a
A marine biologist claims that the mean fork length (see figure at the left) of yellowfin tuna is different in two zones in the eastern tropical Pacific Ocean. A sample of 26 yellowfin tuna collected in Zone A has a mean fork length of 76.2 centimeters and a standard deviation of 16.5 centimeters.
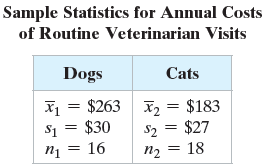
A pet association claims that the mean annual costs of routine veterinarian visits for dogs and cats are the same. The results for samples of the two types of pets are shown at the left. At α = 0.10, can you reject the pet association’s claim? Assume the population variances are equal.(a)
Test the claim about the difference between two population means μ1 and μ2 at the level of significance a. Assume the samples are random and independent, and the populations are normally distributed.Claim: μ1 > μ2; α = 0.01. Assume σ12 ≠ σ22Sample statistics: x̅1 = 52, s1 = 4.8, n1 =
Test the claim about the difference between two population means μ1 and μ2 at the level of significance a. Assume the samples are random and independent, and the populations are normally distributed.Claim: μ1 ≤ μ2; α = 0.05. Assume σ12 ≠ σ22Sample statistics: x̅1 = 2410, σ1 = 175, n1 =
Test the claim about the difference between two population means μ1 and μ2 at the level of significance a. Assume the samples are random and independent, and the populations are normally distributed.Claim: μ1 < μ2; α = 0.10. Assume σ12 = σ22Sample statistics: x̅1 = 0.345, s1 = 0.305, n1
Test the claim about the difference between two population means μ1 and μ2 at the level of significance a. Assume the samples are random and independent, and the populations are normally distributed.Claim: μ1 = μ2; α = 0.01. Assume σ12 = σ22Sample statistics: x̅1 = 33.7, s1 = 3.5, n1 = 12
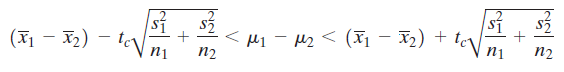
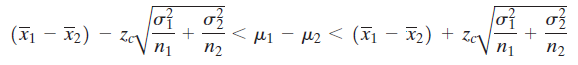
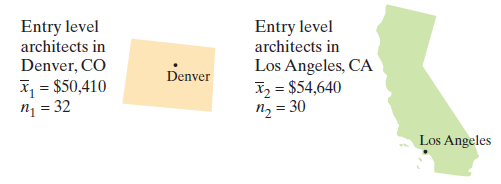
Construct a 99% confidence interval for the difference between the mean annual salaries of entry level architects in Denver, Colorado, and Los Angeles, California, using the data from Exercise 28.You can construct a confidence interval for the difference between two population means μ1 - μ2, as
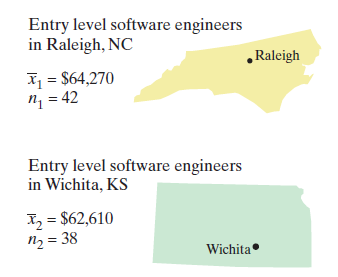
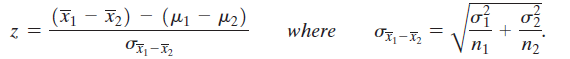
Construct a 95% confidence interval for the difference between the mean annual salaries of entry level software engineers in Raleigh, North Carolina, and Wichita, Kansas, using the data from Exercise 27.You can construct a confidence interval for the difference between two population means μ1 -
Is the difference between the mean annual salaries of entry level architects in Denver, Colorado, and Los Angeles, California, equal to $10,000? To decide, you select a random sample of entry level architects from each city. The results of each survey are shown in the figure. Assume the population
Is the difference between the mean annual salaries of entry level software engineers in Raleigh, North Carolina, and Wichita, Kansas, more than $2000? To decide, you select a random sample of entry level software engineers from each city. The results of each survey are shown in the figure at the
Explain why the null hypothesis H0: μ1 ≥ μ2 is equivalent to the null hypothesis H0: μ1 = μ2 ≥ 0.
Explain why the null hypothesis H0: μ1 = μ2 is equivalent to the null hypothesis H0: μ1 - μ2 = 0.
Showing 1600 - 1700
of 2934
First
10
11
12
13
14
15
16
17
18
19
20
21
22
23
24
Last
Step by Step Answers