New Semester
Started
Get
50% OFF
Study Help!
--h --m --s
Claim Now
Question Answers
Textbooks
Find textbooks, questions and answers
Oops, something went wrong!
Change your search query and then try again
S
Books
FREE
Study Help
Expert Questions
Accounting
General Management
Mathematics
Finance
Organizational Behaviour
Law
Physics
Operating System
Management Leadership
Sociology
Programming
Marketing
Database
Computer Network
Economics
Textbooks Solutions
Accounting
Managerial Accounting
Management Leadership
Cost Accounting
Statistics
Business Law
Corporate Finance
Finance
Economics
Auditing
Tutors
Online Tutors
Find a Tutor
Hire a Tutor
Become a Tutor
AI Tutor
AI Study Planner
NEW
Sell Books
Search
Search
Sign In
Register
study help
mathematics
elementary statistics picturing
Elementary Statistics Picturing The World 7th Edition Ron Larson, Betsy Farber - Solutions
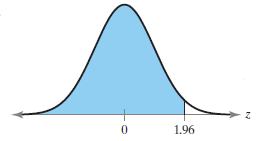
Find the probability of z occurring in the shaded region of the standard normal distribution. If convenient, use technology to find the probability. 1.96
The test scores for the Law School Admission Test (LSAT) are normally distributed. In a recent year, the mean test score was 155.69 and the standard deviation was 5.05. The test scores of four students selected at random are 168, 161, 144, and 155.(a) Find the z-score that corresponds to each value
The test scores for the verbal reasoning and the quantitative reasoning sections of the Graduate Record Examination (GRE) are normally distributed. In a recent year, the mean test score was 150 and the standard deviation was 8.75. The test scores of four students selected at random are 162, 168,
Find the indicated area under the standard normal curve. If convenient, use technology to find the area.To the left of z = -1.44 and to the right of z = 2.21
Find the indicated area under the standard normal curve. If convenient, use technology to find the area.To the left of z = -1.28 and to the right of z = 1.28
Find the indicated area under the standard normal curve. If convenient, use technology to find the area.Between z = -2.33 and z = 2.33
Find the indicated area under the standard normal curve. If convenient, use technology to find the area.Between z = -1.55 and z = 1.55
Find the indicated area under the standard normal curve. If convenient, use technology to find the area.Between z = -1.53 and z = 0
Find the indicated area under the standard normal curve. If convenient, use technology to find the area.Between z = 0 and z = 2.86
Find the indicated area under the standard normal curve. If convenient, use technology to find the area.To the right of z = 1.485
Find the indicated area under the standard normal curve. If convenient, use technology to find the area.To the right of z = -0.355
Find the indicated area under the standard normal curve. If convenient, use technology to find the area.To the right of z = 3.25
Find the indicated area under the standard normal curve. If convenient, use technology to find the area.To the right of z = -0.65
Find the indicated area under the standard normal curve. If convenient, use technology to find the area.To the left of z = 1.365
Find the indicated area under the standard normal curve. If convenient, use technology to find the area.To the left of z = -2.575
Find the indicated area under the standard normal curve. If convenient, use technology to find the area.To the left of z = -3.16
Find the indicated area under the standard normal curve. If convenient, use technology to find the area.To the left of z = 0.17
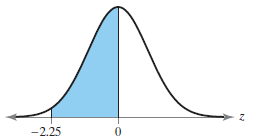
Find the area of the shaded region under the standard normal curve. If convenient, use technology to find the area. -2.25
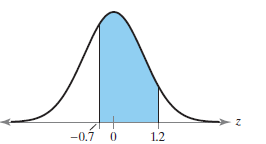
Find the area of the shaded region under the standard normal curve. If convenient, use technology to find the area. Л. -0.7 0 1.2
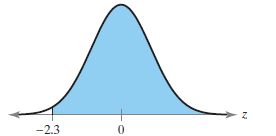
Find the area of the shaded region under the standard normal curve. If convenient, use technology to find the area. -2.3
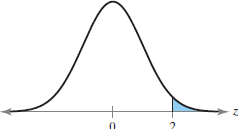
Find the area of the shaded region under the standard normal curve. If convenient, use technology to find the area.
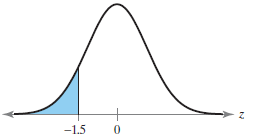
Find the area of the shaded region under the standard normal curve. If convenient, use technology to find the area. -1.5
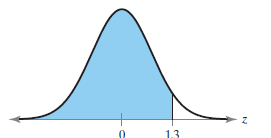
Find the area of the shaded region under the standard normal curve. If convenient, use technology to find the area. 1.3
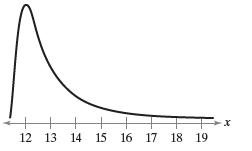
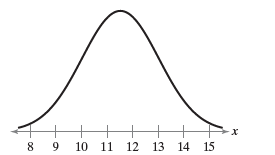
Determine whether the graph could represent a variable with a normal distribution. Explain your reasoning. If the graph appears to represent a normal distribution, estimate the mean and standard deviation. 12 13 14 15 16 17 18 19
Determine whether the graph could represent a variable with a normal distribution. Explain your reasoning. If the graph appears to represent a normal distribution, estimate the mean and standard deviation. 14 15 10 11 12 13
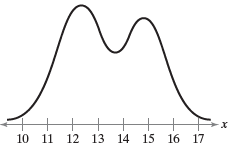
Determine whether the graph could represent a variable with a normal distribution. Explain your reasoning. If the graph appears to represent a normal distribution, estimate the mean and standard deviation. 10 11 12 13 14 15 16 17
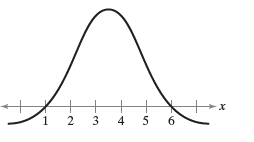
Determine whether the graph could represent a variable with a normal distribution. Explain your reasoning. If the graph appears to represent a normal distribution, estimate the mean and standard deviation. X- 3 6. 2.
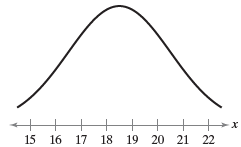
Determine whether the graph could represent a variable with a normal distribution. Explain your reasoning. If the graph appears to represent a normal distribution, estimate the mean and standard deviation. 15 16 17 18 19 20 21 22
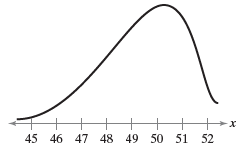
Determine whether the graph could represent a variable with a normal distribution. Explain your reasoning. If the graph appears to represent a normal distribution, estimate the mean and standard deviation. 45 46 47 48 49 50 51 52
Describe how you can transform a nonstandard normal distribution to the standard normal distribution.
What is the mean of the standard normal distribution? What is the standard deviation of the standard normal distribution?
Draw two normal curves that have different means but the same standard deviation. Describe the similarities and differences.
Draw two normal curves that have the same mean but different standard deviations. Describe the similarities and differences.
What do the inflection points on a normal distribution represent? Where do they occur?
For the same sample statistics, which level of confidence would produce the widest confidence interval? Explain your reasoning.(a) 90% (b) 95% (c) 98% (d) 99%
Which statistic is the best unbiased estimator for μ?(a) s(b) x̅ (c) the median (d) the mode
When estimating a population mean, are you more likely to be correct when you use a point estimate or an interval estimate? Explain your reasoning.
Random samples of size 8 are drawn from the population and the mean of each sample is determined. Is the sampling distribution of sample means normally distributed? Explain.The per capita disposable income for residents of a U.S. city in a recent year is normally distributed, with a mean of about
Between what two values does the middle 60% of disposable incomes lie?The per capita disposable income for residents of a U.S. city in a recent year is normally distributed, with a mean of about $44,000 and a standard deviation of about $2450.
Out of 800 residents, about how many would you expect to have a disposable income of between $40,000 and $42,000?The per capita disposable income for residents of a U.S. city in a recent year is normally distributed, with a mean of about $44,000 and a standard deviation of about $2450.
Find the probability that the disposable income of a resident is more than $45,000. Is this an unusual event? Explain.The per capita disposable income for residents of a U.S. city in a recent year is normally distributed, with a mean of about $44,000 and a standard deviation of about $2450.
A survey of U.S. adults found that 86% of those who use the Internet keep track of their online passwords in their heads. You randomly select 30 U.S. adults who use the Internet. Find the probability that the number who keep track of their online passwords in their heads is (a) Exactly
Sixty-nine percent of U.S. college graduates expect to stay at their first employer for three or more years. You randomly select 18 U.S. college graduates and ask them whether they expect to stay at their first employer for three or more years. Find the probability that the number who expect to
Find the value of x that has 64.8% of the distribution’s area to its right.The random variable x is normally distributed with mean μ = 18 and standard deviation σ = 7.6.
Find the value of x that has 88.3% of the distribution’s area to its left.The random variable x is normally distributed with mean μ = 18 and standard deviation σ = 7.6.
Find each probability.(a) P(x > 20) (b) P(0 < x < 5) (c) P(x < 9 or x > 27)The random variable x is normally distributed with mean μ = 18 and standard deviation σ = 7.6.
The mean per capita daily water consumption in a village in Bangladesh is about 83 liters per person and the standard deviation is about 11.9 liters per person. Random samples of size 50 are drawn from this population and the mean of each sample is determined.(a) Find the mean and standard
Eighty-two percent of U.S. adults think that healthy children should be required to be vaccinated to attend school. You randomly select 10 U.S. adults. Find the probability that the number of U. S. adults who think that healthy children should be required to be vaccinated to attend school
Seventy-seven percent of U.S. college students pay their bills on time. You randomly select five U.S. college students and ask them whether they pay their bills on time. The random variable represents the number of U.S. college students who pay their bills on time. (a) Construct a probability
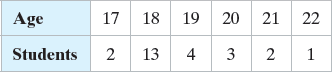
The table shows the ages of students in a freshman orientation course.(a) Construct a probability distribution.(b) Graph the probability distribution using a histogram and describe its shape.(c) Find the mean, variance, and standard deviation of the probability distribution and interpret the
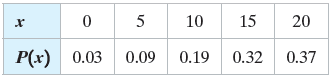
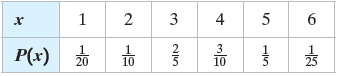
Determine whether the distribution is a probability distribution. If it is not a probability distribution, explain why.(a)(b) 5 10 15 20 0.19 0.37 0.09 P(x) 0.03 0.32 3 5 4 6. P(x) 3 10 20 10 25 3. 2.
The mean increase in the U.S. population is about four people per minute. Find the probability that the increase in the U.S. population in any given minute is (a) Exactly six people, (b) More than eight people, and (c) At most four people.Find the indicated probabilities using the
About 60% of U.S. full-time college students drank alcohol within a one-month period. You randomly select six U.S. full-time college students. Find the probability that the number of U.S. full-time college students who drank alcohol within a one-month period is (a) Exactly two, (b) At
One out of every 119 tax returns that a tax auditor examines requires an audit. Find the probability that (a) The first return requiring an audit is the 25th return the tax auditor examines, (b) The first return requiring an audit is the first or second return the tax auditor examines,
During a 10-year period, sharks killed an average of 6.1 people each year worldwide. Find the probability that the number of people killed by sharks next year is (a) exactly three, (b) more than six, and (c) at most five.Find the indicated probabilities using the geometric
A card is picked at random from a standard deck of 52 playing cards. Find the odds that it is not a spade.The chances of winning are often written in terms of odds rather than probabilities. The odds of winning is the ratio of the number of successful outcomes to the number of unsuccessful
A card is picked at random from a standard deck of 52 playing cards. Find the odds that it is a spade.The chances of winning are often written in terms of odds rather than probabilities. The odds of winning is the ratio of the number of successful outcomes to the number of unsuccessful outcomes.
The odds of an event occurring are 4 : 5. Find (a) The probability that the event will occur and (b) The probability that the event will not occur.The chances of winning are often written in terms of odds rather than probabilities. The odds of winning is the ratio of the number of
The probability of winning an instant prize game is 1/10. The odds of winning a different instant prize game are 1 : 10. You want the best chance of winning. Which game should you play? Explain your reasoning.The chances of winning are often written in terms of odds rather than probabilities. The
A beverage company puts game pieces under the caps of its drinks and claims that one in six game pieces wins a prize. The official rules of the contest state that the odds of winning a prize are 1 : 6. Is the claim “one in six game pieces wins a prize” correct? Explain your reasoning.The
The probability of randomly choosing a smoker whose mother also smoked (Assume that you are choosing from the population of all smokers.)Write a statement that represents the complement of the probability.
The probability of randomly choosing a tea drinker who has a college degree (Assume that you are choosing from the population of all tea drinkers.)Write a statement that represents the complement of the probability.
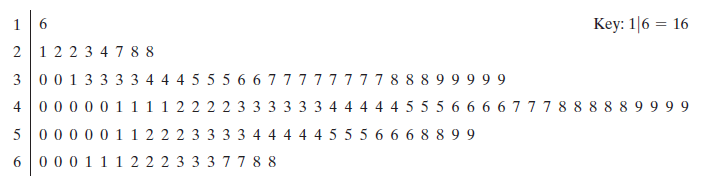
A stem-and-leaf plot for the numbers of touchdowns allowed by all 128 NCAA Division I Football Bowl Subdivision teams in the 2016–2017 season is shown. Find the probability that a team chosen at random allowed (a) At least 51 touchdowns, (b) Between 20 and 30 touchdowns, inclusive,
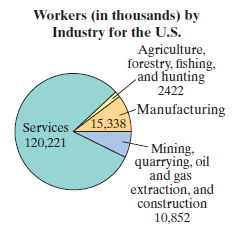
Find the probability that a worker chosen at random is not employed in the agriculture, forestry, fishing, and hunting industry.Use the pie chart at the left, which shows the number of workers (in thousands) by industry for the United States. Workers (in thousands) by Industry for the U.S.
Find the probability that a worker chosen at random is employed in the manufacturing industry.Use the pie chart at the left, which shows the number of workers (in thousands) by industry for the United States. Workers (in thousands) by Industry for the U.S. Agriculture, forestry, fishing, cand
Find the probability that a worker chosen at random is not employed in the services industry.Use the pie chart at the left, which shows the number of workers (in thousands) by industry for the United States. Workers (in thousands) by Industry for the U.S. Agriculture, forestry, fishing, cand
Find the probability that a worker chosen at random is employed in the services industry.Use the pie chart at below, which shows the number of workers (in thousands) by industry for the United States. Workers (in thousands) by Industry for the U.S. Agriculture, forestry, fishing, cand hunting 2422
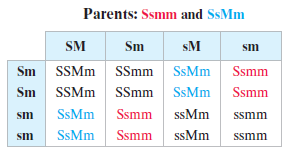
There are six basic types of coloring in registered collies: sable (SSmm), tricolor (ssmm), trifactored sable (Ssmm), blue merle (ssMm), sable merle (SSMm), and trifactored sable merle (SsMm). The Punnett square below shows the possible coloring of the offspring of a trifactored sable merle collie
Can any of the events in Exercises 75–78 be considered unusual? Explain.Data from Exercises 75-78:A doctorate. An associate’s degree.A master’s degree. A high school diploma.
Can any of the events in Exercises 49–52 be considered unusual? Explain.Data from Exercises 49-52:18 to 29 years old 30 to 44 years old45 to 64 years old 65 years old and older
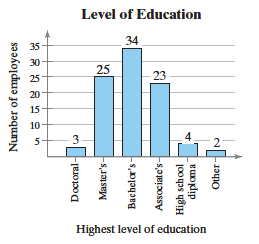
Use the bar graph at below, which shows the highest level of education received by employees of a company. Find the probability that the highest level of education for an employee chosen at random isA high school diploma. Level of Education 34 25 23 Highest level of education Number of employees
Use the bar graph at below, which shows the highest level of education received by employees of a company. Find the probability that the highest level of education for an employee chosen at random isA master’s degree Level of Education 34 25 23 Highest level of education Number of employees
Use the bar graph at below, which shows the highest level of education received by employees of a company. Find the probability that the highest level of education for an employee chosen at random isAn associate’s degree. Level of Education 34 25 23 Highest level of education Number of employees
Use the bar graph at below, which shows the highest level of education received by employees of a company. Find the probability that the highest level of education for an employee chosen at random isA doctorate. Level of Education 34 25 23 Highest level of education Number of employees Doctoral-
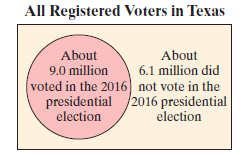
What is the probability that a registered voter in Texas chosen at random did not vote in the 2016 presidential election?Use the diagram at below. All Registered Voters in Texas About 9.0 million About 6.1 million did voted in the 2016 not vote in the presidential /2016 presidential election
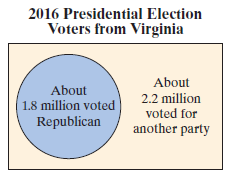
What is the probability that a voter from Virginia chosen at random voted Republican in the 2016 presidential election?Use the diagram at below. 2016 Presidential Election Voters from Virginia About About 1.8 million voted 2.2 million voted for another party Republican
What is the probability that it rains on at least one day?Use the fact that on each day, it could either be sunny or rainy.
What is the probability that it rains on exactly one day?Use the fact that on each day, it could either be sunny or rainy.
What is the probability that it rains all three days?Use the fact that on each day, it could either be sunny or rainy.
What is the probability that it is sunny all three days?Use the fact that on each day, it could either be sunny or rainy.
An access code consists of six characters. For each character, any letter or number can be used, with the exceptions that the first character cannot be 0 and the last two characters must be odd numbers.(a) What is the probability of randomly selecting the correct access code on the first try?(b)
Event D: randomly choosing a resident who is not 75 years old or older.Find the probability of the event
Event C: randomly choosing a resident who is not 14 years old or younger.Find the probability of the event
Event B: randomly choosing a resident who is not 45 to 59 years old.Find the probability of the event
Event A: randomly choosing a resident who is not 15 to 29 years old.Find the probability of the event
You think that a football team’s probability of winning its next game is about 0.80.Classify the statement as an example of classical probability, empirical probability, or subjective probability. Explain your reasoning.
The probability that a randomly selected number from 1 to 100 is divisible by 6 is 0.16.Classify the statement as an example of classical probability, empirical probability, or subjective probability. Explain your reasoning.
According to a survey, the probability that an adult chosen at random is in favor of a sprinkling ban is about 0.45.Classify the statement as an example of classical probability, empirical probability, or subjective probability. Explain your reasoning.
An analyst feels that a certain stock’s probability of decreasing in price over the next week is 0.75.Classify the statement as an example of classical probability, empirical probability, or subjective probability. Explain your reasoning.
The probability of choosing 6 numbers from 1 to 40 that match the 6 numbers drawn by a state lottery is 1/3,838,380 ≈ 0.00000026.Classify the statement as an example of classical probability, empirical probability, or subjective probability. Explain your reasoning.
According to company records, the probability that a washing machine will need repairs during a six-year period is 0.10.Classify the statement as an example of classical probability, empirical probability, or subjective probability. Explain your reasoning.
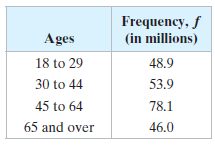
Use the frequency distribution at the left, which shows the number of voting-age American citizens (in millions) by age, to find the probability that a citizen chosen at random is in the age range.65 years old and older Frequency, f (in millions) Ages 18 to 29 48.9 30 to 44 53.9 45 to 64 78.1 65
Use the frequency distribution at the left, which shows the number of voting-age American citizens (in millions) by age, to find the probability that a citizen chosen at random is in the age range.45 to 64 years old Frequency, f (in millions) Ages 18 to 29 48.9 30 to 44 53.9 45 to 64 78.1 65 and
Use the frequency distribution at the left, which shows the number of voting-age American citizens (in millions) by age, to find the probability that a citizen chosen at random is in the age range.30 to 44 years old Frequency, f (in millions) Ages 18 to 29 48.9 30 to 44 53.9 45 to 64 78.1 65 and
Use the frequency distribution at below, which shows the number of voting-age American citizens (in millions) by age, to find the probability that a citizen chosen at random is in the age range.18 to 29 years old Frequency, f (in millions) Ages 18 to 29 48.9 30 to 44 53.9 45 to 64 78.1 65 and over
What is the probability that the next person asked has two tattoos?Use the frequency distribution.
What is the probability that the next person asked does not have a tattoo?Use the frequency distribution.
Probability experiment consists of rolling a 12-sided die, numbered 1 to 12. Find the probability of the event.Event F: rolling a number divisible by 5
Probability experiment consists of rolling a 12-sided die, numbered 1 to 12. Find the probability of the event.Event E: rolling a number divisible by 3
Probability experiment consists of rolling a 12-sided die, numbered 1 to 12. Find the probability of the event.Event D: rolling a number less than 8
Showing 2200 - 2300
of 2934
First
16
17
18
19
20
21
22
23
24
25
26
27
28
29
30
Step by Step Answers