New Semester
Started
Get
50% OFF
Study Help!
--h --m --s
Claim Now
Question Answers
Textbooks
Find textbooks, questions and answers
Oops, something went wrong!
Change your search query and then try again
S
Books
FREE
Study Help
Expert Questions
Accounting
General Management
Mathematics
Finance
Organizational Behaviour
Law
Physics
Operating System
Management Leadership
Sociology
Programming
Marketing
Database
Computer Network
Economics
Textbooks Solutions
Accounting
Managerial Accounting
Management Leadership
Cost Accounting
Statistics
Business Law
Corporate Finance
Finance
Economics
Auditing
Tutors
Online Tutors
Find a Tutor
Hire a Tutor
Become a Tutor
AI Tutor
AI Study Planner
NEW
Sell Books
Search
Search
Sign In
Register
study help
mathematics
elementary statistics picturing
Elementary Statistics Picturing The World 7th Edition Ron Larson, Betsy Farber - Solutions
Repeat Exercise 20 for samples of size 72 and 108. What happens to the mean and the standard deviation of the distribution of sample means as the sample size increases?Data from exercise 20:The scores for females on the critical reading portion of the SAT in 2016 are normally distributed, with a
Repeat Exercise 19 for samples of size 40 and 60. What happens to the mean and the standard deviation of the distribution of sample means as the sample size increases?Data from exercise 19:The scores for males on the critical reading portion of the SAT in 2016 are normally distributed, with a mean
The annual salary for clinical pharmacists is normally distributed, with a mean of about $111,000 and a standard deviation of about $13,000. Random samples of 48 are drawn from this population, and the mean of each sample is determined.Find the mean and standard deviation of the indicated sampling
The annual salary for senior-level chemical engineers is normally distributed, with a mean of about $132,000 and a standard deviation of about $18,000. Random samples of 35 are drawn from this population, and the mean of each sample is determined.Find the mean and standard deviation of the
The amounts of cold water for patient consumption in hospitals in Spain are normally distributed, with a mean of 196 cubic meters per bed and a standard deviation of 70 cubic meters per bed. Random samples of size 15 are drawn from this population, and the mean of each sample is determined.Find the
A water footprint is a measure of the appropriation of fresh water. The per capita water footprint in the United States for a recent year is approximately normally distributed, with a mean of 1.64 mega gallons and a standard deviation of 2.89 mega gallons. Random samples of size 12 are drawn from
The monthly growing season precipitation across villages in Tanzania is normally distributed, with a mean of 87 centimeters and a standard deviation of 14.5 centimeters. Random samples of size 30 are drawn from this population, and the mean of each sample is determined.Find the mean and standard
The monthly growing season temperatures across villages in Tanzania are normally distributed, with a mean of 23°C and a standard deviation of 1.3°C. Random samples of size 25 are drawn from this population, and the mean of each sample is determined.Find the mean and standard deviation of the
The scores for males on the critical reading portion of the SAT in 2016 are normally distributed, with a mean of 495 and a standard deviation of 120. Random samples of size 20 are drawn from this population, and the mean of each sample is determined.Find the mean and standard deviation of the
The lifetimes (in hours) of four diamond-tipped cutting tools are 70, 85, 81, and 67. Use a sample size of 3.A population and sample size are given.(a) Find the mean and standard deviation of the population.(b) List all samples (with replacement) of the given size from the population and find the
The melting points (in degrees Celsius) of three industrial lubricants are 350, 399, and 418. Use a sample size of 3.A population and sample size are given.(a) Find the mean and standard deviation of the population.(b) List all samples (with replacement) of the given size from the population and
The diameters (in inches) of four machine parts are 1.000, 1.004, 1.001, and 1.003. Use a sample size of 2.A population and sample size are given.(a) Find the mean and standard deviation of the population.(b) List all samples (with replacement) of the given size from the population and find the
The load-bearing capacities (in thousands of pounds) of five transmission line insulators are 64, 48, 19, 79, and 56. Use a sample size of 2.A population and sample size are given.(a) Find the mean and standard deviation of the population.(b) List all samples (with replacement) of the given size
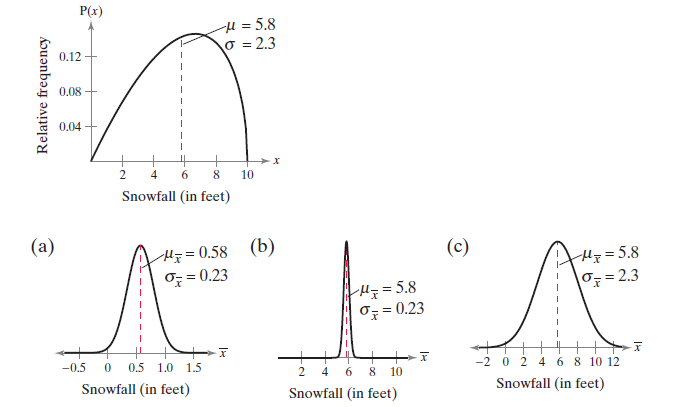
The graph of a population distribution is shown with its mean and standard deviation. Random samples of size 100 are drawn from the population. Determine which of the figures labeled (a)–(c) would most closely resemble the sampling distribution of sample means. Explain your reasoning.The annual
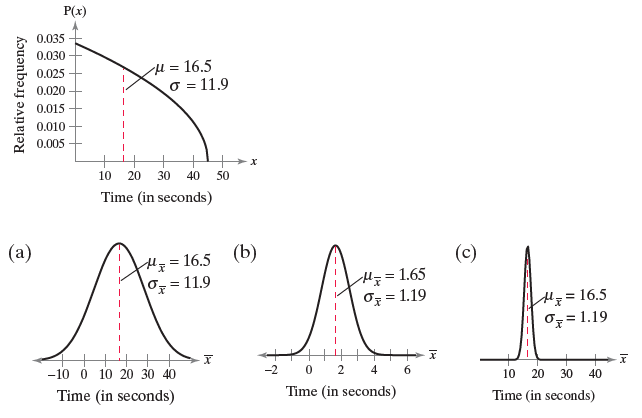
The graph of a population distribution is shown with its mean and standard deviation. Random samples of size 100 are drawn from the population. Determine which of the figures labeled (a)–(c) would most closely resemble the sampling distribution of sample means. Explain your reasoning.The waiting
If the sample size is at least 30, then you can use z-scores to determine the probability that a sample mean falls in a given interval of the sampling distribution.Determine whether the statement is true or false. If it is false, rewrite it as a true statement.
A sampling distribution is normal only when the population is normal.Determine whether the statement is true or false. If it is false, rewrite it as a true statement.
As the sample size increases, the standard deviation of the distribution of sample means increases.Determine whether the statement is true or false. If it is false, rewrite it as a true statement.
As the sample size increases, the mean of the distribution of sample means increases.Determine whether the statement is true or false. If it is false, rewrite it as a true statement.
A population has a mean μ and a standard deviation σ. Find the mean and standard deviation of the sampling distribution of sample means with sample size n.μ = 1275, σ = 6, n = 1000
A population has a mean μ and a standard deviation σ. Find the mean and standard deviation of the sampling distribution of sample means with sample size n.μ = 790, σ = 48, n = 250
A population has a mean μ and a standard deviation σ. Find the mean and standard deviation of the sampling distribution of sample means with sample size n.μ = 45, σ = 15, n = 100
A population has a mean μ and a standard deviation σ. Find the mean and standard deviation of the sampling distribution of sample means with sample size n.μ = 150, σ = 25, n = 50
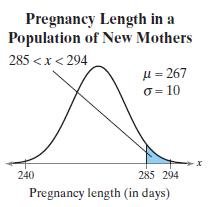
The pregnancy length (in days) for a population of new mothers can be approximated by a normal distribution, with a mean of 267 days and a standard deviation of 10 days. (a) What is the minimum pregnancy length that can be in the top 10% of pregnancy lengths?(b) What is the maximum pregnancy
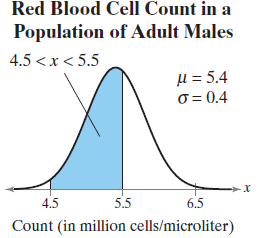
The red blood cell counts (in millions of cells per microliter) for a population of adult males can be approximated by a normal distribution, with a mean of 5.4 million cells per microliter and a standard deviation of 0.4 million cells per microliter.(a) What is the minimum red blood cell count
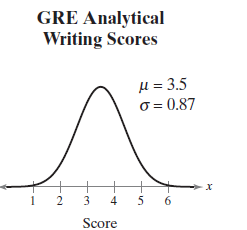
The test scores for the analytical writing section of the Graduate Record Examination (GRE) can be approximated by a normal distribution, as shown in the figure. (a) What is the maximum score that can be in the bottom 10% of scores?(b) Between what two values does the middle 80% of the scores
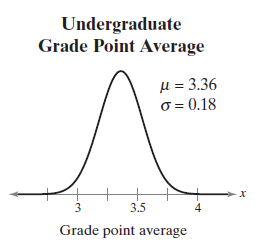
The undergraduate grade point averages (UGPA) of students taking the Law School Admission Test in a recent year can be approximated by a normal distribution, as shown in the figure. (a) What is the minimum UGPA that would still place a student in the top 5% of UGPAs?(b) Between what two values
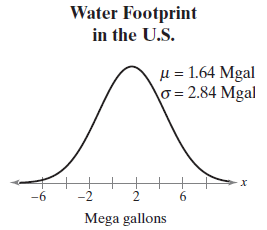
A water footprint is a measure of the appropriation of fresh water. The per capita water footprint (in mega gallons) in the U.S. for a recent year can be approximated by a normal distribution, as shown in the figure. (a) What water footprint represents the 80th percentile?(b) What water
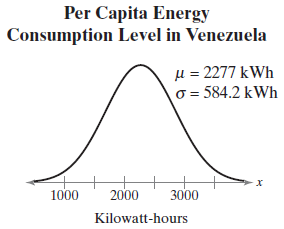
The per capita energy consumption level (in kilowatt-hours) in Venezuela for a recent year can be approximated by a normal distribution, as shown in the figure.(a) What consumption level represents the 5th percentile?(b) What consumption level represents the 17th percentile?(c) What consumption
In a recent study on world happiness, participants were asked to evaluate their current lives on a scale from 0 to 10, where 0 represents the worst possible life and 10 represents the best possible life. The mean response was 5.4 with a standard deviation of 2.2. (a) What response represents
Find the positive z-score for which 12% of the distribution’s area lies between -z and z.Find the indicated z-score.
Find the positive z-score for which 80% of the distribution’s area lies between -z and z.Find the indicated z-score.
Find the z-score that has 84.1345% of the distribution’s area to its right.Find the indicated z-score.
Find the z-score that has 2.275% of the distribution’s area to its left.Find the indicated z-score.
Find the z-score that has 20.9% of the distribution’s area to its right.Find the indicated z-score.
Find the z-score that has 63.7% of the distribution’s area to its right.Find the indicated z-score.
Find the z-score that has 78.5% of the distribution’s area to its left.Find the indicated z-score.
Find the z-score that has 11.9% of the distribution’s area to its left.Find the indicated z-score.
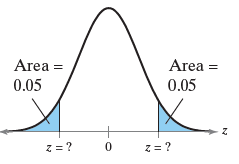
Find the indicated z-score(s) shown in the graph. Area = 0.05 Area = 0.05 z= ?
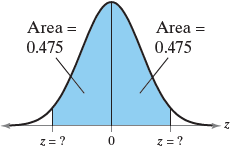
Find the indicated z-score(s) shown in the graph. Area = Area = 0.475 0.475 z= ?
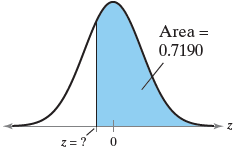
Find the indicated z-score(s) shown in the graph. Area = 0.7190 Z= ?
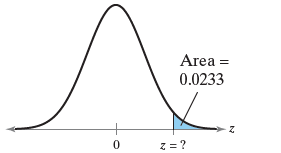
Find the indicated z-score(s) shown in the graph. Area = 0.0233
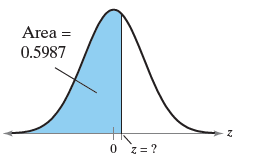
Find the indicated z-score(s) shown in the graph. Area = 0.5987 0 z= ?
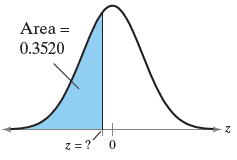
Find the indicated z-score(s) shown in the graph. Area = 0.3520 z = ? 0
Use the Standard Normal Table or technology to find the z-score that corresponds to the cumulative area or percentile.P75
Use the Standard Normal Table or technology to find the z-score that corresponds to the cumulative area or percentile.P91
Use the Standard Normal Table or technology to find the z-score that corresponds to the cumulative area or percentile.P40
Use the Standard Normal Table or technology to find the z-score that corresponds to the cumulative area or percentile.P25
Use the Standard Normal Table or technology to find the z-score that corresponds to the cumulative area or percentile.P67
Use the Standard Normal Table or technology to find the z-score that corresponds to the cumulative area or percentile.P88
Use the Standard Normal Table or technology to find the z-score that corresponds to the cumulative area or percentile.P30
Use the Standard Normal Table or technology to find the z-score that corresponds to the cumulative area or percentile.P15
Use the Standard Normal Table or technology to find the z-score that corresponds to the cumulative area or percentile.0.0046
Use the Standard Normal Table or technology to find the z-score that corresponds to the cumulative area or percentile.0.94
Use the Standard Normal Table or technology to find the z-score that corresponds to the cumulative area or percentile.0.85
Use the Standard Normal Table or technology to find the z-score that corresponds to the cumulative area or percentile.0.05
Use the Standard Normal Table or technology to find the z-score that corresponds to the cumulative area or percentile.0.7995
Use the Standard Normal Table or technology to find the z-score that corresponds to the cumulative area or percentile.0.6736
Use the Standard Normal Table or technology to find the z-score that corresponds to the cumulative area or percentile.0.4364
Use the Standard Normal Table or technology to find the z-score that corresponds to the cumulative area or percentile.0.2090
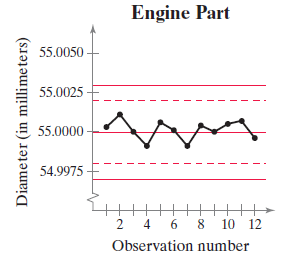
An engine part has been designed to have a diameter of 55 millimeters. The standard deviation of the process is 0.001 millimeter.A control chart is shown. Each chart has horizontal lines drawn at the mean μ, at μ ± 2σ, and at m ± 3σ. Determine whether the process shown is in control or out of
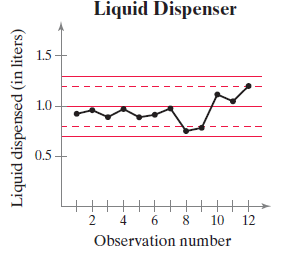
A liquid-dispensing machine has been designed to fill bottles with 1 liter of liquid. The standard deviation of the process is 0.1 liter.A control chart is shown. Each chart has horizontal lines drawn at the mean μ, at μ ± 2σ, and at m ± 3σ. Determine whether the process shown is in control
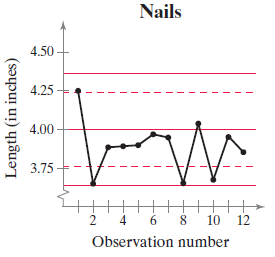
A nail has been designed to have a length of 4 inches. The standard deviation of the process is 0.12 inch.A control chart is shown. Each chart has horizontal lines drawn at the mean μ, at μ ± 2σ, and at m ± 3σ. Determine whether the process shown is in control or out of control. Explain.
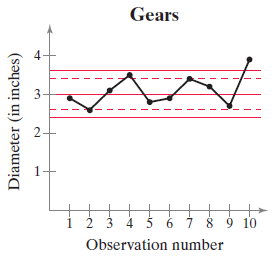
A gear has been designed to have a diameter of 3 inches. The standard deviation of the process is 0.2 inch.A control chart is shown. Each chart has horizontal lines drawn at the mean μ, at μ ± 2σ, and at m ± 3σ. Determine whether the process shown is in control or out of control. Explain.
Use the normal distribution in Exercise 16.(a) What percent of the adult males have a red blood cell count less than 6 million cells per microliter?(b) What percent of the adult males have a red blood cell count between 4.7 and 5.3 million cells per microliter?(c) Out of 200 randomly selected adult
Use the normal distribution in Exercise 15.Data from Exercise 15:(a) What percent of the new mothers had a pregnancy length of less than 290 days?(b) What percent of the new mothers had a pregnancy length of between 260 and 300 days?(c) Out of 250 randomly selected new mothers, about how many would
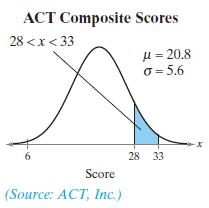
Use the normal distribution in Exercise 14. Data from exercise 14:(a) What percent of the ACT composite scores are less than 19?(b) Out of 1500 randomly selected ACT composite scores, about how many would you expect to be greater than 21? ACT Composite Scores 28
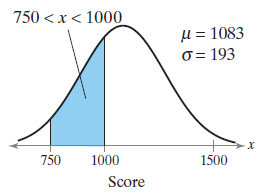
Use the normal distribution in Exercise 13.(a) What percent of the SAT total scores are less than 1300?(b) Out of 1000 randomly selected SAT total scores, about how many would you expect to be greater than 1100?Answer the questions about the specified normal distribution.Data from the exercise 13:
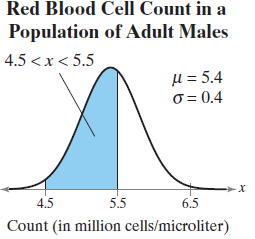
A member is selected at random from the population represented by the graph. Find the probability that the member selected at random is from the shaded region of the graph. Assume the variable x is normally distributed. Red Blood Cell Count in a Population of Adult Males 4.5
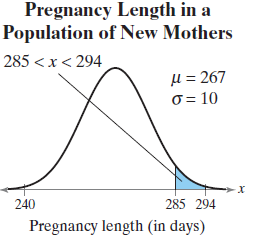
A member is selected at random from the population represented by the graph. Find the probability that the member selected at random is from the shaded region of the graph. Assume the variable x is normally distributed. Pregnancy Length in a Population of New Mothers 285
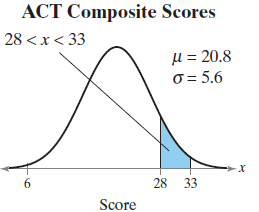
A member is selected at random from the population represented by the graph. Find the probability that the member selected at random is from the shaded region of the graph. Assume the variable x is normally distributed. ACT Composite Scores 28
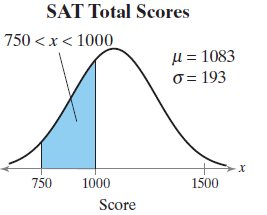
A member is selected at random from the population represented by the graph. Find the probability that the member selected at random is from the shaded region of the graph. Assume the variable x is normally distributed. SAT Total Scores 750
The amounts of time per workout an athlete uses a stairclimber are normally distributed, with a mean of 20 minutes and a standard deviation of 5 minutes. Find the probability that a randomly selected athlete uses a stair climber for (a) Less than 17 minutes, (b) Between 20 and 28 minutes,
In a recent year, the MCAT scores for the critical analysis and reasoning skills portion of the test were normally distributed, with a mean of 124.9 and a standard deviation of 3.0. Find the probability that a randomly selected medical student who took the MCAT has a critical analysis and reasoning
In a recent year, the MCAT total scores were normally distributed, with a mean of 500 and a standard deviation of 10.6. Find the probability that a randomly selected medical student who took the MCAT has a total score that is (a) Less than 489, (b) Between 495 and 507, and (c) More
In a survey of U.S. women, the heights in the 20- to 29-year age group were normally distributed, with a mean of 64.2 inches and a standard deviation of 2.9 inches. Find the probability that a randomly selected study participant has a height that is (a) Less than 56.5 inches, (b) Between
In a recent study on world happiness, participants were asked to evaluate their current lives on a scale from 0 to 10, where 0 representsthe worst possible life and 10 represents the best possible life. The responses were normally distributed, with a mean of 5.4 and a standard deviation of 2.2.
The random variable x is normally distributed with mean μ = 174 and standard deviation σ = 20. Find the indicated probability.P(172 < x < 192)
The random variable x is normally distributed with mean μ = 174 and standard deviation σ = 20. Find the indicated probability.P(160 < x < 170)
The random variable x is normally distributed with mean μ = 174 and standard deviation σ = 20. Find the indicated probability.P(x > 155)
The random variable x is normally distributed with mean μ = 174 and standard deviation σ = 20. Find the indicated probability.P(x > 182)
The random variable x is normally distributed with mean μ = 174 and standard deviation σ = 20. Find the indicated probability.P(x < 200)
The random variable x is normally distributed with mean μ = 174 and standard deviation σ = 20. Find the indicated probability.P(x < 170)
Find the indicated probability using the standard normal distribution. If convenient, use technology to find the probability.P(z < -1.22 or z > 1.32)
Find the indicated probability using the standard normal distribution. If convenient, use technology to find the probability.P(z < -2.58 or z > 2.58)
Find the indicated probability using the standard normal distribution. If convenient, use technology to find the probability.P( -1.54 < z < 1.54)
Find the indicated probability using the standard normal distribution. If convenient, use technology to find the probability.P( -1.78 < z < 1.78)
Find the indicated probability using the standard normal distribution. If convenient, use technology to find the probability.P(0 < z < 0.525)
Find the indicated probability using the standard normal distribution. If convenient, use technology to find the probability.P(-0.89 < z < 0)
What is the total area under the normal curve?
In a normal distribution, which is greater, the mean or the median Explain.
Find the indicated probability using the standard normal distribution. If convenient, use technology to find the probability.P(z > -1.85)
Find the indicated probability using the standard normal distribution. If convenient, use technology to find the probability.P(z > 2.175)
Find the indicated probability using the standard normal distribution. If convenient, use technology to find the probability.P(z < -0.18)
Find the indicated probability using the standard normal distribution. If convenient, use technology to find the probability.P(z < 1.16)
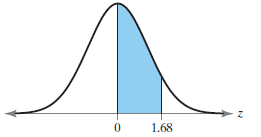
Find the probability of z occurring in the shaded region of the standard normal distribution. If convenient, use technology to find the probability. 1.68
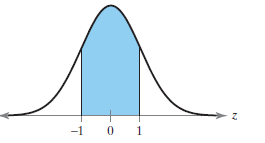
Find the probability of z occurring in the shaded region of the standard normal distribution. If convenient, use technology to find the probability. -1 0 1
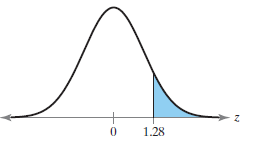
Find the probability of z occurring in the shaded region of the standard normal distribution. If convenient, use technology to find the probability. 1.28
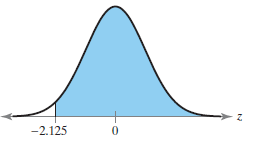
Find the probability of z occurring in the shaded region of the standard normal distribution. If convenient, use technology to find the probability. -2.125
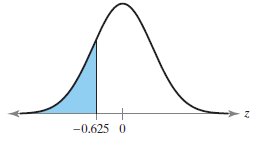
Find the probability of z occurring in the shaded region of the standard normal distribution. If convenient, use technology to find the probability. -0.625 0
Showing 2100 - 2200
of 2934
First
15
16
17
18
19
20
21
22
23
24
25
26
27
28
29
Last
Step by Step Answers