New Semester
Started
Get
50% OFF
Study Help!
--h --m --s
Claim Now
Question Answers
Textbooks
Find textbooks, questions and answers
Oops, something went wrong!
Change your search query and then try again
S
Books
FREE
Study Help
Expert Questions
Accounting
General Management
Mathematics
Finance
Organizational Behaviour
Law
Physics
Operating System
Management Leadership
Sociology
Programming
Marketing
Database
Computer Network
Economics
Textbooks Solutions
Accounting
Managerial Accounting
Management Leadership
Cost Accounting
Statistics
Business Law
Corporate Finance
Finance
Economics
Auditing
Tutors
Online Tutors
Find a Tutor
Hire a Tutor
Become a Tutor
AI Tutor
AI Study Planner
NEW
Sell Books
Search
Search
Sign In
Register
study help
mathematics
elementary statistics picturing
Elementary Statistics Picturing The World 7th Edition Ron Larson, Betsy Farber - Solutions
The data set represents the weights (in pounds) of 10 randomly selected black bears from northeast Pennsylvania. Assume the weights are normally distributed. 170 225 183 137 287 191 268 185 211 284(a) Find the sample mean and the
In a survey of 2096 U.S. adults, 1740 think football teams of all levels should require players who suffer a head injury to take a set amount of time off from playing to recover. (a) Find the point estimate for the population proportion.(b) Construct a 95% confidence interval for the
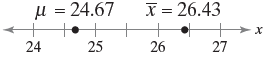
Use the values on the number line to find the sampling error. X = 26.43 µ = 24.67 + 26 25 27 24
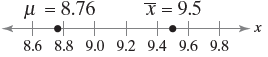
Use the values on the number line to find the sampling error. µ = 8.76 + 8.6 8.8 90 9.2 9.4 9.6 9.8 X = 9.5 х
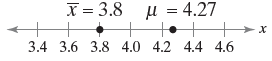
Use the values on the number line to find the sampling error. X = 3.8 u = 4.27 х + 3.4 3.6 3.8 4.0 4.2 4.4 4.6
Find the critical value zc necessary to construct a confidence interval at the level of confidence c.c = 0.97
Find the critical value zc necessary to construct a confidence interval at the level of confidence c.c = 0.75
Find the critical value zc necessary to construct a confidence interval at the level of confidence c.c = 0.85
Find the critical value zc necessary to construct a confidence interval at the level of confidence c.c = 0.80
Sixty-five percent of U.S. college graduates are employed in their field of study. You randomly select 20 U.S. college graduates and ask them whether they are employed in their field of study. Find the probability that the number who are employed in their field of study is (a) Exactly
A survey of U.S. adults found that 32% have an online account with their healthcare provider. You randomly select 70 U.S. adults and ask them whether they have an online account with their healthcare provider. Find the probability that the number who have an online account with their healthcare
Write the binomial probability in words. Then, use a continuity correction to convert the binomial probability to a normal distribution probability.P(54 < x < 64)
Write the binomial probability in words. Then, use a continuity correction to convert the binomial probability to a normal distribution probability.P(x < 60)
Write the binomial probability in words. Then, use a continuity correction to convert the binomial probability to a normal distribution probability.P(x > 14)
Write the binomial probability in words. Then, use a continuity correction to convert the binomial probability to a normal distribution probability.P(x = 45)
Write the binomial probability in words. Then, use a continuity correction to convert the binomial probability to a normal distribution probability.P(x ≤ 36)
Write the binomial probability in words. Then, use a continuity correction to convert the binomial probability to a normal distribution probability.P(x ≥ 25)
A survey of U.S. likely voters found that 11% think Congress is doing a good or excellent job. You randomly select 45 U.S. likely voters and ask them whether they think Congress is doing a good or excellent job.A binomial experiment is given. Determine whether you can use a normal distribution to
A survey of U.S. adults found that 75% support labeling legislation for genetically modified organisms (GMOs). You randomly select 20 U.S. adults and ask them whether they support labeling legislation for genetically modified organisms (GMOs).A binomial experiment is given. Determine whether you
The mean annual salary for magnetic resonance imaging (MRI) technologists is about $72,000. A random sample of 50 MRI technologists is selected. What is the probability that the mean annual salary of the sample is (a) Less than $71,500 and (b) More than $74,500? Assume σ = $10,000Find
The mean annual salary for intermediate level life insurance underwriters is about $61,000. A random sample of 45 intermediate level life insurance underwriters is selected. What is the probability that the mean annual salary of the sample is (a) Less than $60,000 and (b) More than
The mean MCAT total score in a recent year is 500. A random sample of 32 MCAT total scores is selected. What is the probability that the mean score for the sample is (a) Less than 503, (b) More than 502, and (c) Between 498 and 501? Assume σ = 10.6.Find the indicated probabilities
The mean ACT composite score in a recent year is 20.8. A random sample of 36 ACT composite scores is selected. What is the probability that the mean score for the sample is (a) Less than 21.6, (b) More than 19.8, and (c) Between 20.5 and 21.5? Assume σ = 5.6.Find the indicated
Refer to Exercise 34. A random sample of six days is selected. Find the probability that the mean surface concentration of carbonyl sulfide for the sample is (a) Between 5.1 and 15.7 picomoles per liter, (b) Between 10.5 and 12.3 picomoles per liter, and (c) More than 11.1 picomoles
Refer to Exercise 33. A random sample of 2 years is selected. Find the probability that the mean amount of black carbon emissions for the sample is (a) Less than 12.3 gigagrams per year, (b) Between 15.4 and 19.6 gigagrams per year, and (c) Greater than 17.7 gigagrams per year.
The test scores for the Law School Admission Test (LSAT) in a recent year are normally distributed, with a mean of 155.69 and a standard deviation of 5.05. Random samples of size 40 are drawn from this population, and the mean of each sample is determined.Find the mean and standard deviation of the
The per capita electric power consumption level in a recent year in Ecuador is normally distributed, with a mean of 471.5 kilowatt-hours and a standard deviation of 187.9 kilowatt-hours. Random samples of size 35 are drawn from this population, and the mean of each sample is determined.Find the
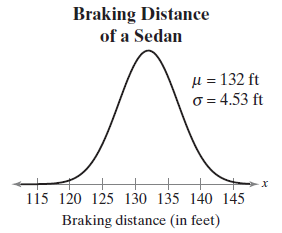
What is the longest braking distance of a sedan that can be in the bottom 20% of braking distances?On a dry surface, the braking distances (in feet), from 60 miles per hour to a complete stop, of a sedan can be approximated by a normal distribution, as shown in the figure at the left. Braking
What is the shortest braking distance of a sedan that can be in the top 15% of braking distances?On a dry surface, the braking distances (in feet), from 60 miles per hour to a complete stop, of a sedan can be approximated by a normal distribution, as shown in the figure at the left. Braking
What braking distance of a sedan represents the first quartile?On a dry surface, the braking distances (in feet), from 60 miles per hour to a complete stop, of a sedan can be approximated by a normal distribution, as shown in the figure at the left. Braking Distance of a Sedan u = 132 ft O = 4.53
What braking distance of a sedan represents the 90th percentile?On a dry surface, the braking distances (in feet), from 60 miles per hour to a complete stop, of a sedan can be approximated by a normal distribution, as shown in the figure at the left. Braking Distance of a Sedan u = 132 ft O = 4.53
Find the braking distance of a sedan that corresponds to z = 1.6.On a dry surface, the braking distances (in feet), from 60 miles per hour to a complete stop, of a sedan can be approximated by a normal distribution, as shown in the figure at the left. Braking Distance of a Sedan u = 132 ft O = 4.53
Find the braking distance of a sedan that corresponds to z = -2.75.On a dry surface, the braking distances (in feet), from 60 miles per hour to a complete stop, of a sedan can be approximated by a normal distribution, as shown in the figure at the left. Braking Distance of a Sedan u = 132 ft O =
Find the positive z-score for which 94% of the distribution’s area lies between -z and z.
Find the z-score that has 30.5% of the distribution’s area to its right.
Use the Standard Normal Table or technology to find the z-score that corresponds to the cumulative area or percentile.P46
Use the Standard Normal Table or technology to find the z-score that corresponds to the cumulative area or percentile.P85
Use the Standard Normal Table or technology to find the z-score that corresponds to the cumulative area or percentile.P2
Use the Standard Normal Table or technology to find the z-score that corresponds to the cumulative area or percentile.0.993
Use the Standard Normal Table or technology to find the z-score that corresponds to the cumulative area or percentile.0.1
Use the Standard Normal Table or technology to find the z-score that corresponds to the cumulative area or percentile.0.4721
Determine whether any of the events in Exercise 34 are unusual. Explain your reasoning.
Determine whether any of the events in Exercise 33 are unusual. Explain your reasoning.
The daily surface concentration of carbonyl sulfide on the Indian Ocean is normally distributed, with a mean of 9.1 picomoles per liter and a standard deviation of 3.5 picomoles per liter. Find the probability that on a randomly selected day, the surface concentration of carbonyl sulfide on the
Yearly amounts of black carbon emissions from cars in India are normally distributed, with a mean of 14.7 gigagrams per year and a standard deviation of 11.5 gigagrams per year. Find the probability that the amount of black carbon emissions from cars in India for a randomly selected year are(a)
Find the indicated probability using the standard normal distribution. If convenient, use technology to find the probability.P(-2015 < z < 1.55)
Find the indicated probability using the standard normal distribution. If convenient, use technology to find the probability.P(z > -0.74)
Find the indicated probability using the standard normal distribution. If convenient, use technology to find the probability.P(z < 0 or z > 1.68)
Find the indicated probability using the standard normal distribution. If convenient, use technology to find the probability.P(z < -2.50 or z > 2.50)
Find the indicated probability using the standard normal distribution. If convenient, use technology to find the probability.P(0.42 < z < 3.15)
Find the indicated probability using the standard normal distribution. If convenient, use technology to find the probability.P(z < 1.28)
Find the indicated area under the standard normal curve. If convenient, use technology to find the area.To the left of z = 0.64 and to the right of z = 3.415
Find the indicated area under the standard normal curve. If convenient, use technology to find the area.To the left of z = -1.5 and to the right of z = 1.5
Find the indicated area under the standard normal curve. If convenient, use technology to find the area.Between z = -2.68 and z = 2.68
Find the indicated area under the standard normal curve. If convenient, use technology to find the area.Between z = 0.05 and z = 1.71
Find the indicated area under the standard normal curve. If convenient, use technology to find the area.Between z = -1.55 and z = 1.04
Find the indicated area under the standard normal curve. If convenient, use technology to find the area.Between z = -1.64 and z = 0
Find the indicated area under the standard normal curve. If convenient, use technology to find the area.To the right of z = 0.015
Find the indicated area under the standard normal curve. If convenient, use technology to find the area.To the left of z = -2.825
Find the indicated area under the standard normal curve. If convenient, use technology to find the area.To the right of z = 3.22
Find the indicated area under the standard normal curve. If convenient, use technology to find the area.To the right of z = -0.57
Find the indicated area under the standard normal curve. If convenient, use technology to find the area.To the left of z = -1.95
Find the indicated area under the standard normal curve. If convenient, use technology to find the area.To the left of z = 0.33
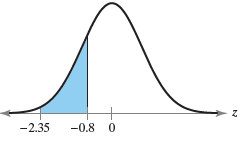
Find the area of the indicated region under the standard normal curve. If convenient, use technology to find the area. -2.35 -0.8 0
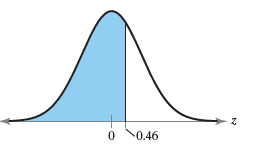
Find the area of the indicated region under the standard normal curve. If convenient, use technology to find the area. 0.46
Which normal curve has the greatest standard deviation? Explain your reasoning.Use the normal curves shown at the left.
Which normal curve has the greatest mean? Explain your reasoning.Use the normal curves shown at the left.
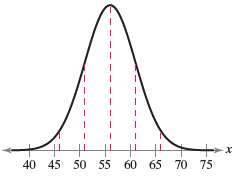
Use the normal curve to estimate the mean and standard deviation. 40 45 50 55 60 65 70 75
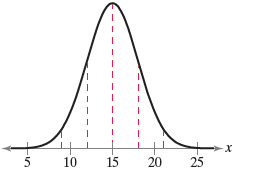
Use the normal curve to estimate the mean and standard deviation. 25 10 15 20
A survey of U.S. adults found that 8% believe the biggest problem in schools today is poor teaching. You randomly select a sample of U.S. adults. Find the probability that more than 100 U.S. adults believe the biggest problem in schools today is poor teaching. (a) You select 1000 U.S.
About 3.3% of hourly paid U.S. workers earn the prevailing minimum wage or less. A grocery chain offers discount rates to companies that have at least 30 employees who earn the prevailing minimum wage or less. Find the probability that each company will get the discount.(a) Company A has 700
Fourteen percent of U.S. college graduates want to work for a large company. You randomly select 1500 U.S. college graduates and ask them whether they want to work for a large company. Find the probability that the number who want to work for a large company is(a) Exactly 175, (b) No more than
Fifty-one percent of U.S. college graduates consider themselves underemployed. You randomly select 250 U.S. college graduates and ask them whether they consider themselves underemployed. Find the probability that the number who consider themselves underemployed is (a) No more than
A survey of U.S. adults ages 21 and older who are regular drinkers found that 38% name beer as their favorite beverage. You randomly select 25 U.S. adults ages 21 and older who are regular drinkers and ask them to name their favorite beverage. Find the probability that the number who name beer as
A survey of U.S. adults found that 33% name professional football as their favorite sport. You randomly select 14 U.S. adults and ask them to name their favorite sport. Find the probability that the number who name professional football as their favorite sport is (a) Exactly 8, (b) At
A survey of U.S. adults found that 39% of those who have online accounts use the same or very similar passwords for many of their accounts. You randomly select 500 U.S. adults who have online accounts. Find the probability that the number who use the same or very similar passwords for many of their
A survey of U.S. adults found that 28% of those who own smartphones do not use a screen lock or other security features to access their phone. You randomly select 150 U.S. adults who own smartphones. Find the probability that the number who do not use a screen lock or other security features to
A survey of U.S. adults found that 28% of those who own smartphones do not use a screen lock or other security features to access their phone. You randomly select 150 U.S. adults who own smartphones. Find the probability that the number who do not use a screen lock or other security features to
A survey of U.S. adults found that 41% have encountered fraudulent charges on their credit cards. You randomly select 100 U.S. adults. Find the probability that the number who have encountered fraudulent charges on their credit cards is (a) Exactly 40, (b) At least 40, and (c) Fewer
Sixty-five percent of parents of teenagers have taken their teenager’s cell phone or Internet privileges away as a punishment. You randomly select 10 parents of teenagers and ask them whether they have taken their teenager’s cell phone or Internet privileges away as a punishment.A binomial
In a recent year, alcohol-impaired driving was the cause of 31% of motor vehicle fatalities. You randomly select 30 motor vehicle fatalities and determine whether alcohol-impaired driving was the cause.A binomial experiment is given. Determine whether you can use a normal distribution to
Write the binomial probability in words. Then, use a continuity correction to convert the binomial probability to a normal distribution probability.P(55 < x < 60)
Write the binomial probability in words. Then, use a continuity correction to convert the binomial probability to a normal distribution probability.P(x ≤ 150)
Write the binomial probability in words. Then, use a continuity correction to convert the binomial probability to a normal distribution probability.P(x > 65)
Write the binomial probability in words. Then, use a continuity correction to convert the binomial probability to a normal distribution probability.P(x = 33)
Write the binomial probability in words. Then, use a continuity correction to convert the binomial probability to a normal distribution probability.P(x ≥ 110)
Write the binomial probability in words. Then, use a continuity correction to convert the binomial probability to a normal distribution probability.P(x < 25)
Match the binomial probability statement with its corresponding normal distribution probability statement (a)–(d) after a continuity correction.(a) P(x > 109.5)(b) P(x < 108.5)(c) P(x < 109.5)(d) P(x > 108.5)P(x < 109)
Match the binomial probability statement with its corresponding normal distribution probability statement (a)–(d) after a continuity correction.(a) P(x > 109.5)(b) P(x < 108.5)(c) P(x < 109.5)(d) P(x > 108.5)P(x ≤ 109)
Match the binomial probability statement with its corresponding normal distribution probability statement (a)–(d) after a continuity correction.(a) P(x > 109.5)(b) P(x < 108.5)(c) P(x < 109.5)(d) P(x > 108.5)P(x ≥ 109)
Match the binomial probability statement with its corresponding normal distribution probability statement (a)–(d) after a continuity correction.(a) P(x > 109.5)(b) P(x < 108.5)(c) P(x < 109.5)(d) P(x > 108.5)P(x > 109)
In a sample of 100 eruptions of the Old Faithful geyser at Yellowstone National Park, the mean interval between eruptions was 101.56 minutes and the standard deviation was 42.69 minutes. A random sample of size 30 is selected from this population. What is the probability that the mean interval
In a sample of 1000 fines issued by the city of Toronto for parking infractions, the mean fine was $47.12 and the standard deviation was $48.24. A random sample of size 55 is selected from this population. What is the probability that the mean fine is less than $50?Determine whether the finite
Assume that the carbon dioxide emissions in Exercise 32 are normally distributed. Are you more likely to randomly select 1 country with carbon dioxide emissions less than 30 metric tons or to randomly select a sample of 15 countries with mean carbon dioxide emissions less than 30 metric tons?
Assume that the childhood asthma prevalences in Exercise 31 are normally distributed. Are you more likely to randomly select 1 city with childhood asthma prevalence less than 3.2% or to randomly select a sample of 10 cities with a mean childhood asthma prevalence less than 3.2%? Explain.Data from
The mean per capita carbon dioxide emissions in 58 industrialized countries over a 22-year period is 25.5 metric tons. A random sample of 44 countries is selected. What is the probability that the mean carbon dioxide emissions for the sample is greater than 28 metric tons? Assume σ = 395.1 metric
The mean percent of childhood asthma prevalence of 43 Chinese cities is 2.25%. A random sample of 30 Chinese cities is selected. What is the probability that the mean childhood asthma prevalence for the sample is greater than 2.6%? Assume σ = 1.30%.Find the indicated probability and interpret the
From 1871 through 2016, the mean return of the Standard & Poor’s 500 was 10.72%. A random sample of 38 years is selected from this population. What is the probability that the mean return for the sample was between 9.1% and 10.3%? Assume σ = 18.60%.Find the indicated probability and
From 1975 through 2016, the mean gain of the Dow Jones Industrial Average was 456. A random sample of 32 years is selected from this population. What is the probability that the mean gain for the sample was between 200 and 500? Assume σ = 1215.Find the indicated probability and interpret the
The scores for females on the critical reading portion of the SAT in 2016 are normally distributed, with a mean of 493 and a standard deviation of 114. Random samples of size 36 are drawn from this population, and the mean of each sample is determined.
Showing 2000 - 2100
of 2934
First
14
15
16
17
18
19
20
21
22
23
24
25
26
27
28
Last
Step by Step Answers