New Semester
Started
Get
50% OFF
Study Help!
--h --m --s
Claim Now
Question Answers
Textbooks
Find textbooks, questions and answers
Oops, something went wrong!
Change your search query and then try again
S
Books
FREE
Study Help
Expert Questions
Accounting
General Management
Mathematics
Finance
Organizational Behaviour
Law
Physics
Operating System
Management Leadership
Sociology
Programming
Marketing
Database
Computer Network
Economics
Textbooks Solutions
Accounting
Managerial Accounting
Management Leadership
Cost Accounting
Statistics
Business Law
Corporate Finance
Finance
Economics
Auditing
Tutors
Online Tutors
Find a Tutor
Hire a Tutor
Become a Tutor
AI Tutor
AI Study Planner
NEW
Sell Books
Search
Search
Sign In
Register
study help
mathematics
elementary statistics picturing
Elementary Statistics Picturing The World 7th Edition Ron Larson, Betsy Farber - Solutions
A property inspector is visiting 24 properties. Six of the properties are one acre or less in size, and the rest are greater than one acre in size. Eight properties are randomly selected. Using technology, how many ways could three properties that are each one acre or less and five properties that
An environmental agency is analyzing water samples from 80 lakes for pollution. Five of the lakes have dangerously high levels of dioxin. Six lakes are randomly selected from the sample. Using technology, how many ways could one polluted lake and five nonpolluted lakes be chosen?
A floral arrangement consists of 6 different colored roses, 3 different colored carnations, and 3 different colored daisies. You can choose from 8 different colors of roses, 6 different colors of carnations, and 7 different colors of daisies. How many different arrangements are possible?
A restaurant offers a dinner special that lets you choose from 10 entrées, 8 side dishes, and 13 desserts. You can choose one entrée, one side dish, and two desserts. How many different meals are possible?
A lottery has 52 numbers. In how many different ways can 6 of the numbers be selected? (Assume that order of selection is not important.)
A class has 40 students. In how many different ways can three students form a group to work on a class project? (Assume the order of the students is not important.)
From a group of 36 people, a jury of 12 people is selected. In how many different ways can a jury of 12 people be selected?
In order to conduct an experiment, 4 subjects are randomly selected from a group of 20 subjects. How many different groups of four subjects are possible?
A byte is a sequence of eight bits. A bit can be a 0 or a 1. In how many distinguishable ways can you have a byte with five 0’s and three 1’s?
In how many distinguishable ways can the letters in the word statistics be written?
You are putting 9 pieces of blue beach glass, 3 pieces of red beach glass, and 7 pieces of green beach glass on a necklace. In how many distinguishable ways can the beach glass be put on the necklace?
At a blood drive, 8 donors with type O+ blood, 6 donors with type A+ blood, and 3 donors with type B+ blood are in line. In how many distinguishable ways can the donors be in line?
An archaeology club has 38 members. How many different ways can the club select a president, vice president, treasurer, and secretary?
A DJ is preparing a playlist of 24 songs. How many different ways can the DJ choose the first six songs?
There are 16 finalists in a singing competition. The top five singers receive prizes. How many ways can the singers finish first through fifth?
There are 50 runners in a race. How many ways can the runners finish first, second, and third?
The starting lineup for a softball team consists of 10 players. How many different batting orders are possible using the starting lineup?
In how many ways can the letters A, B, C, D, E, and F be arranged for a six-letter security code?
Eight people compete in a downhill ski race. Assuming that there are no ties, in how many different orders can the skiers finish?
You have seven different video games. How many different ways can you arrange the games side by side on a shelf?
The number of four-letter passwords that can be created when no letter can be repeated.Determine whether the situation involves permutations, combinations, or neither. Explain your reasoning.
The number of ways 2 captains can be chosen from 28 players on a lacrosse team.Determine whether the situation involves permutations, combinations, or neither. Explain your reasoning.
The number of ways a four-member committee can be chosen from 10 people.Determine whether the situation involves permutations, combinations, or neither. Explain your reasoning.
The number of ways 16 floats can line up in a row for a parade.Determine whether the situation involves permutations, combinations, or neither. Explain your reasoning.
Perform the indicated calculation.7P3/12P4
Perform the indicated calculation.3P2/13P1
Perform the indicated calculation.10C7/14C7
Perform the indicated calculation.8C4/12C6
Perform the indicated calculation.21C8
Perform the indicated calculation.8C3
Perform the indicated calculation.14P3
Perform the indicated calculation.9P5
Determine whether the statement is true or false. If it is false, rewrite it as a true statement.7C5 = 7C2
When you divide the number of permutations of 11 objects taken 3 at a time by 3!, you will get the number of combinations of 11 objects taken 3 at a time.Determine whether the statement is true or false. If it is false, rewrite it as a true statement.
The number of different ordered arrangements of n distinct objects is n!.Determine whether the statement is true or false. If it is false, rewrite it as a true statement.
A combination is an ordered arrangement of objects.Determine whether the statement is true or false. If it is false, rewrite it as a true statement.
When you calculate the number of combinations of r objects taken from a group of n objects, what are you counting? Give an example.
When you calculate the number of permutations of n distinct objects taken r at a time, what are you counting? Give an example.
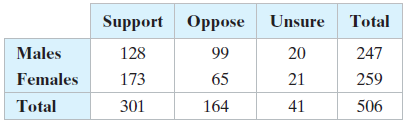
The table shows the results of a survey that asked 506 Maine adults whether they favored or opposed a tax to fund education. A person is selected at random from the sample. Find the probability of each event. (a) The person opposes the tax or is female.(b) The person supports the tax or is
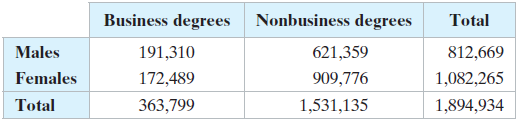
The table shows the numbers of male and female students in the U.S. who received bachelor’s degrees in business in a recent year. A student is selected at random. Find the probability of each event.(a) The student is male or received a business degree.(b) The student is female or received a
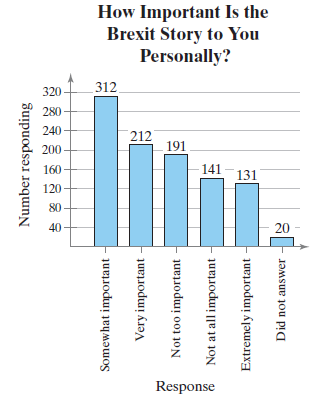
The responses of 1007 American adults to a survey question about the story of Britons’ vote to leave the European Union are shown in the Pareto chart. Find the probability of each event. (a) Randomly selecting an adult who thinks the story is somewhat important.(b) Randomly selecting an
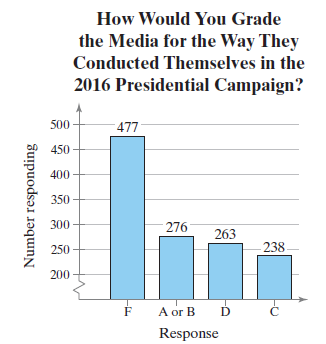
The responses of 1254 voters to a survey about the way the media conducted themselves in the 2016 presidential campaign are shown in the Pareto chart. Find the probability of each event.(a) Randomly selecting a person from the sample who did not give the media an A or a B.(b) Randomly selecting a
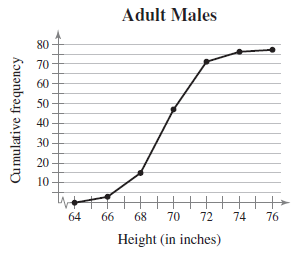
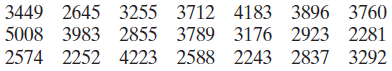
Use the ogive to approximate(a) the number in the sample.(b) the location of the greatest increase in frequency. Adult Males 80 70 60 50 40 30 20 10 64 66 68 70 72 74 76 Height (in inches) Cu mulative frequency
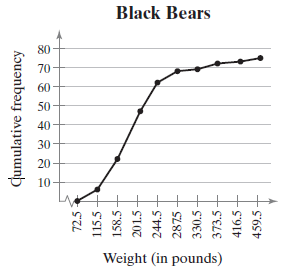
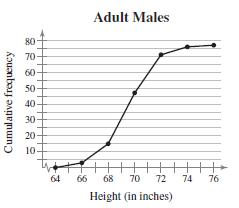
Use the ogive to approximate(a) the number in the sample.(b) the location of the greatest increase in frequency. Black Bears 80 Weight (in pounds) Cumulative frequency 72.5 115.5 158.5 201.5 244.5 2875 + 330.5 373.5+ 416.5 459.5
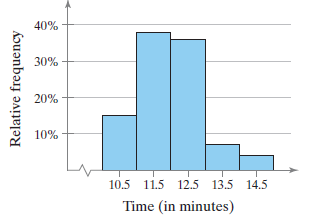
Use the relative frequency histogram to(a) identify the class with the greatest, and the class with the least, relative frequency.(b) approximate the greatest and least relative frequencies.(c) describe any patterns with the data.Campus Security Response Times 40% 30% 20% 10% 10.5 11.5 12.5 13.5
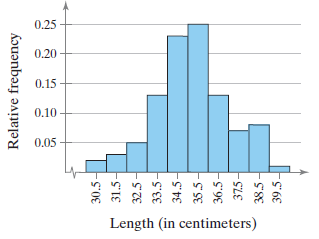
Use the relative frequency histogram to(a) identify the class with the greatest, and the class with the least, relative frequency.(b) approximate the greatest and least relative frequencies.(c) describe any patterns with the data.Female Fibula Lengths 0.25 0.20 0.15 0.10 0.05 Length (in
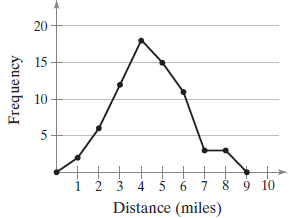
Use the frequency polygon to identify the class with the greatest, and the class with the least, frequency.Commuting Distances for 70 Students, Ages 18−24 20 15 10 5- 8 9 10 1 2 3 5 6 7 4 Distance (miles) Frequency
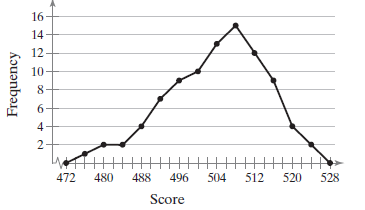
Use the frequency polygon to identify the class with the greatest, and the class with the least, frequency.MCAT Scores for 90 Applicants 16 14 12 10- 6. 472 480 488 496 504 512 520 528 Score Frequency
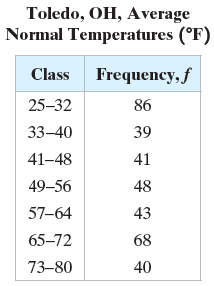
Use the frequency distribution in Exercise 16 to construct an expanded frequency distribution, as shown in Example 2.Data from Exercise 16: Toledo, OH, Average Normal Temperatures (°F) Class Frequency, f 25-32 86 33-40 39 41-48 41 49-56 48 57-64 43 65–72 68 73-80 40
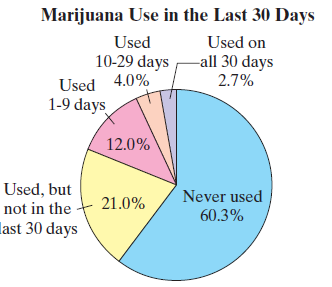
The percent of college students’ marijuana use for a sample of 95,761 students is shown in the pie chart. Find the probability of each event.(a) Randomly selecting a student who never used marijuana. (b) Randomly selecting a student who used marijuana.(c) Randomly selecting a student who
A teaching conference has an attendance of 6855 people. Of these, 3120 are college professors and 3595 are male. Of the college professors, 1505 are male. Find the probability that a randomly selected attendee is male or a college professor.
A physics class has 40 students. Of these, 12 students are physics majors and 16 students are female. Of the physics majors, three are female. Find the probability that a randomly selected student is female or a physics major.
Event A: Randomly select a member of the U.S. Congress.Event B: Randomly select a male U.S. Senator.Determine whether the events are mutually exclusive. Explain your reasoning.
Event A: Randomly select a voter who is a registered Republican.Event B: Randomly select a voter who is a registered Democrat.Determine whether the events are mutually exclusive. Explain your reasoning.
Event A: Randomly select a student with a birthday in April.Event B: Randomly select a student with a birthday in May.Determine whether the events are mutually exclusive. Explain your reasoning.
Event A: Randomly select a male psychology major.Event B: Randomly select a psychology major who is 20 years old.Determine whether the events are mutually exclusive. Explain your reasoning.
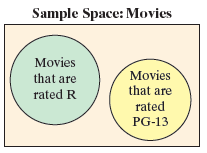
Determine whether the events shown in the Venn diagram are mutually exclusive. Explain your reasoning. Sample Space: Movies Movies Movies that are that are rated R rated PG-13
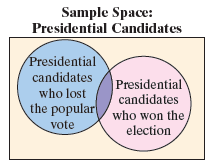
Determine whether the events shown in the Venn diagram are mutually exclusive. Explain your reasoning. Sample Space: Presidential Candidates Presidential candidates Presidential candidates the popular who won the who lost vote election
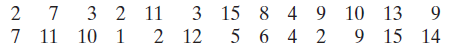
Use the data set listed and technology to create frequency histograms with 5, 10, and 20 classes. Which graph displays the data best? Explain. 11 3 15 8 4 9 10 13 5 6 4 2 9. 2 7 3 2 9 15 14 11 10 1 2 12
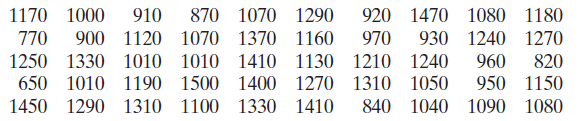
The admissions department for a college is asked to recommend the minimum SAT scores that the college will accept for full-time students. Here are the SAT scores of 50 applicants.(a) Construct a relative frequency histogram for the data. Use 10 classes.(b) If you set the minimum score at 1070, what
Use the data set and the indicated number of classes to construct (a) An expanded frequency distribution, (b) A frequency histogram, (c) A frequency polygon, (d) A relative frequency histogram, and (e) An ogive.HospitalsNumber of classes: 8Data set: Number of hospitals in
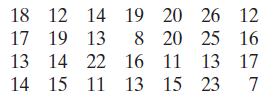
Construct a cumulative frequency distribution and an ogive for the data set using six classes. Then describe the location of the greatest increase in frequency.Saturated Fat IntakesData set: Daily saturated fat intakes (in grams) of 28 people 18 12 14 19 20 26 12 17 19 13 13 14 22 16 11 13 17 14 15
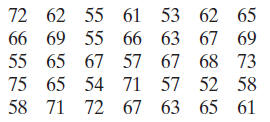
Construct a cumulative frequency distribution and an ogive for the data set using six classes. Then describe the location of the greatest increase in frequency.Retirement AgesData set: Retirement ages of 35 English professors 72 62 55 61 53 62 65 66 69 55 66 63 67 69 55 65 67 57 67 68 73 75 65 54
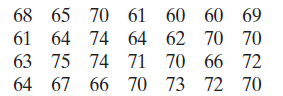
Construct a frequency distribution and a relative frequency histogram for the data set using five classes. Which class has the greatest relative frequency and which has the least relative frequency?Fijian Banded IguanasData set: Lengths (in centimeters) of 28 adult Fijian banded iguanas 68 65 70 61
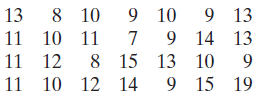
Construct a frequency distribution and a relative frequency histogram for the data set using five classes. Which class has the greatest relative frequency and which has the least relative frequency?Years of ServiceData set: Years of service of 28 Ohio state government employees 10 9 13 9 14 13 15
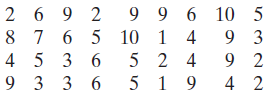
Construct a frequency distribution and a relative frequency histogram for the data set using five classes. Which class has the greatest relative frequency and which has the least relative frequency?Taste TestData set: Ratings from 1 (lowest) to 10 (highest) provided by 36 people after taste-testing
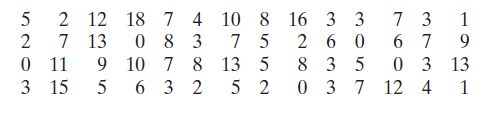
Construct a frequency distribution and a frequency polygon for the data set using the indicated number of classes. Describe any patterns.Declaration of Independence Number of classes: 5Data set: Numbers of children of those who signed the Declaration of Independence 2 12 18 7 4 10 8 0 8 3 13 5
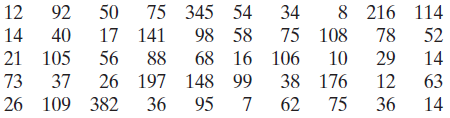
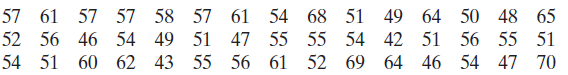
Construct a frequency distribution and a frequency polygon for the data set using the indicated number of classes. Describe any patterns.Ages of the PresidentsNumbers of classes: 6Data set: Ages of the U.S. presidents at Inauguration 57 61 57 57 58 57 61 54 68 51 49 64 50 48 65 52 56 46 54 49 51 47
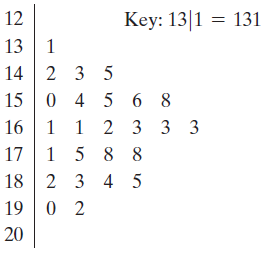
Construct a frequency distribution and a frequency histogram for the data set using the indicated number of classes. Describe any patterns.Finishing TimesNumber of classes: 8Data set: Finishing times (in seconds) of 21 participants in a 10K race. 3449 2645 3255 3712 4183 3896 3760 5008 3983 2855
Use the ogive in Exercise 26 to approximate(a) The cumulative frequency for a height of 72 inches.(b) The height for which the cumulative frequency is 15.(c) The number of adult males that are between 68 and 72 inches tall.(d) The number of adult males that are taller than 70 inches. Adult Males 80
Use the ogive in Exercise 25 to approximate (a) the cumulative frequency for a weight of 201.5 pounds.(b) the weight for which the cumulative frequency is 68.(c) the number of black bears that weigh between 158.5 pounds and 244.5 pounds.(d) the number of black bears that weigh more than 330.5
If events A and B are mutually exclusive, thenP(A or B) = P(A) + P(B).Determine whether the statement is true or false. If it is false, explain why.
Use the frequency distribution in Exercise 15 to construct an expanded frequency distribution, as shown in Example 2.
The probability that event A or event B will occur isP(A or B) = P(A) + P(B) + P(A and B).Determine whether the statement is true or false. If it is false, explain why.
When two events are mutually exclusive, they have no outcomes in common.Determine whether the statement is true or false. If it is false, explain why.
Give an example of (a) Two events that are mutually exclusive and (b) Two events that are not mutually exclusive.
When two events are mutually exclusive, why is P(A and B) = 0?
You are in a class that has 24 students. You want to find the probability that at least two of the students have the same birthday.(a) Find the probability that each student has a different birthday.(b) Use the result of part (a) to find the probability that at least two students have the same
Use Bayes’ Theorem to find P(A/B).P(A) = 12%, P(A') = 88%, P(B/A) = 66%, and P(B/A') = 19%
Use Bayes’ Theorem to find P(A/B).P(A) = 73%, P(A') = 17%, P(B/A) = 46%, and P(B/A') = 52%
The monthly utility bills for eight households are listed. Using the sample statistics from Exercise 30, determine which of the data entries are unusual. Are any of the data entries very unusual? Explain your reasoning.$65, $52, $63, $83, $77, $98, $84, $70Use the Empirical Rule
The speeds for eight vehicles are listed. Using the sample statistics from Exercise 29, determine which of the data entries are unusual. Are any of the data entries very unusual? Explain your reasoning.70, 78, 62, 71, 65, 76, 82, 64Use the Empirical Rule
Construct a data set that has the given statistics.n = 6x̅ = 7s ≈ 2
Construct a data set that has the given statistics.n = 7x̅ = 9s = 0
Construct a data set that has the given statistics.N = 8μ = 6σ ≈ 3
Construct a data set that has the given statistics.N = 6μ = 5σ ≈ 2
You are applying for jobs at two companies. Company C offers starting salaries with μ = $59,000 and σ = $1500. Company D offers starting salaries with μ = $59,000 and σ = $1000. From which company are you more likely to get an offer of $62,000 or more? Explain your reasoning.
You are applying for jobs at two companies. Company A offers starting salaries with μ = $41,000 and σ = $1000. Company B offers starting salaries with μ = $41,000 and σ = $5000. From which company are you more likely to get an offer of $43,000 or more? Explain your reasoning.
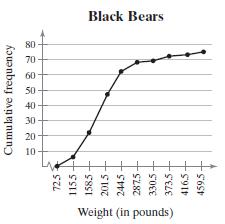
Both data sets shown in the stem-and-leaf plots have a mean of 165. One has a standard deviation of 16, and the other has a standard deviation of 24. By looking at the stem-and-leaf plots, which is which? Explain your reasoning.(a)(b) 12 8 9 Key: 12|8 = 128 13 5 5 8 14 1 2 15 0 0 6 7 4 5 9 16 17 1
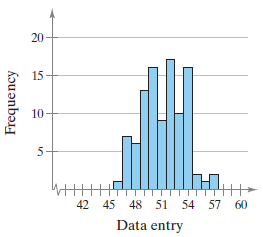
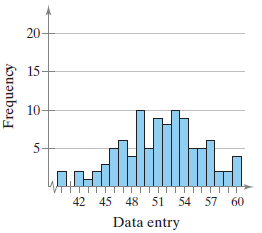
Both data sets shown in the histograms have a mean of 50. One has a standard deviation of 2.4, and the other has a standard deviation of 5. By looking at the histograms, which is which? Explain your reasoning.(a)(b) 20 15 10 42 45 48 51 54 57 60 Data entry Frequency 15 10 5- 42 45 48 51 54 57 60
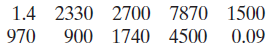
The densities (in kilograms per cubic meter) of the ten most abundant elements by weight in Earth’s crustFind the range, mean, variance, and standard deviation of the population data set. 1.4 2330 2700 7870 1500 900 1740 4500 0.09 970
The numbers of alcohol-impaired crash fatalities (in thousands) per year from 2005 through 2015.14 13 13 12 11 10 10 10 10 10 10Find the range, mean, variance, and standard
In Exercise 11, compare your answer to part (a) with your answer to part (b). How do outliers affect the range of a data set?Data from exercise 11:The depths (in inches) at which 10 artifacts are found are listed.20.7 24.8 30.5 26.2 36.0 34.3 30.3
The depths (in inches) at which 10 artifacts are found are listed.20.7 24.8 30.5 26.2 36.0 34.3 30.3 29.5 27.0 38.5(a) Find the range of the data set.(b) Change 38.5 to 60.5 and find the
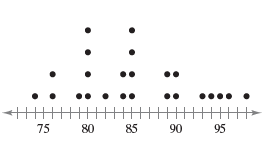
Find the range of the data set represented by the graph. 75 80 85 90 95
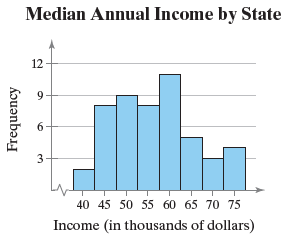
Find the range of the data set represented by the graph. Median Annual Income by State 12 40 45 50 55 60 65 70 75 Income (in thousands of dollars) Frequency 3.
What must you know about a data set before you can use the Empirical Rule?
Discuss the similarities and the differences between the Empirical Rule and Chebychev’s Theorem.
Explain the relationship between variance and standard deviation. Can either of these measures be negative? Explain.
Why is the standard deviation used more frequently than the variance?
Showing 2500 - 2600
of 2934
First
16
17
18
19
20
21
22
23
24
25
26
27
28
29
30
Step by Step Answers