New Semester
Started
Get
50% OFF
Study Help!
--h --m --s
Claim Now
Question Answers
Textbooks
Find textbooks, questions and answers
Oops, something went wrong!
Change your search query and then try again
S
Books
FREE
Study Help
Expert Questions
Accounting
General Management
Mathematics
Finance
Organizational Behaviour
Law
Physics
Operating System
Management Leadership
Sociology
Programming
Marketing
Database
Computer Network
Economics
Textbooks Solutions
Accounting
Managerial Accounting
Management Leadership
Cost Accounting
Statistics
Business Law
Corporate Finance
Finance
Economics
Auditing
Tutors
Online Tutors
Find a Tutor
Hire a Tutor
Become a Tutor
AI Tutor
AI Study Planner
NEW
Sell Books
Search
Search
Sign In
Register
study help
mathematics
elementary statistics picturing
Elementary Statistics Picturing The World 7th Edition Ron Larson, Betsy Farber - Solutions
Explain how to find the deviation of an entry in a data set. What is the sum of all the deviations in any data set?
In an academic year, a student receives the grades shown below, with an A worth 4 points, a B worth 3 points, and a C worth 2 points.A in 2 four-credit classes and 3 three-credit classesB in 2 three-credit classes and 2 two-credit classesC in 1 two-credit classThe student can increase one of the Bs
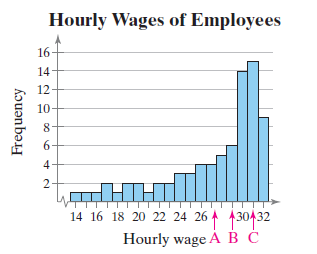
The letters A, B, and C are marked on the horizontal axis. Describe the shape of the data. Then determine which is the mean, which is the median, and which is the mode. Justify your answers. Hourly Wages of Employees 16 14 12 10 6. HT 14 16 18 20 22 24 26 ↑ 130432 Hourly wage À B Č Frequency
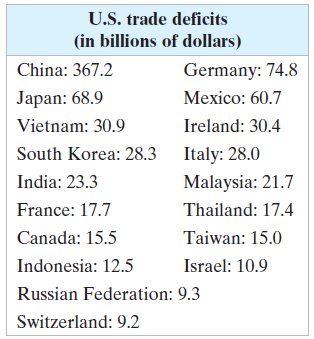
The table at the left shows the U.S. trade deficits (in billions of dollars) with 18 countries in 2015. (a) Find the mean and the median of the trade deficits.(b) Find the mean and the median without the Chinese trade deficit. Which measure of central tendency, the mean or the median, was
During a quality assurance check, the actual contents (in grams) of six containers of protein powder were recorded as 1525, 1526, 1502, 1516, 1529, and 1511.(a) Find the mean and the median of the contents.(b) The third value was incorrectly measured and is actually 1520. Find the mean and the
Number of classes: 6Data set: The numbers of patients visiting an emergency room per day over a two-week periodConstruct a frequency distribution and a frequency histogram for the data set using the indicated number of classes. Describe the shape of the histogram as symmetric, uniform, negatively
Number of classes: 5Data set: The number of beds in a sample of 20 hospitalsConstruct a frequency distribution and a frequency histogram for the data set using the indicated number of classes. Describe the shape of the histogram as symmetric, uniform, negatively skewed, positively skewed, or none
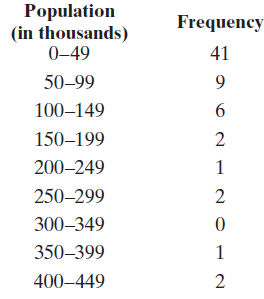
The populations (in thousands) of the parishes of Louisiana in 2015Approximate the mean of the frequency distribution. Population (in thousands) 0–49 Frequency 41 50–99 100–149 150–199 200–249 250–299 2 300–349 350–399 400–449
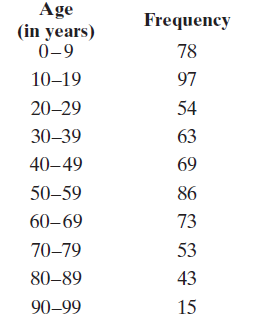
The ages (in years) of the residents of a small town in 2016Approximate the mean of the frequency distribution. Age (in years) 0-9 Frequency 78 10–19 97 20-29 54 30–39 63 40-49 69 50–59 86 60-69 73 70–79 53 43 80–89 90–99 15
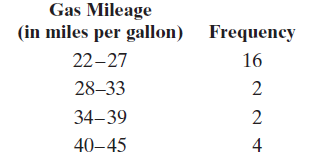
The gas mileages (in miles per gallon) for 24 family sedansApproximate the mean of the frequency distribution. Gas Mileage (in miles per gallon) Frequency 22-27 16 28–33 34-39 40–45 4
In Exercise 46, one of the student’s B grades gets changed to an A. What is the student’s new grade point average?Data from Exercise 46:A student receives the grades shown below, with an A worth 4 points, a B worth 3 points, a C worth 2 points, and a D worth 1 point. What is the student’s
For the month of October, a credit card has a balance of $115.63 for 12 days, $637.19 for 6 days, $1225.06 for 7 days, $0 for 2 days, and $34.88 for 4 days. What is the account’s mean daily balance for October?Find the weighted mean of the data.
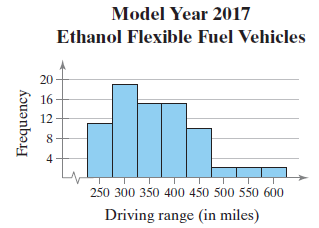
Identify any clusters, gaps, or outliers. Model Year 2017 Ethanol Flexible Fuel Vehicles 20 16 12 8. 250 300 350 400 450 500 550 600 Driving range (in miles) Frequency
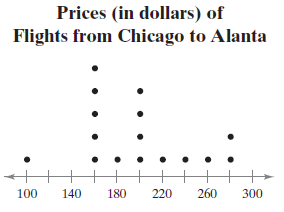
Find the mean, the median, and the mode of the data, if possible. If any measure cannot be found or does not represent the center of the data, explain why. Prices (in dollars) of Flights from Chicago to Alanta 260 100 140 180 220 300
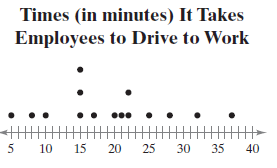
Find the mean, the median, and the mode of the data, if possible. If any measure cannot be found or does not represent the center of the data, explain why. Times (in minutes) It Takes Employees to Drive to Work 15 25 35 10 20 30 40
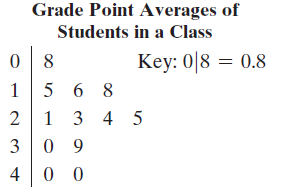
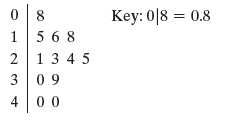
Find the mean, the median, and the mode of the data, if possible. If any measure cannot be found or does not represent the center of the data, explain why. Grade Point Averages of Students in a Class Key: 0|8 = 0.8 5 6 8 1 3 4 5 3 0 9 4 0 0 1,
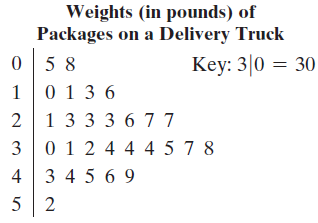
Find the mean, the median, and the mode of the data, if possible. If any measure cannot be found or does not represent the center of the data, explain why. Weights (in pounds) of Packages on a Delivery Truck Key: 3|0 = 30 5 8 0 1 3 6 2 13 3 3 6 7 7 3 0 1 2 4 4 4 5 7 8 4 3 4 5 6 9
The responses of a sample of 34 young adult United Kingdom males in custodial sentences who were asked what is affected by such sentences Mental health: 8Trust: 3Education: 8Personal development: 5Family: 3Future opportunities: 3Other: 4Find the mean, the median, and the mode of the data, if
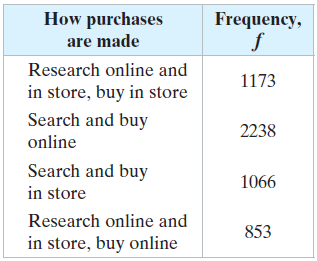
The responses of a sample of 5330 shoppers who were asked how their purchases are made are shown in the table at the left.Find the mean, the median, and the mode of the data, if possible. If any measure cannot be found or does not represent the center of the data, explain why. How purchases
The numbers of patients who responded to various combinations of electroconvulsive therapy, medication, and cognitive-behavioral therapy to treat acute depression over different time periods42 15 8 9 13 6 7Find the mean, the median, and the mode of
The maximum numbers of passenger vehicle lanes at 16 Canadian border ports of entry (Source: U.S. Customs and Border Protection)8 6 1 0 3 6 1 1 17 22 6 1 1
The 2016–2017 tuition and fees (in thousands of dollars) for the top14 universities in the U.S. 45 47 52 49 55 48 4851 51 50
The ages of the new members of the House of Representatives in the 115th Congress from Florida as of January 3, 2017.60 34 38 59 68 63 63 36
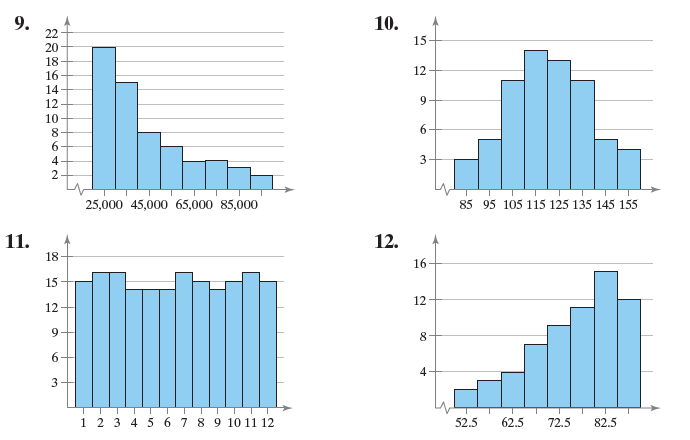
Match the distribution with one of the graphs in Exercises 9–12. Justify your decision.Graphs from 9-12:The frequency distribution of weights for a sample of seventh-grade boys. 9. 22 10. 15 20 18 12 16 14 12 10 3 4. 25,000 45,000 65,000 85,000 85 95 105 115 125 135 145 155 11. 12. 18 16 15 12 12
Match the distribution with one of the graphs in Exercises 9–12. Justify your decision.Graphs from 9-12:The frequency distribution of scores on a 90-point test where a few students scored much lower than the majority of students 9. 22 10. 15 20 18 12 16 14 9 12 10 8 4. 3 25,000 45,000 65,000
Match the distribution with one of the graphs in Exercises 9–12. Justify your decision.Graphs from 9-12:The frequency distribution of mileages of service vehicles at a business where a few vehicles have much higher mileages than the majority of vehicles 9. 22 10. 15 20 18 12 16 14 12 10 3 4.
Match the distribution with one of the graphs in Exercises 9–12. Justify your decision.Graphs from 9-12:The frequency distribution of 180 rolls of a dodecagon (a 12-sided die) 9. 22 10. 15 20 18 12 16 14 12 10 3 4. 25,000 45,000 65,000 85,000 85 95 105 115 125 135 145 155 11. 12. 18 16 15 12 12 4
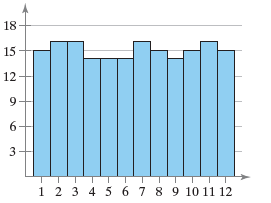
Determine whether the approximate shape of the distribution in the histogram is symmetric, uniform, skewed left, skewed right, or none of these. Justify your answer. 18 15 12 9- 2 3 4 5 6 7 8 9 10 11 12
Mean, median, and mode are the same.Construct the described data set. The entries in the data set cannot all be the same.
Mean and mode are the same.Construct the described data set. The entries in the data set cannot all be the same.
Median and mode are the same.Construct the described data set. The entries in the data set cannot all be the same.
When each data class has the same frequency, the distribution is symmetric.Determine whether the statement is true or false. If it is false, rewrite it as a true statement.
A data set can have the same mean, median, and mode.Determine whether the statement is true or false. If it is false, rewrite it as a true statement.
Some quantitative data sets do not have medians.Determine whether the False. All quantitative data sets have a median.statement is true or false. If it is false, rewrite it as a true statement.
The mean is the measure of central tendency most likely to be affected by an outlier.Determine whether the statement is true or false. If it is false, rewrite it as a true statement.
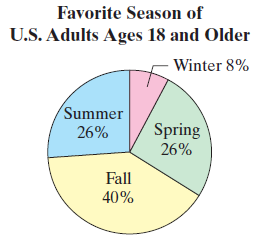
Display the data below in a Pareto chart. Describe the differences in how the pie chart and the Pareto chart show patterns in the data. Favorite Season of U.S. Adults Ages 18 and Older Winter 8% Summer Spring 26% 26% Fall 40%
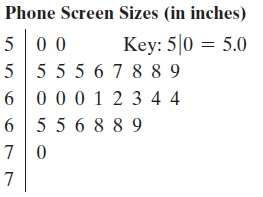
Display the data below in a dot plot. Describe the differences in how the stem-and-leaf plot and the dot plot show patterns in the data. Phone Screen Sizes (in inches) 500 5 5 5 5 6 7 8 8 9 0 0 0 1 2 3 4 4 Key: 5|0 = 5.0 6 5 5 6 8 8 9
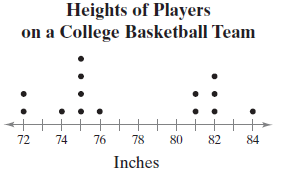
Display the data below in a stem-and-leaf plot. Describe the differences in how the dot plot and the stem-and-leaf plot show patterns in the data. Heights of Players on a College Basketball Team 72 74 76 78 80 82 84 Inches
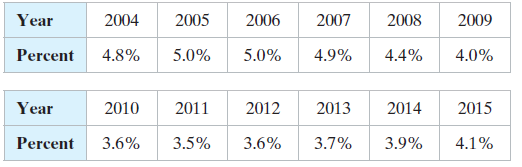
Use a time series chart to display the data shown in the table. The data represent the percentages of the U.S. gross domestic product (GDP) that come from the construction sector.Organize the data using the indicated type of graph. Describe any patterns. Year 2005 2007 2009 2004 2006 2008 Percent
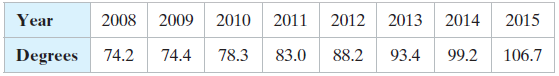
Use a time series chart to display the data shown in the table. The data represent the numbers of bachelor’s degrees in engineering (in thousands) conferred in the U.S.Organize the data using the indicated type of graph. Describe any patterns. Year 2013 2015 2008 2009 2010 2014 2011 2012 88.2
The average owning and operating costs for four types of vehicles in the United States in 2016 include small sedans ($6579), medium sedans ($8604), SUVs ($10,255), and minivans ($9262). Use a Pareto chart to display the data.Organize the data using the indicated type of graph. Describe any patterns.
The medal counts for five countries at the 2016 Summer Olympics include Germany (42 medals), Great Britain (67 medals), the United States (121 medals), Russia (56 medals), and China (70 medals). Use a Pareto chart to display the data.Organize the data using the indicated type of graph. Describe any
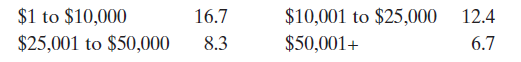
Use a pie chart to display the data, which represent the numbers of student loan borrowers (in millions) by balance owed in the fourth quarter of 2015.Organize the data using the indicated type of graph. Describe any patterns. 12.4 $1 to $10,000 $25,001 to $50,000 $10,001 to $25,000 $50,001+ 16.7
Use a dot plot to display the data, which represent the systolic blood pressures (in millimeters of mercury) of 24 patients at a doctor’s office.Organize the data using the indicated type of graph. Describe any patterns. 120 135 140 145 130 150 120 170 145 125 130 110 160 180 200 150 200 135 140
Use a stem-and-leaf plot that has two rows for each stem to display the data, which represent the incomes (in millions) of the top 30 highest-paid athletes.Organize the data using the indicated type of graph. Describe any patterns. 77 45 34 41 2 45 37 36 44 50 35 56 56 68 45 33 46 37 44 43 81 53 38
Use a stem-and-leaf plot to display the data shown in the table at the left, which represent the monthly average prices (in dollars per pound) charged by 30 retail outlets for fresh tomatoes.Organize the data using the indicated type of graph. Describe any patterns.
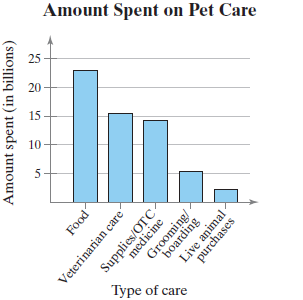
Give three observations that can be made from the graph. on Pet Care Amount Spent 25 20 15 10 Type of care Amount spent (in billions) Food Veterinarian care Supplies/OTC medicine Grooming/ boarding Live animal purchases
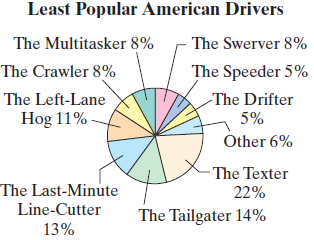
Give three observations that can be made from the graph. Least Popular American Drivers The Multitasker 8% The Swerver 8% The Crawler 8% The Speeder 5% The Left-Lane -The Drifter Hog 11% 5% Other 6% - The Texter The Last-Minute 22% Line-Cutter The Tailgater 14% 13%
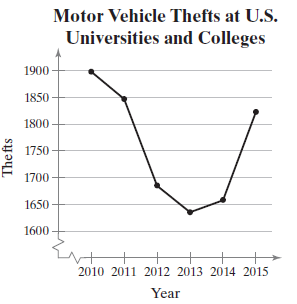
Give three observations that can be made from the graph. Motor Vehicle Thefts at U.S. Universities and Colleges 1900 1850 1800 1750 1700 1650 1600 2010 2011 2012 2013 2014 2015 Year The fts
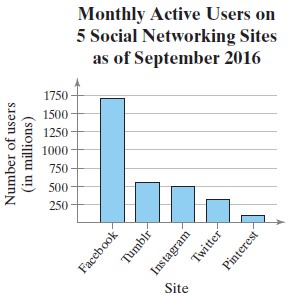
Give three observations that can be made from the graph. Monthly Active Users on 5 Social Networking Sites as of September 2016 1750 1500 1250 1000 750 500 250 Site Number of users (in millions) Facebook Tumblr Instagram Twitter Pinterest
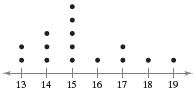
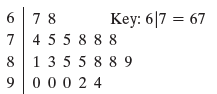
Use the stem-and-leaf plot or dot plot to list the actual data entries. What is the maximum data entry? What is the minimum data entry? 15 13 14 16 17 18 19
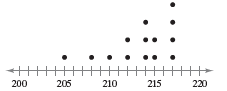
Match the plot with the description of the sample.(a) Times (in minutes) it takes a sample of employees to drive to work(b) Grade point averages of a sample of students with finance majors(c) Top speeds (in miles per hour) of a sample of high-performance sports cars(d) Ages (in years) of a sample
Match the plot with the description of the sample.(a) Times (in minutes) it takes a sample of employees to drive to work(b) Grade point averages of a sample of students with finance majors(c) Top speeds (in miles per hour) of a sample of high-performance sports cars(d) Ages (in years) of a sample
Match the plot with the description of the sample.(a) Times (in minutes) it takes a sample of employees to drive to work(b) Grade point averages of a sample of students with finance majors(c) Top speeds (in miles per hour) of a sample of high-performance sports cars(d) Ages (in years) of a sample
How is a Pareto chart different from a standard vertical bar graph?
In terms of displaying data, how is a stem-and-leaf plot similar to a dot plot?
Name some ways to display quantitative data graphically. Name some ways to display qualitative data graphically.
Rolling a six-sided die, tossing two coins, and then drawing one card from a hand of three cardsIdentify the sample space of the probability experiment and determine the number of outcomes in the sample space. Draw a tree diagram then appropriate.
Tossing two coins.Identify the sample space of the probability experiment and determine the number of outcomes in the sample space. Draw a tree diagram then appropriate.
Identifying a person’s eye color (blue, brown, green, hazel, gray, other) and hair color (blonde, black, brown, red, other).Identify the sample space of the probability experiment and determine the number of outcomes in the sample space. Draw a tree diagram then appropriate.
Drawing one card from a standard deck of cards.Identify the sample space of the probability experiment and determine the number of outcomes in the sample space. Draw a tree diagram then appropriate.
Guessing a student’s letter grade (A, B, C, D, F) in a class.Identify the sample space of the probability experiment and determine the number of outcomes in the sample space. Draw a tree diagram then appropriate.
Guessing the initial of a student’s middle name.Identify the sample space of the probability experiment and determine the number of outcomes in the sample space. Draw a tree diagram then appropriate.
The probability that an event will not happen is given. Find the probability that the event will happen.P(E') = 21/61
The probability that an event will not happen is given. Find the probability that the event will happen.P(E') = 3/4
The probability that an event will not happen is given. Find the probability that the event will happen.P(E') = 0.13
The probability that an event will not happen is given. Find the probability that the event will happen.P(E') = 0.95
The probability that an event will happen is given. Find the probability that the event will not happen.P(E) = 2/7
The probability that an event will happen is given. Find the probability that the event will not happen.P(E) = 0.03
The probability that an event will happen is given. Find the probability that the event will not happen.P(E) = 0.55
The probability that an event will happen is given. Find the probability that the event will not happen.P(E) = 19/23
You toss a coin four times. What is the probability of tossing tails exactly half of the time?Match the event with its probability.(a) 0.95 (b) 0.005 (c) 0.25 (d) 0 (e) 0.375 (f ) 0.5
Five of the 100 digital video recorders (DVRs) in an inventory are known to be defective. What is the probability you randomly select a DVR that is not defective?Match the event with its probability.(a) 0.95 (b) 0.005 (c) 0.25 (d) 0 (e) 0.375 (f ) 0.5
A game show contestant must randomly select a door. One door doubles her money while the other three doors leave her with no winnings. What is the probability she selects the door that doubles her money?Match the event with its probability.(a) 0.95 (b) 0.005 (c) 0.25 (d) 0 (e)
You randomly select a number from 0 to 9 and then randomly select a number from 0 to 19. What is the probability of selecting a 3 both times?Match the event with its probability.(a) 0.95 (b) 0.005 (c) 0.25 (d) 0 (e) 0.375 (f ) 0.5
A random number generator is used to select a number from 1 to 100. What is the probability of selecting an even number?Match the event with its probability.(a) 0.95 (b) 0.005 (c) 0.25 (d) 0 (e) 0.375 (f ) 0.5
A random number generator is used to select a number from 1 to 100. What is the probability of selecting the number 153?Match the event with its probability.(a) 0.95 (b) 0.005 (c) 0.25 (d) 0 (e) 0.375 (f ) 0.5
When an event is almost certain to happen, its complement will be an unusual event.Determine whether the statement is true or false. If it is false, rewrite it as a true statement
A probability of 1/10 indicates an unusual event.Determine whether the statement is true or false. If it is false, rewrite it as a true statement
You toss a fair coin nine times and it lands tails up each time. The probability it will land heads up on the tenth toss is greater than 0.5.Determine whether the statement is true or false. If it is false, rewrite it as a true statement
You are taking a test that has true or false and multiple choice questions. The event “choosing false on a true or false question and choosing A or B on a multiple choice question” is a simple event.Determine whether the statement is true or false. If it is false, rewrite it as a true statement
List the three formulas that can be used to describe complementary events.
Describe the law of large numbers in your own words. Give an example.
When you use the Fundamental Counting Principle, what are you counting?
Explain why the statement is incorrect: The probability of rain is 150%.
Determine whether each number could represent the probability of an event. Explain your reasoning.(a) 25/25 (b) 333.3% (c) 2.3 (d) - 0.0004 (e) 0 (f ) 320/105
The mean gestational length of a sample of 208 horses is 343.7 days, with a standard deviation of 10.4 days. The data set has a bell-shaped distribution.(a) Estimate the number of gestational lengths between 333.3 and 354.1 days.(b) Determine whether a gestational length of 318.4 days feet is
The data set represents the ages of 15 college professors.46 51 60 58 37 65 40 55 30 68 28 62 56 42 59(a) Display the data in a
The numbers of minutes it took 12 students in a statistics class to complete the final exam are listed. Use a scatter plot to display this data set and the data set in Exercise 1. The data sets are in the same order. Describe any patterns. 61 85 67 48 54 61
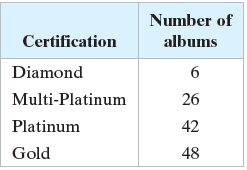
The table lists the numbers of albums by The Beatles that received salescertifications. Display the data using (a) A pie chart and (b) A Pareto chart. Number of Certification albums Diamond Multi-Platinum 26 Platinum 42 Gold 48
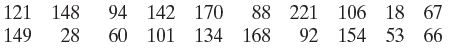
For the data set in Exercise 2, find the percentile that corresponds to 149 movies watched in a year.Data from exercise 2:The data set represents the numbers of movies that a sample of 20 people watched in a year.(a) Construct a frequency distribution for the data set using six classes.Include
Use frequency distribution formulas to estimate the sample mean and the sample standard deviation of the data set in Exercise 2.Data from exercise 2:The data set represents the numbers of movies that a sample of 20 people watched in a year.(a) Construct a frequency distribution for the data set
The data set represents the numbers of movies that a sample of 20 people watched in a year.(a) Construct a frequency distribution for the data set using six classes.Include class limits, midpoints, boundaries, frequencies, relative frequencies, and cumulative frequencies.(b) Display the data using
The overall averages of 12 students in a statistics class prior to taking the final exam are listed.67 72 88 73 99 85 81 87 63 94 68 87(a) Find the mean, median, and mode of
Use the corresponding z-score to determine whether the towing capacity is unusual. Explain your reasoning.11,300 pounds
Use the corresponding z-score to determine whether the towing capacity is unusual. Explain your reasoning.18,000 pounds
Use the corresponding z-score to determine whether the towing capacity is unusual. Explain your reasoning.5500 pounds
Use the corresponding z-score to determine whether the towing capacity is unusual. Explain your reasoning.16,500 pounds
As of December 2016, there were 721 adult contemporary radio stations in the United States. One station finds that 115 stations have a larger daily audience than it has. What percentile does this station come closest to in the daily audience rankings?
A student’s test grade of 75 represents the 65th percentile of the grades. What percent of students scored higher than 75?
Showing 2600 - 2700
of 2934
First
16
17
18
19
20
21
22
23
24
25
26
27
28
29
30
Step by Step Answers