New Semester
Started
Get
50% OFF
Study Help!
--h --m --s
Claim Now
Question Answers
Textbooks
Find textbooks, questions and answers
Oops, something went wrong!
Change your search query and then try again
S
Books
FREE
Study Help
Expert Questions
Accounting
General Management
Mathematics
Finance
Organizational Behaviour
Law
Physics
Operating System
Management Leadership
Sociology
Programming
Marketing
Database
Computer Network
Economics
Textbooks Solutions
Accounting
Managerial Accounting
Management Leadership
Cost Accounting
Statistics
Business Law
Corporate Finance
Finance
Economics
Auditing
Tutors
Online Tutors
Find a Tutor
Hire a Tutor
Become a Tutor
AI Tutor
AI Study Planner
NEW
Sell Books
Search
Search
Sign In
Register
study help
mathematics
elementary statistics picturing
Elementary Statistics Picturing The World 7th Edition Ron Larson, Betsy Farber - Solutions
Use the data set, which represents the model 2017 vehicles with the highest fuel economies (in miles per gallon) in the most popular classes.About how many vehicles fall on or below the third quartile? 35 136 56 58 119 50 30 30 35 112 34 124 35 107 46 | 41 25 22 22 22 34 25 16 16 52 22
Use the data set, which represents the model 2017 vehicles with the highest fuel economies (in miles per gallon) in the most popular classes.Draw a box-and-whisker plot that represents the data set. 35 136 56 58 119 50 30 30 35 112 34 124 35 107 46 | 41 25 22 22 22 34 25 16 16 52 22
Use the data set, which represents the model 2017 vehicles with the highest fuel economies (in miles per gallon) in the most popular classes.Find the interquartile range of the data set. 35 136 56 58 119 50 30 30 35 112 34 124 35 107 46 | 41 25 22 22 22 34 25 16 16 52 22
Use the data set, which represents the model 2017 vehicles with the highest fuel economies (in miles per gallon) in the most popular classes.Find the five-number summary of the data set. 35 136 56 58 119 50 30 30 35 112 34 124 35 107 46 | 41 25 22 22 22 34 25 16 16 52 22
The mean duration of the 135 space shuttle flights was about 9.9 days, and the standard deviation was about 3.8 days. Using Chebychev’s Theorem, determine at least how many of the flights lasted between 2.3 days and 17.5 days.
The mean sale per customer for 40 customers at a gas station is $32.00, with a standard deviation of $4.00. Using Chebychev’s Theorem, determine at least how many of the customers spent between $24.00 and $40.00.
The mean charge for satellite television for a sample of households was $87.50 per month, with a standard deviation of $14.50 per month. Estimate the percent of satellite television charges between $73.00 and $102.00. (Assume the data set has a bell-shaped distribution.)Use the Empirical Rule.
The mean charge for electricity for a sample of households was $110.00 per month, with a standard deviation of $17.50 per month. Between what two values do 95% of the data lie? (Assume the data set has a bell-shaped distribution.)Use the Empirical Rule.
Salaries (in dollars) of a random sample of teachers.62,222 56,719 50,259 45,120 47,692 45,985 53,489 71,534Find the range, mean, variance, and standard deviation of the sample data set.
Dormitory room charges (in dollars) for one school year for a random sample of four-year universitiesFind the range, mean, variance, and standard deviation of the sample data set. 5816 6045 5612 6341 6106 7361 6320 6265 7220 7439 5395 6908 5561 5710 5538 6632
The ages of the Supreme Court justices as of December 22, 2016.61 80 68 83 78 66 62 56Find the range, mean, variance, and standard deviation of the population data set.
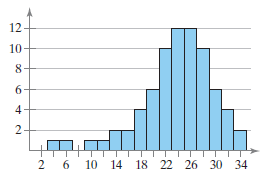
For the histogram in Exercise 22, which is greater, the mean or the median? Explain your reasoning. 12 10 6. 2 6 10 14 18 22 26 30 34 4) 2.
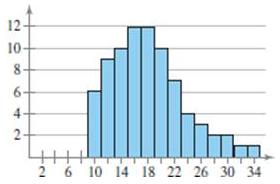
For the histogram in Exercise 21, which is greater, the mean or the median? Explain your reasoning.Data from exercise 21:Determine whether the approximate shape of the distribution in the histogram is symmetric, uniform, skewed left, skewed right, or none of these. 12- 10 8. 6. 4 2 6 10 14 18 22 26
Determine whether the approximate shape of the distribution in the histogram is symmetric, uniform, skewed left, skewed right, or none of these. 12 10 6. 2 6 10 14 18 22 26 30 34 4) 2.
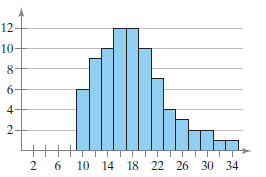
Determine whether the approximate shape of the distribution in the histogram is symmetric, uniform, skewed left, skewed right, or none of these. 12- 10 8. 6. 2- 2 6 10 14 18 22 26 30 34 4)
Describe the shape of the distribution for the histogram you made in Exercise 4 as symmetric, uniform, skewed left, skewed right, or none of these.
Describe the shape of the distribution for the histogram you made in Exercise 3 as symmetric, uniform, skewed left, skewed right, or none of these.
The responses of 1019 adults who were asked how much money they think they will spend on Christmas gifts in a recent year $1000 or more: 306 $250–999: 336 Less than $250: 234Not sure: 51
The vertical jumps (in inches) of a sample of 10 college basketball players at the 2016 NBA Draft Combine 33.0 35.5 37.5 31.0 28.0 29.5 21.0 26.0 24.0 29.5Find the mean, the median, and
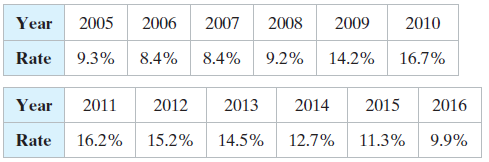
The U.S. real unemployment rates over a 12-year period are listed. Use a time series chart to display the data. Describe any patterns. Year 2005 2009 2006 2007 2008 2010 Rate 16.7% 9.3% 8.4% 8.4% 9.2% 14.2% Year 2015 2016 2012 2013 2011 2014 15.2% Rate 14.5% 16.2% 12.7% 11.3% 9.9%
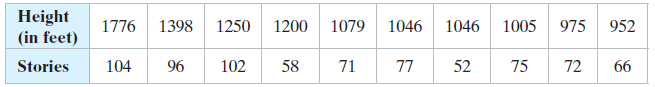
The heights (in feet) and the numbers of stories of the ten tallest buildings in New York City are listed. Use a scatter plot to display the data. Describe any patterns. Height (in feet) 1398 1250 1079 1005 1046 1200 1046 1776 975 952 Stories 58 52 72 66 104 96 102 71 77 75
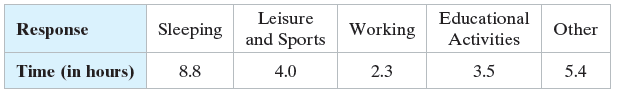
Use the data set, which represents the results of a survey that asked U.S. full-time university and college students about their activities and time use on an average weekday.Use a Pareto chart to display the data set. Describe any patterns. Leisure Educational Activities Response Sleeping Other
Use the data set, which represents the results of a survey that asked U.S. full-time university and college students about their activities and time use on an average weekday.Use a pie chart to display the data set. Describe any patterns. Leisure Educational Activities Response Sleeping Other
Use the data set, which represents the pollution indices for 24 U.S. cities.Use a dot plot to display the data set. Describe any patterns. 22 41 46 50 38 57 65 49 33 28 53 32 41 23 38 5 28 36 63 54 39 43 43 56 39
Use the data set, which represents the pollution indices for 24 U.S. cities.Use a stem-and-leaf plot to display the data set. Describe any patterns. 22 41 46 50 38 57 65 49 33 28 53 32 41 23 38 5 28 36 63 54 39 43 43 56 39
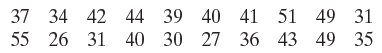
Construct a relative frequency histogram using the frequency distribution in Exercise 1. Then determine which class has the greatest relative frequency and which has the least relative frequency.Use the data set, which represents the overall average class sizes for 20 national universities. 37 34
Construct a frequency distribution for the data set using five classes. Include class limits, midpoints, boundaries, frequencies, relative frequencies, and cumulative frequencies.Use the data set, which represents the overall average class sizes for 20 national universities. 37 34 42 44 39 40 41 51
(a) Identify any outliers and (b) Draw a modified box-and-whisker plot that represents the data set.Use asterisks (*) to identify outliers.36 38 47 50 53 54 19 27 30 47 48 50 56 60 90 62
(a) Identify any outliers and (b) Draw a modified box-and-whisker plot that represents the data set.Use asterisks (*) to identify outliers.47 29 59 83 46 1 46 23 52 53
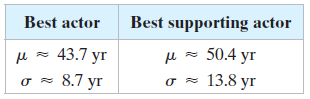
Compare the z-scores for the actors.Best Actor 1982: Henry Fonda, Age: 76Best Supporting Actor 1982: John Gielgud, Age: 77 Best supporting actor 50.4 yr 13.8 yr Best actor 43.7 yr 8.7 yr
Compare the z-scores for the actors.Best Actor 1970: John Wayne, Age: 62Best Supporting Actor 1970: Gig Young, Age: 56 Best supporting actor 50.4 yr 13.8 yr Best actor 43.7 yr 8.7 yr
Compare the z-scores for the actors.Best Actor 2005: Jamie Foxx, Age: 37Best Supporting Actor 2005: Morgan Freeman, Age: 67 Best supporting actor 50.4 yr 13.8 yr Best actor 43.7 yr 8.7 yr
Compare the z-scores for the actors.Best Actor 1984: Robert Duvall, Age: 53Best Supporting Actor 1984: Jack Nicholson, Age: 46 Best supporting actor 50.4 yr 13.8 yr Best actor 43.7 yr 8.7 yr
Use the corresponding z-score to determine whether the age is unusual. Explain your reasoning. Winner Year Age Christopher Froome 2013 28
Use the corresponding z-score to determine whether the age is unusual. Explain your reasoning. Winner Year Age 31 Christopher Froome 2016
Use the corresponding z-score to determine whether the age is unusual. Explain your reasoning. Winner Year Age 31 Christopher Froome 2016
Use the corresponding z-score to determine whether the age is unusual. Explain your reasoning. Winner Year Age 31 Christopher Froome 2016
Use the corresponding z-score to determine whether the age is unusual. Explain your reasoning. Winner Year Age 31 Christopher Froome 2016
Use the corresponding z-score to determine whether the age is unusual. Explain your reasoning. Winner Year Age 31 Christopher Froome 2016
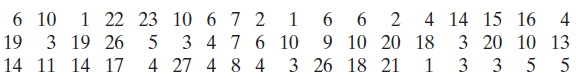
Use the data set, which represents wait times (in minutes) for various services at a state’s Department of Motor Vehicles locations.Which wait times are between the 25th and 75th percentiles? 1 22 23 10 6 7 2 3 19 26 11 14 17 4 14 15 16 3 20 10 13 3 6 10 4 3 4 7 6 10 5 4 27 4 8 4 9 10 19 20 18 3
Use the data set, which represents wait times (in minutes) for various services at a state’s Department of Motor Vehicles locations.Find the percentile that corresponds to a wait time of 20 minutes. 1 22 23 10 6 7 2 3 19 26 11 14 17 4 14 15 16 3 20 10 13 3 6 10 4 3 4 7 6 10 5 4 27 4 8 4 9 10 19
Use the data set, which represents wait times (in minutes) for various services at a state’s Department of Motor Vehicles locations.Which wait time represents the 50th percentile? How would you interpret this? 1 22 23 10 6 7 2 3 19 26 11 14 17 4 14 15 16 3 20 10 13 3 6 10 4 3 4 7 6 10 5 4 27 4 8
Use the data set, which represents wait times (in minutes) for various services at a state’s Department of Motor Vehicles locations.Draw an ogive to show corresponding percentiles for the data. 1 22 23 10 6 7 2 3 19 26 11 14 17 4 14 15 16 3 20 10 13 3 6 10 4 3 4 7 6 10 5 4 27 4 8 4 9 10 19 20 18
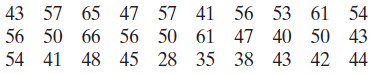
Use the data set, which represents the ages of 30 executives.Which ages are below the 25th percentile? 43 57 65 47 57 41 56 53 61 54 50 66 56 50 61 47 40 50 43 56 54 41 48 45 28 35 38 43 42 44
Use the data set, which represents the ages of 30 executives.Which ages are above the 75th percentile? 43 57 65 47 57 41 56 53 61 54 50 66 56 50 61 47 40 50 43 56 54 41 48 45 28 35 38 43 42 44
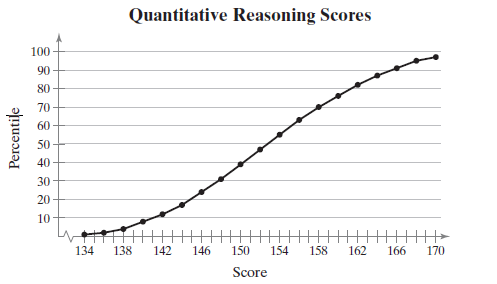
Use the ogive, which represents the cumulative frequency distribution for quantitative reasoning scores on the Graduate Record Examination in a recent range of years.What percentile is a score of 170? How should you interpret this? Quantitative Reasoning Scores 100 90 80 70 60 50 40 30 20 10 134
Use the ogive, which represents the cumulative frequency distribution for quantitative reasoning scores on the Graduate Record Examination in a recent range of years.What percentile is a score of 140? How should you interpret this? Quantitative Reasoning Scores 100 90 80 70 60 50 40 30 20 10 134
Use the ogive, which represents the cumulative frequency distribution for quantitative reasoning scores on the Graduate Record Examination in a recent range of years.Which score represents the 40th percentile? How should you interpret this? Quantitative Reasoning Scores 100 90 80 70 60 50 40 30 20
Use the ogive, which represents the cumulative frequency distribution for quantitative reasoning scores on the Graduate Record Examination in a recent range of years.What score represents the 70th percentile? How should you interpret this? Quantitative Reasoning Scores 100 90 80 70 60 50 40 30 20
Refer to the data set in Exercise 26 and the box-and-whisker plot you drew that represents the data set. (a) About 50% of the employees made less than what amount per hour?(b) What percent of the employees made more than $23.39 per hour?(c) What percent of the employees made between $23.39 and
Refer to the data set in Exercise 23 and the box-and-whisker plot you drew that represents the data set.(a) About 75% of the students studied no more than how many hoursper day? (b) What percent of the students studied more than 3 hours per day?(c) You randomly select one student from the
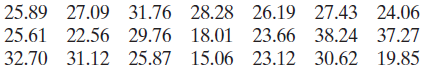
The hourly earnings (in dollars) of a sample of 21 employees at a consulting firmUse technology to draw a box-and-whisker plot that represents the data set. 25.89 27.09 31.76 28.28 26.19 27.43 24.06 25.61 22.56 29.76 18.01 23.66 38.24 37.27 32.70 31.12 25.87 15.06 23.12 30.62 19.85
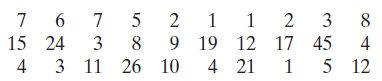
The commuting distances (in miles) of a sample of 30 employeesUse technology to draw a box-and-whisker plot that represents the data set. 3 4 2 1 9 19 10 15 24 4 3 12 17 45 45 4 21 5 12 3 11 26
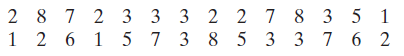
The numbers of hours spent studying per day by a sample of 28 studentsUse technology to draw a box-and-whisker plot that represents the data set. 2 8 7 2 3 3 3 2 2 7 8 3 5 1 1 2 6 1 5 7 3 8 5 3 3 7 6 2
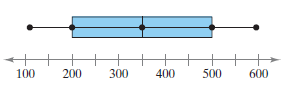
Use the box-and-whisker plot to determine whether the shape of the distribution represented is symmetric, skewed left, skewed right, or none of these. Justify your answer. 400 300 500 100 200 600
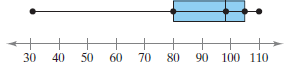
Use the box-and-whisker plot to determine whether the shape of the distribution represented is symmetric, skewed left, skewed right, or none of these. Justify your answer. 30 40 70 90 100 110 80 60 50
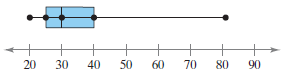
Use the box-and-whisker plot to determine whether the shape of the distribution represented is symmetric, skewed left, skewed right, or none of these. Justify your answer. 60 50 80 90 20 70 40 30
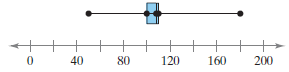
Use the box-and-whisker plot to determine whether the shape of the distribution represented is symmetric, skewed left, skewed right, or none of these. Justify your answer. 120 40 160 200 80
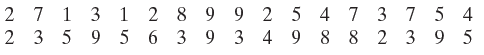
(a) Find the five-number summary, and (b) Draw a box-and-whisker plot that represents the data set. 2 7 1 3 1 2 8 9 2 3 5 9 5 6 3 9 2 5 4 7 3 7 5 4 9 8 8 2 3 9 4
(a) Find the five-number summary, and (b) Draw a box-and-whisker plot that represents the data set. 4 7 7 5 2 9 7 6 8 5 8 4 1 5 2 8 7 6 6 9
(a) Find the five-number summary, and (b) Draw a box-and-whisker plot that represents the data set. 171 176 182 150 178 180 173 170 174 178 181 180
(a) Find the five-number summary, and (b) Draw a box-and-whisker plot that represents the data set. 39 36 30 27 26 24 28 35 39 60 50 41 35 32 51
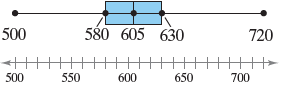
Use the box-and-whisker plot to identify the five-number summary. 500 580 605 630 720 550 650 600 500 700
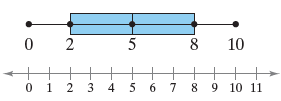
Use the box-and-whisker plot to identify the five-number summary. 5 10 ++ ++ ++ 3 4 5 6 7 8 9 9 10 11 2.
Determine whether the statement is true or false. If it is false, rewrite it as a true statement.It is impossible to have a z-score of 0.
Determine whether the statement is true or false. If it is false, rewrite it as a true statement.An outlier is any number above Q3 or below Q1.
Determine whether the statement is true or false. If it is false, rewrite it as a true statement.The second quartile is the mean of an ordered data set.
Determine whether the statement is true or false. If it is false, rewrite it as a true statement.About one-quarter of a data set falls below Q1.
Explain how to identify outliers using the interquartile range.
A student’s IQ score is in the 91st percentile on the Weschler Adult Intelligence Scale. Make an observation about the student’s IQ score.
A student’s score on the Fundamentals of Engineering exam is in the 89th percentile. Make an observation about the student’s exam score.
A motorcycle’s fuel efficiency represents the ninth decile of vehicles in its class. Make an observation about the motorcycle’s fuel efficiency.
The length of a guest lecturer’s talk represents the third quartile for talks in a guest lecture series. Make an observation about the length of the talk.
Sample grade point averages for ten male students and ten female students are listed.Find the coefficient of variation for each of the two data sets. Then compare the results. Males Females 2.8 2.4 3.7 3.8 3.9 2.8 2.6 3.6 3.3 3.7 2.1 3.9 36 4.0 20 3.9 4.0 1.9 3.7 2.3
Sample SAT scores for eight males and eight females are listed.Find the coefficient of variation for each of the two data sets. Then compare the results. Males 1010 1170 1410 920 1320 1100 690 1140 Females 1190 1010 1000 1300 1470 1250 840 1060
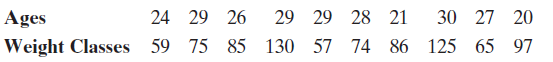
The ages (in years) and weight classes (in kilograms) of all members of the 2016 Men’s U.S. Olympic wrestling team are listed.Find the coefficient of variation for each of the two data sets. Then compare the results. 29 29 28 21 57 74 86 125 65 97 Ages 24 29 26 30 27 20 Weight Classes 59 75 85 130
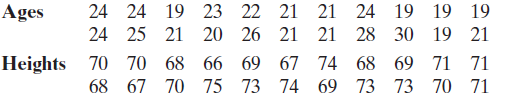
The ages (in years) and heights (in inches) of all members of the 2016 Women’s U.S. Olympic swimming team are listed.Find the coefficient of variation for each of the two data sets. Then compare the results. 24 24 19 23 22 21 21 24 19 19 19 24 25 21 20 26 21 21 28 30 19 21 Heights 70 70 68 66 69
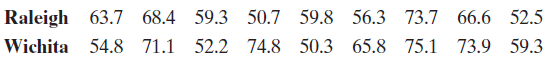
Sample annual salaries (in thousands of dollars) for entry level software engineers in Raleigh, NC, and Wichita, KS, are listed.Find the coefficient of variation for each of the two data sets. Then compare the results. Raleigh 63.7 68.4 59.3 50.7 59.8 Wichita 54.8 71.1 52.2 74.8 50.3 56.3 73.7 66.6
A study shows the closer that participants were to an optimal sleep duration target, the better they performed on a standardized test. (Source: Eastern Economics Journal)(a) Identify the sample used in the study.(b) What is the population?(c) Which part of the study represents the descriptive
A study shows that the obesity rate among adolescents has steadily increased since 1988. From this study, a researcher infers that this trend will continue in future years. What is wrong with this type of reasoning?
A study of 876 senior citizens shows that participants who exercise regularly exhibit less of a decline in cognitive ability than those who barely exercise at all. From this study, a researcher infers that your cognitive ability increases the more your exercise. What is wrong with this type of
Which part of the survey described in Exercise 32 represents the descriptive branch of statistics? What conclusions might be drawn from the survey using inferential statistics?Data from Exercise 32:A survey of 1254 preowned automobile shoppers found that 5% bought extended warranties.
Which part of the survey described in Exercise 31 represents the descriptive branch of statistics? What conclusions might be drawn from the survey using inferential statistics?Data from Exercise 31:A survey of 1029 U.S. adults found that 23% of those suffering with chronic pain had been diagnosed
In a recent year, the average math score on the ACT for all graduates was 20.6.Determine whether the number describes a population parameter or a sample statistic. Explain your reasoning.
A survey of 2008 U.S. adults found that 80% think that the militant group known as ISIS is a major threat to the well-being of the United States.Determine whether the number describes a population parameter or a sample statistic. Explain your reasoning.
Voter registration records show that 87% of all voters in a county are registered as Democrats.Determine whether the number describes a population parameter or a sample statistic. Explain your reasoning.
In a survey of 400 computer users, 7% said their computers had malfunctions that needed to be repaired by service technicians.Determine whether the number describes a population parameter or a sample statistic. Explain your reasoning.
In January 2016, 62% of the governors of the 50 states in the United States were Republicans.Determine whether the number describes a population parameter or a sample statistic. Explain your reasoning.
Sixty-two of the 97 passengers aboard the Hindenburg airship survived its explosion.Determine whether the number describes a population parameter or a sample statistic. Explain your reasoning.
A survey of 1058 college board members found that 56.3% think that college completion is a major priority or the most important priority for their board.Determine whether the number describes a population parameter or a sample statistic. Explain your reasoning.
The average salary for 45 of a consulting firm’s 300 engineers is $72,000.Determine whether the number describes a population parameter or a sample statistic. Explain your reasoning.
A survey of 1060 parents of 13- to 17-year-olds found that 636 of the 1060 parents have checked their teen’s social media profile.Identify the population and the sample. Describe the sample data set.
To gather information about starting salaries at companies listed in the Standard & Poor’s 500, a researcher contacts 54 of the 500 companies.Identify the population and the sample. Describe the sample data set.
A survey of 1254 preowned automobile shoppers found that 5% bought extended warranties.Identify the population and the sample. Describe the sample data set.
A survey of 1029 U.S. adults found that 23% of those suffering with chronic pain had been diagnosed with a sleep disorder.Identify the population and the sample. Describe the sample data set.
A survey of 496 students at a high school found that 95% planned on going to college.Identify the population and the sample. Describe the sample data set.
A survey of 159 U.S. law firms found that the average hourly billing rate for partners was $604.Identify the population and the sample. Describe the sample data set.
A survey of 1100 travelers worldwide found that 53% of respondents with pets travel with their pets.Identify the population and the sample. Describe the sample data set.
A survey of 3301 U.S. adults found that 39% received an influenza vaccine for a recent flu season.Identify the population and the sample. Describe the sample data set.
A study of 203 infants was conducted to find a link between fetal tobacco exposure and focused attention in infancy.Identify the population and the sample. Describe the sample data set.
Showing 2700 - 2800
of 2934
First
16
17
18
19
20
21
22
23
24
25
26
27
28
29
30
Step by Step Answers