New Semester
Started
Get
50% OFF
Study Help!
--h --m --s
Claim Now
Question Answers
Textbooks
Find textbooks, questions and answers
Oops, something went wrong!
Change your search query and then try again
S
Books
FREE
Study Help
Expert Questions
Accounting
General Management
Mathematics
Finance
Organizational Behaviour
Law
Physics
Operating System
Management Leadership
Sociology
Programming
Marketing
Database
Computer Network
Economics
Textbooks Solutions
Accounting
Managerial Accounting
Management Leadership
Cost Accounting
Statistics
Business Law
Corporate Finance
Finance
Economics
Auditing
Tutors
Online Tutors
Find a Tutor
Hire a Tutor
Become a Tutor
AI Tutor
AI Study Planner
NEW
Sell Books
Search
Search
Sign In
Register
study help
mathematics
introduction to business statistics
Introduction To Statistical Investigations 1st Edition Beth L.Chance, George W.Cobb, Allan J.Rossman Nathan Tintle, Todd Swanson Soma Roy - Solutions
Recall from Exercise 10.1.12 that the data file Roller Coasters contains data (collected from www.rcdb.com) on the maximum speed (miles per hour) and the maximum height (feet) for each of a sample of roller coasters in the U.S.a. State in words the appropriate null and alternative hypotheses to
Refer to the previous exercise about the association between prices and sizes of houses. Recall that the data file HousePrices contains data on prices ($) and sizes (in square feet) for a random sample of houses that sold in the year 2006 in Arroyo Grande, California.a. Enter the data into the
Recall from Exercise 10.1.11 that the data file HousePrices contains data on prices ($) and sizes (in square feet) for a random sample of houses that sold in the year 2006 in Arroyo Grande, California.a. State in words the appropriate null and alternative hypotheses to test whether there is an
Refer to the previous exercise about the association between the age and price of used Honda Civics. Consider conducting a test of significance to investigate whether the sample data provide strong evidence of an association between a car’s price and age in the population of used Honda Civics.
The data in the file UsedHondaCivics come from a sample of used Honda Civics listed for sale online in July 2006. Th e variables recorded in this data file are the car’s age (calculated as 2006 minus year of manufacture) and price. Consider conducting a simulation analysis to test whether the
Refer to the previous exercise about the association between height and the length of the index finger. Recall that the data file HeightAnd FingerLength contains data on the height (inches) and the length of the index finger of the dominant hand (cm) for students in a statistics class. The
Refer to the previous exercise about the association between height and length of index finger. Recall that the data file HeightAnd FingerLength contains data on the height (inches) and the length of the index finger of the dominant hand (cm) for students in a statistics class. Describe how one
Recall from Exercise 10.1.13 that the data file HeightAnd FingerLength contains data on the height (inches) and the length of the index finger of the dominant hand (cm) for students in a statistics class. State in words the appropriate null and alternative hypotheses to test whether there is an
Two researchers want to investigate whether there is a relationship between annual company profit ($) and median annual salary paid by the company ($). Researcher Bart collects data on a random sample of 40 companies, and researcher Lisa collects data on a random sample of 140 companies. Aft er
A researcher wants to investigate whether there is a relationship between annual company profit ($) and median annual salary paid by the company ($). The researcher collects data on a random sample of companies and aft er analyzing the data finds the p-value to be 0.56. Which of the following is an
An instructor wanted to investigate whether there was an association between height (inches) and hand span (cm). She collected data from 10 students and aft er analyzing the data found the p-value to be 0.022. For each of the following statements, indicate whether or not the statement is valid or
The data file TVLife provides information on life expectancy and number of televisions per thousand people in a sample of 22 countries, as reported by the 2006 World Almanac and Book of Facts. Enter the data into the Corr/Regression applet.a. Identify the type of study: randomized experiment or
Refer back to the previous two exercises that explore the association between number of letters in a name and the corresponding Scrabble score. Recall that the data file ScrabbleNames contains data on number of letters in students’ names and the corresponding Scrabble points, whereas the data
Refer back to the previous exercise about exploring the relationship between the number of letters in a name and the corresponding Scrabble score. Recall that students were asked to calculate the number of Scrabble points their names would earn. Students were also asked to calculate the points per
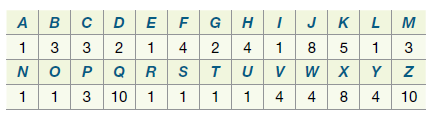
Have you ever played the game Scrabbleo? It is a word building game where certain letters earn you more points than others when you use them in your word. Hereis the table of letters and the corresponding Scrabble points:In a statistics class, students were asked to calculate the number of
Refer back to the previous two exercises that explore the association between children’s heights and (biological) parents’ heights. Recall that the data file DadandChildHeights contains data for students in a statistics class on the following two variables: student’s height (inches) and
Refer back to the previous exercise that explores the association between children’s heights and (biological) mothers’ heights. The data file DadandChildHeights contains data for students in a statistics class on the following two variables: student’s height (inches) and biological father’s
In 1885, Sir Francis Galton first used regression to explore the association between children’s heights and (biological) parents’ heights. The data file MomandChildHeights contains data for students in a statistics class on the following two variables: student’s height (inches) and biological
Refer to the previous exercises that investigated the association between length of index finger and height. The data file HeightAndFingerLength contains data on the height (inches) and the length of index finger of dominant hand (cm) for students in a statistics class.a. Once again, using
Refer to the previous exercise that investigated the association between length of index finger and height. The data file HeightAndFingerLength contains data on the height (inches) and the length of index finger of dominant hand (cm) for students in a statistics class.a. Using appropriate
An article titled “Giving the Finger to Dating Services” appeared in Chance magazine (2008) that investigated the association between length of index finger and height. This research was spurred by a report that online dating sites were asking members for the length of their index fingers.
The data file RollerCoasters contains data (collected from www.rcdb.com) on the maximum speed (miles per hour) and the maximum height (feet) for each of a sample of roller coasters in the U.S. Enter the data into the Corr/ Regression applet.a. Identify the type of study: randomized experiment or
The data file HousePrices contains data on prices ($) and sizes (in square feet) for a random sample of houses that sold in the year 2006 in Arroyo Grande, California. Enter the data into the Corr/Regression applet.a. Identify the type of study: randomized experiment or observational study.b.
For each of the following statements, say what, if anything, is wrong.a. Because the correlation coefficient between test time and test score is −0.56, the correlation coefficient between test score and test time must be 0.56 (the positive value).b. There is a strong positive correlation between
If two variables are negatively associated, then we know that:A. Above-average values in one variable correspond to below-average values in the other variable.B. Above-average values in one variable correspond to above-average values in the other variable.C. Below-average values in one variable
Which of the following statements is correct?A. Changing the units of measurements of the explanatory or response variable does not change the value of the correlation.B. A negative value for the correlation indicates that there is no relationship between the two variables.C. The correlation has
Which of the following is not a property of correlation, r?A. −1 ≤ r ≤ 1B. Correlation measures the strength of a linear relationship between two quantitative variables.C. Th e sign on r tells the direction of the linear relationship between two quantitative variables.D. If the correlation
The data shown in the following scatterplot show a very nice relationship between the two variables. However, the correlation here is 0.03, very close to zero. Explain why we can have a nice relationship between two quantitative variables and yet have a correlation of 0. 18 16 14 12 10 8 4 2 4 8
Fill in the blanks, choosing from: values of the response, values of the explanatory variable, observational units:In a scatterplot, the points are ________________; the x-axis represents _________________; and the y-axis represents ___________________.
Six statements about what you can learn from the correlation coefficient are listed below. Label each statement, choosing from A (can always tell), N (can never tell), or S (can sometimes tell). For each statement you label S for sometimes, explain briefly when you can tell and when you cannot.a.
Suppose that you record the daily high temperature and the daily amount of ice cream sold by an ice cream vendor at your favorite beach this summer, starting on Memorial Day weekend and ending on Labor Day weekend. Would you expect to find a positive or negative association between these variables?
Suppose that every student in this class scored 5 points lower on the second exam than on the first exam. Consider the correlation coefficient between first exam score and second exam score. What would the value of this correlation coefficient be? Explain briefly.
Suppose that a study measures how far each student sits from the front of the classroom and also records the student’s final exam score. If better students tend to sit closer to the front, would the association between distance and exam score be positive, negative, or close to zero? Explain
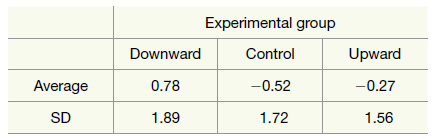
Summarize the findings from the study. What worked well in this study design? What would you change? What are some follow-up research questions you would like to explore based on the findings from this study?The following table provides descriptive statistics on the measurements for
To what broader population are you willing to generalize your findings? Explain.The following table provides descriptive statistics on the measurements for aggression: Experimental group Control Downward Upward Average -0.52 -0.27 0.78 1.89 1.72 1.56 SD
Can you conclude that you have found strong evidence of a cause-and-effect relationship between the three groups that received different kinds of feedback and their aggressiveness toward their partner? Explain.The following table provides descriptive statistics on the measurements for
Find confidence intervals for each pair of differences in population means. Comment on how this shows where differences can be established and where it is plausible there are no differences between population means.
Are the validity conditions met so that we can perform follow-up analyses using theory based techniques? Explain.The following table provides descriptive statistics on the measurements for aggression: Experimental group Control Downward Upward Average -0.52 -0.27 0.78 1.89 1.72 1.56 SD
Are the validity conditions met to complete a theory-based ANOVA test for these data? Explain. If the conditions are met, use a theory-based ANOVA test to find a p-value for this test.The following table provides descriptive statistics on the measurements for aggression: Experimental group
Use the appropriate applet to construct a simulated null distribution using the MAD statistic. Mark the observed MAD statistic calculated in the previous question on this graph. Th e name of the data set is Aggression.a. Paste a screen shot or draw your null distribution below with the observed MAD
Calculate the MAD (mean absolute value of the differences) for these data.The following table provides descriptive statistics on the measurements for aggression: Experimental group Control Downward Upward Average -0.52 -0.27 0.78 1.89 1.72 1.56 SD
State the null and alternative hypotheses to be investigated with this study. (You may use the symbol μ to represent these parameters.)
Is there an explanatory/response relationship for these variables? Classify the variables in this study as categorical or quantitative.
While there are many variables recorded on each subject, state the two variables that will help to answer the research question.
What are the observational/experimental units?
A colleague went to the lego.com website in February 2014 and recorded the number of pieces and the sales price for 157 Lego products listed there. The data appear in the Legos data file.a. Which variable do you think makes more sense to use as the explanatory variable and which as the response
Reconsider the previous exercise. For each of the descriptions presented that is indeed possible, produce a scatterplot of hypothetical data to show that the description is indeed possible.Data from previous exercisea. Can a slope coefficient ever be negative?b. Can a slope coefficient ever be
The data in the file SleepHeight was obtained from a survey of statistics students. The variables recorded are the student’s heights (in inches) and the amount of sleep they typically get on a school night (in hours). Consider conducting an analysis to test whether the sample data provide strong
Reconsider the previous exercise on weight and haircut price.a. Find the regression equation that predicts the haircut price based on weight.b. Interpret the slope and intercept of the regression line.Data from previous exerciseIn a survey of statistics students at Hope College, two of the
In a survey of statistics students at Hope College, two of the questions asked were their height (in inches) and the cost of their last haircut, including any hair treatments (in dollars). The data can be found in the file HeightHaircut. Let’s explore whether or not there is evidence of a strong
In a survey of statistics students at Hope College, two of the questions asked were their weight (in pounds) and the cost of their last haircut, including any hair treatments (in dollars). The data can be found in the file Weight- Haircut. Let’s explore whether or not there is evidence of a
Reconsider the previous exercise on prices of Honda Civics.a. Find the regression equation that predicts the price of the car given its age.b. Interpret the slope and intercept of the regression line.Data from previous exerciseThe data in the file UsedHondaCivics come from a sample of used Honda
The data in the file UsedHondaCivics come from a sample of used Honda Civics listed for sale online in July 2006. Th e variables recorded are the car’s age (calculated as 2006 minus year of manufacture) and price. Consider conducting a simulation analysis to test whether the sample data provide
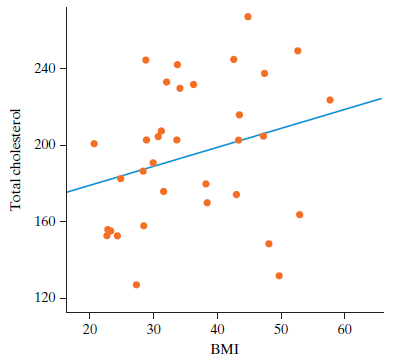
Reconsider the previous exercise about the cholesterol and BMI. The equation of the least squares regression line obtained was cholesterol = 162.56 ˆ’ 0.9658 (BMI).a. Interpret what the slope coefficient means in the context of cholesterol and BMI.b. Interpret the intercept. Is this an
In a study to see if there was an association between weight loss and the amount of a certain protein in a person€™s body fat, the researchers measured a number of different attributes in their 39 subjects at the beginning of the study. The article reported, €œThese subjects
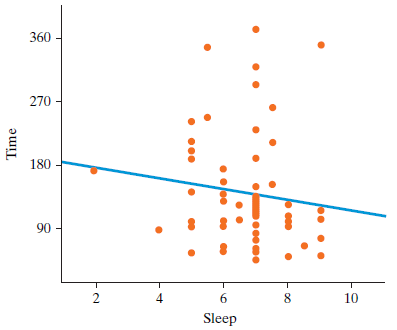
Reconsider the previous exercise about the amount of sleep (in hours) obtained in the previous night and time to complete a paper and pencil maze (in seconds). The equation of the least squares regression line for predicting price from number of pages is time = 190.33 ˆ’ 7.76 (sleep).a.
Student researchers asked their subjects how much sleep they had the previous night (in hours) and then timed how long it took them (in seconds) to complete a paper and pencil maze. The results are shown in the scatterplot along with the regression line.a. What is the explanatory variable?b. What
Reconsider the previous two exercises about textbook prices. Th e equation of the least squares regression line for predicting price from number of pages is price = 14.11 + 0.13 (pages).a. Interpret what the slope coefficient means in the context of pages and price.b. Interpret the intercept. Is
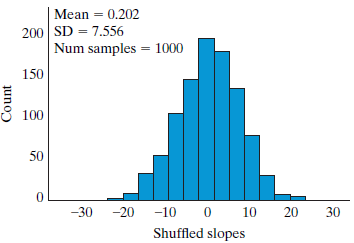
Refer to the data in the previous exercise.a. State the null and alternative hypotheses for a test of possible association between pages and price.b. The null distribution for Exercise 10.4.7 was created to test the hypotheses stated in the previous question using slope as the statistic.i. Based on
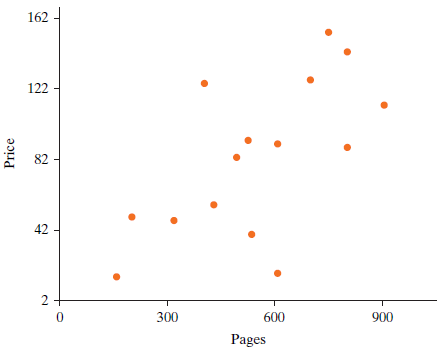
A random sample of 15 textbooks in a campus bookstore was selected. Two of the variables recorded were the price of the book (in dollars) and the number of pages it contained. The data are displayed in the following scatterplot. Summarize the form, direction and strength of association of the
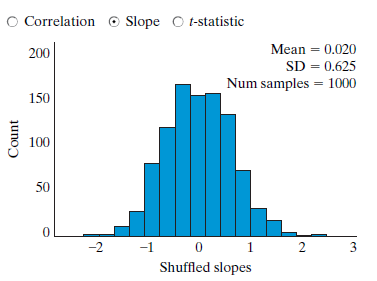
Suppose you are testing to see if there is an association between a person’s height and their vertical leap. You’ve collected data on this from 20 people. Describe how you would construct a null distribution for this situation by hand using the slope of the regression line as your statistic.
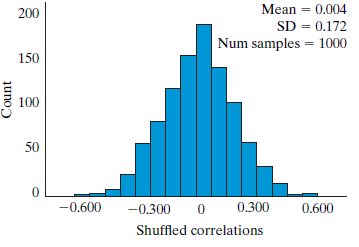
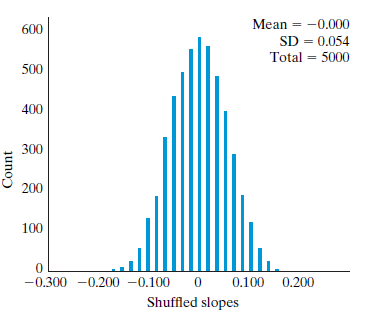
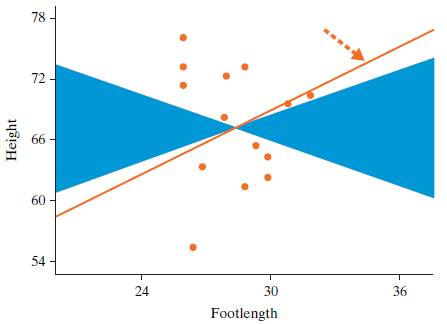
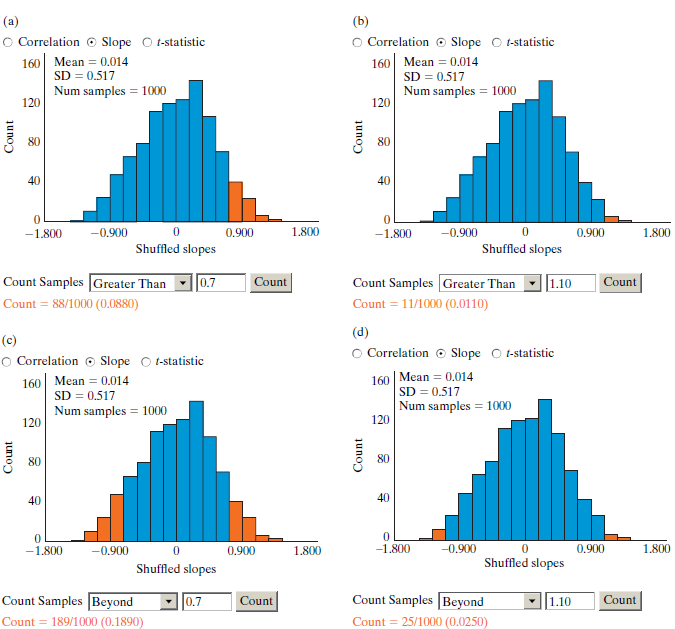
Using foot length and height data, we shuffled the y-values 100 times and each time plotted the resulting regression line in the graph shown for Exercise 10.4.4. The regression line for the observed data is the one being pointed at with the dashed arrow. Based on the plot of these lines, what can
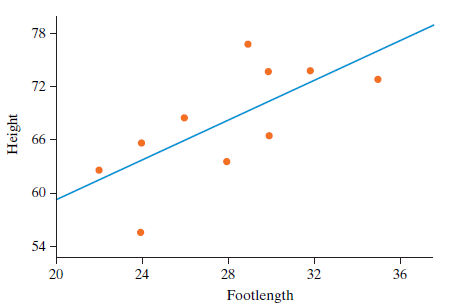
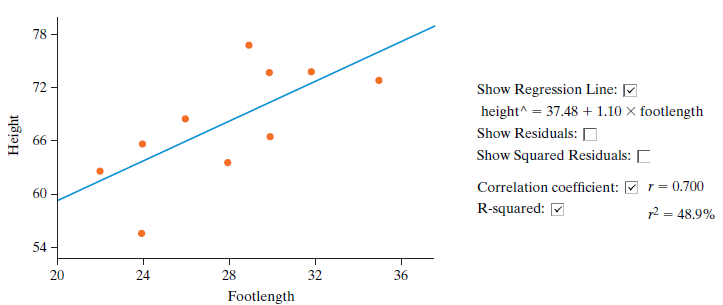
Referring to the previous exercise, describe how you would construct a null distribution for this situation by hand using the slope of the regression line as your statistic. Assume you have 20 slips of paper.Data from previous exerciseSuppose a sample of 10 people had their foot lengths (cm) and
Suppose a sample of 10 people had their foot lengths (cm) and heights (inches) measured. The results, along with the regression line, are shown in the scatterplot below. The equation of the regression line, correlation coefficient, and r2 are also shown. Which one of the applet screenshots of
When testing the hypothesis that there is no association (null) vs. an association (alternative) you can use either the sample correlation coefficient or the sample slope as the statistic. How will the p-values compare when using both approaches on the same data set?A. The result from using slope
Read FAQ 10.3.1. In your own words explain why using the sum of the absolute deviations is problematic in some scatterplots and, in turn, why the sum of squared deviations is preferred.
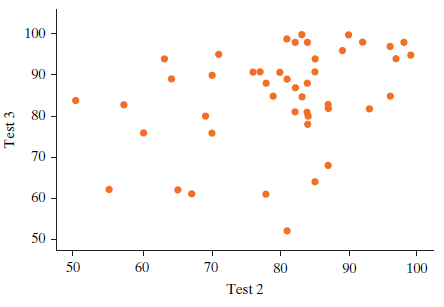
Reconsider the previous exercise.a. Determine the predicted score on Test 3 for a student who scores 55 on Test 2.b. Determine the predicted score on Test 3 for a student who scores 95 on Test 2.c. Of the two students in parts (a) and (b), which student is predicted to achieve a higher score on
The following scatterplot represents scores on Test 2 and Test 3 in Introductory Statistics for a random sample of students.The regression equation for these data is ŷ = 55.2 + 0.3708x, where x is the score on Test 2 and yˆ is the expected score on Test 3. The mean for Test
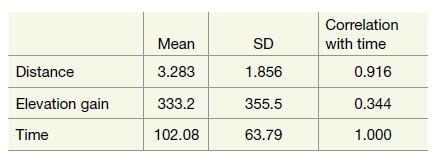
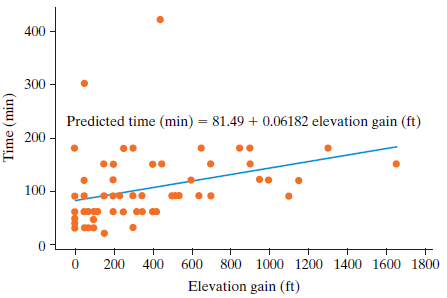
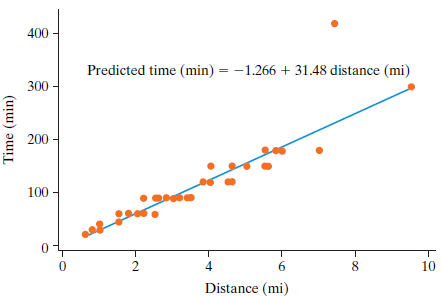
The slope b and intercept a of a least squares line can be calculated from the means and standard deviations of the two variables, along with the correlation coefficient, as follows: b = r(sy/sx) and a = yÌ… ˆ’ bxÌ…. These summary statistics for the day hikes
Reconsider the previous exercise. The following scatterplot displays hiking time vs. elevation gain, with the least squares line superimposed:
The book Day Hikes in San Luis Obispo County lists information about 72 hikes, including the distance of the hike (in miles), the elevation gain of the hike (in feet), and the time that the hike is expected to take (in minutes). Consider the scatterplot below, with least squares regression line
Two Cal Poly freshmen gathered data on a random sample of textbooks from the campus bookstore in November of 2006. Two of the variables recorded were the price of the book and the number of pages that it contained. These data are in the file TextbookPrices.a. Identify the explanatory and response
The data in the file UsedHondaCivics come from a sample of used Honda Civics listed for sale online in July 2006. Th e variables recorded are age (calculated as 2006 minus year of manufacture) and price.a. Identify the observational units.b. Produce a scatterplot of price vs. age. Describe the
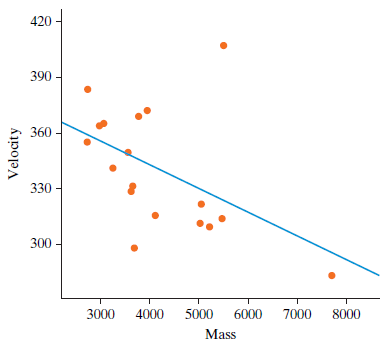
Reconsider the previous three exercises and the CatJumping data file. Investigate the association between the response variable (takeoff velocity) and the other explanatory variables (hind limb length, muscle mass, percent body fat).a. Select the explanatory variable that has the strongest
Reconsider the previous two exercises. Answer the following based on the scatterplot presented above. Do not bother to perform any calculations.a. Which cat has the largest predicted value for its takeoff velocity?b. Which cat has the smallest predicted value for its takeoff velocity?c. Which cat
Reconsider the previous exercise and the CatJumping data file.a. Determine the predicted takeoff velocity for a cat with a mass of 5,000 grams (which is about 11 pounds).b. Determine the predicted takeoff velocity for a cat with a mass of 10,000 grams. Also explain why it€™s not advisable
Harris and Steudel (2002) studied factors that might be associated with the jumping performance of domestic cats. They studied 18 cats, using takeoff velocity (in centimeters per second) as the response variable. They used body mass (in grams), hind limb length (in centimeters), muscle mass (in
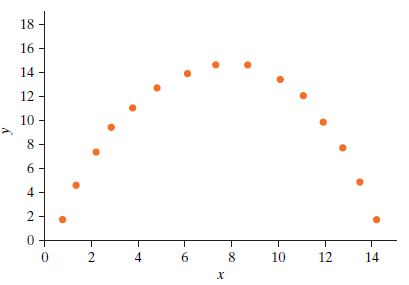
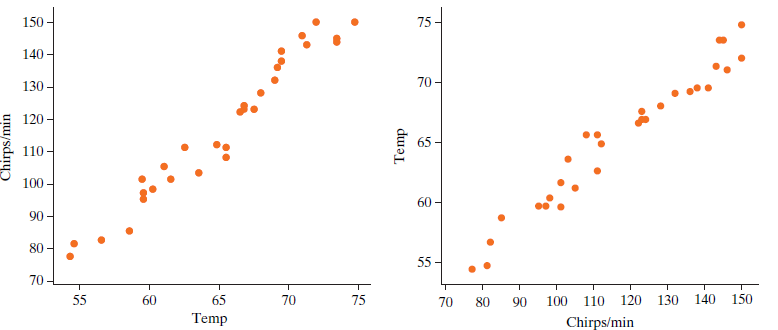
Consider the following two scatterplots based on data gathered in a study of 30 crickets, with temperature measured in degrees Fahrenheit and chirp frequency measured in chirps per minute.a. If the goal is to predict temperature based on a cricket€™s chirps per minute, which is the
Reconsider the previous six exercises and the Legos data file. This is very unrealistic, but suppose that one of the products were to be offered at a price of $0.a. Would you expect this change to affect the least squares line very much? Explain.b. For which one product would you expect this change
Reconsider the previous five exercises and the Legos data file. The last product listed in the data file has 415 pieces and a price of $49.99.a. Determine the predicted price for such a product.b. Determine the residual value for this product.c. Interpret what this residual value means.d. Does the
Reconsider the previous four exercises and the Legos data file.a. Determine the predicted price for a product with 500 pieces.b. Determine the predicted price for a product with 1,500 pieces.c. Determine the difference between the two predictions in parts (a) and (b). Also indicate how you could
Reconsider the previous three exercises and the Legos data file. The equation of the least squares line turns out to be price = 4.86 + 0.105 × pieces, and the value of r2 = 0.949. Identify which of the following interpretations are correct, which are incorrect, and which are correct but incomplete
Reconsider the previous two exercises and the Legos data file. The equation of the least squares line turns out to be price 5 4.86 + 0.105 × pieces, and the value of r2 = 0.949. Identify which of the following interpretations are correct, which are incorrect, and which are correct but incomplete
Reconsider the previous exercise and the Legos data file.a. Determine the equation of the least squares line for predicting price from number of pieces. Report this equation using good statistical notation.b. Interpret the value of the slope coefficient in this context.c. Interpret the value of the
a. Can a slope coefficient ever be negative?b. Can a slope coefficient ever be greater than 1?c. Can a slope coefficient ever equal zero?
It can be shown that the sum of residuals from a least squares line always equals zero.a. Does it follow from this result that the mean of the residuals from a least squares line always equals zero? Explain briefly.b. Does it follow from this result that the median of the residuals from a least
Explain what is wrong with the following statements about correlation and regression.a. The correlation between the number of years of education and yearly income is 1.23.b. The regression equation that describes the relationship between the age of a used Ford Mustang and its value is ŷ =
Which of the following does the method of least squares minimize?A. Sum of vertical distances between observations and the lineB. Sum of squared vertical distances between observations and the lineC. Sum of perpendicular distances between observations and the lineD. Sum of squared perpendicular
Refer back to the previous exercise. Recall that the data file TVLife provides information on life expectancy and number of televisions per thousand people in a sample of 22 countries, as reported by the 2006 World Almanac and Book of Facts.a. Enter the data into the Corr/Regression applet and
Read FAQ 10.2.1. Was there a parameter in the draft lottery example? Why or why not?
Recall from Exercise 10.1.22 that the data file TVLife provides information on life expectancy and number of televisions per thousand people in a sample of 22 countries, as reported by the 2006 World Almanac and Book of Facts.a. State in words the appropriate null and alternative hypotheses to test
Refer back to the previous exercise. Recall that the data file ScrabbleRatio contains Scrabble points for a student’s name and the corresponding ratio of Scrabble points to number of letters.a. Enter the data into the Corr/Regression applet and conduct a simulation-based test of significance.
Refer back to Exercise 10.1.20 about exploring the relationship between the number of letters in a name and the corresponding Scrabble score. Students were also asked to calculate the points per letter, that is, ratio = (Scrabble score)/(number of letters in name). The data file ScrabbleRatio
Refer back to the previous exercise about exploring the relationship between the number of letters in a name and the corresponding Scrabble score. Recall that the data file ScrabbleNames contains data on the following two variables: number of letters in a student’s name and the corresponding
Recall from Exercise 10.1.19 that in a statistics class students were asked to calculate the number of Scrabble points their names would earn. For example, the Scrabble score for the name Tom Sawyer would be 17 points. The data file ScrabbleNames contains data on the following two variables: number
Suppose a friend of yours is telling you about a study reported in a popular magazine. The friend said that the study reported a correlation of zero between the amount of coffee a person drank as a child and his or her height as an adult. Your friend interprets this correlation to mean that the
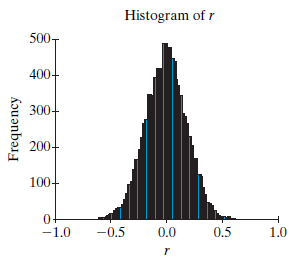
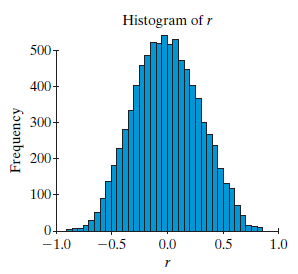
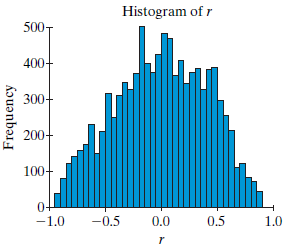
Three histograms are shown here. Each shows simulated values of r obtained by breaking the association on one of the scatterplots (A)€“(C) in (10.CE.15). Which histogram is for each plot? How can you tell? Histogram of r 500- 400- 300- 200- 100- 0- -1.0 -0.5 0.0 0.5 1.0 Frequency
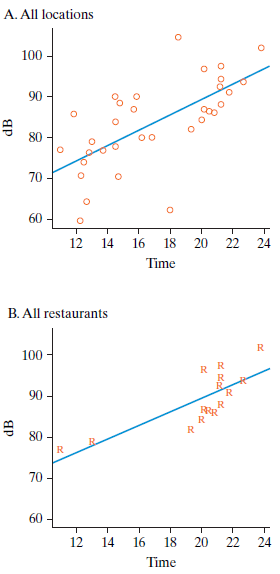
a. Refer to Plot A, the scatterplot for all locations in the survey. Note that between 12 noon and midnight (24) the fitted decibel level goes from about 75 to about 95. Use this fact to estimate the decibel level at the y-intercept. (For comparison, a measurement taken in the Evergreens Cemetery
a. Why is it not possible to conclude from the data that decibel levels increase as it gets later in the day?b. How could the design of the study be improved in order to allow better conclusions about the effect of time of day on noise level?
Fill in the blanks based on the patterns in the data.a. For restaurants, the correlation between average noise level and time becomes ________ (stronger, weaker) if you exclude the two lunch-time measurements.b. For stores, the noise level _______ (is, is not) related to time of day.c. For the all
Showing 400 - 500
of 2042
1
2
3
4
5
6
7
8
9
10
11
12
13
14
15
Last
Step by Step Answers