New Semester
Started
Get
50% OFF
Study Help!
--h --m --s
Claim Now
Question Answers
Textbooks
Find textbooks, questions and answers
Oops, something went wrong!
Change your search query and then try again
S
Books
FREE
Study Help
Expert Questions
Accounting
General Management
Mathematics
Finance
Organizational Behaviour
Law
Physics
Operating System
Management Leadership
Sociology
Programming
Marketing
Database
Computer Network
Economics
Textbooks Solutions
Accounting
Managerial Accounting
Management Leadership
Cost Accounting
Statistics
Business Law
Corporate Finance
Finance
Economics
Auditing
Tutors
Online Tutors
Find a Tutor
Hire a Tutor
Become a Tutor
AI Tutor
AI Study Planner
NEW
Sell Books
Search
Search
Sign In
Register
study help
mathematics
introduction to business statistics
Introduction To Statistical Investigations 1st Edition Beth L.Chance, George W.Cobb, Allan J.Rossman Nathan Tintle, Todd Swanson Soma Roy - Solutions
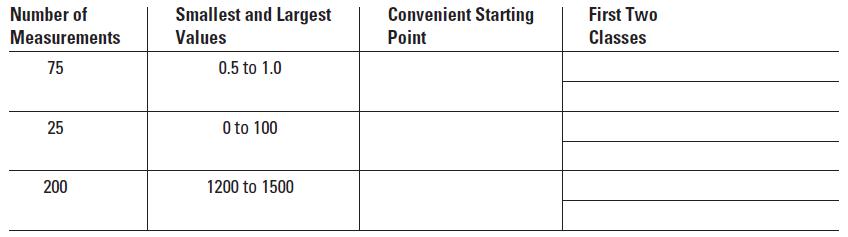
Refer to Exercise 1.16. For the same data sets, select a convenient starting point, and list the class boundaries for the first two classes. Smallest and Largest Values Convenient Starting Point Number of Measurements 75 First Two Classes 0.5 to 1.0 25 O to 100 1200 to 1500 200 Number of
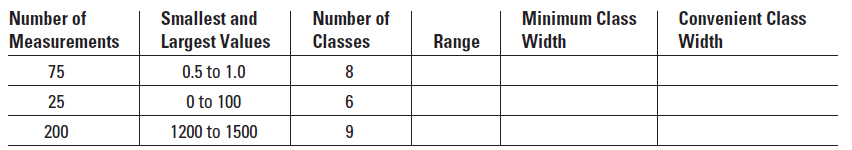
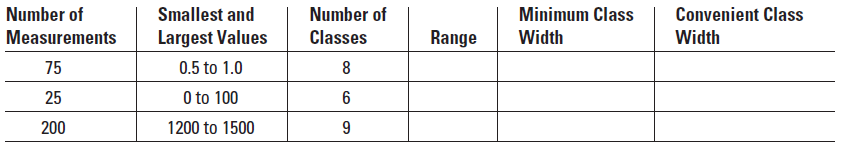
For the following data sets, find the range, the minimum class width, and a convenient class width. Convenient Class Width Number of Smallest and Largest Values Number of Classes Minimum Class Width Range Measurements 0.5 to 1.0 75 25 O to 100 200 1200 to 1500
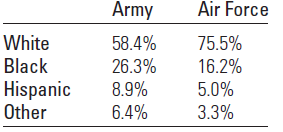
The four branches of the armed forces in the United States are quite different in their makeup with regard to gender, race, and age distributions. The table below shows the racial breakdown of the members of the United States Army and the United States Air Force.3a. Define the variable that has
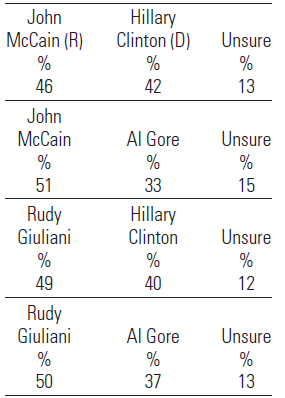
During the spring of 2006 the news media were already conducting opinion polls that tracked the fortunes of the major candidates hoping to become the president of the United States. One such poll conducted by Financial Dynamics showed the following results:1 €œThinking ahead to the next
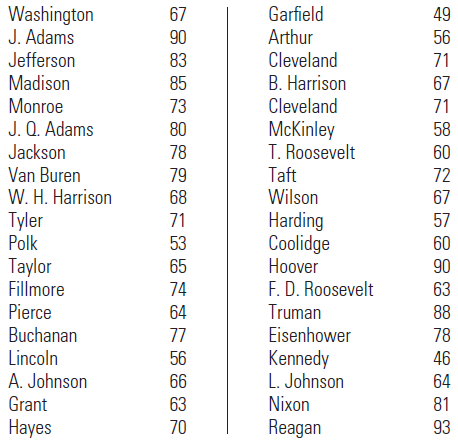
Listed below are the ages at the time of death for the 38 deceased American presidents from George Washington to Ronald Reagan:5a. Construct a stem and leaf plot for the data. Describe the shape. Does it surprise you?b. The five youngest presidents at the time of death appear in the lower
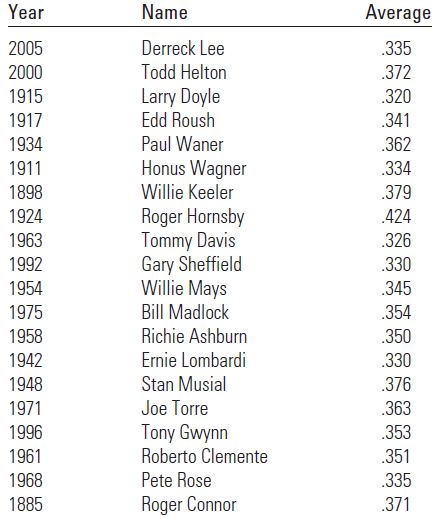
The officials of major league baseball have crowned a batting champion in the National League each year since 1876. A sample of winning batting averages is listed in the table:5a. Construct a relative frequency histogram to describe the batting averages for these 20 champions.b. If you were to
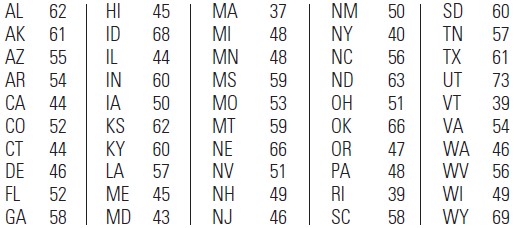
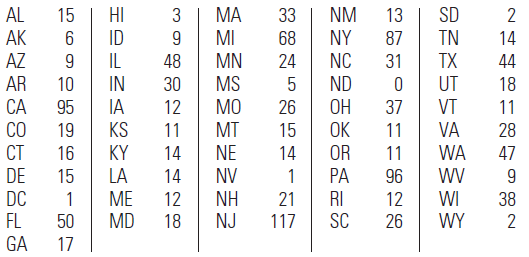
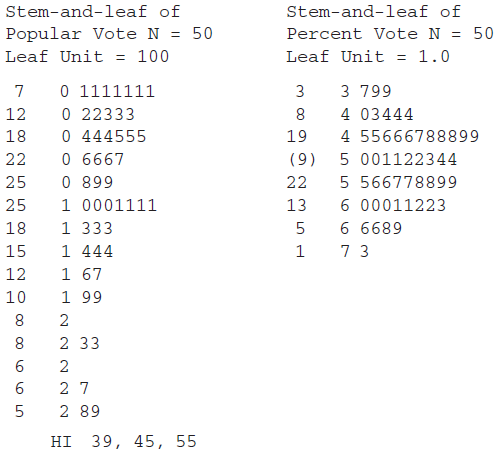
Refer to Exercise 1.51. Listed here is the percentage of the popular vote received by President Bush in each of the 50 states:8a. By just looking at the table, what shape do you think the data distribution for the percentage of the popular vote by state will have?b. Draw a relative frequency
The table that follows shows the weekend gross ticket sales for the top 20 movies during the week of August 4, 2006:9
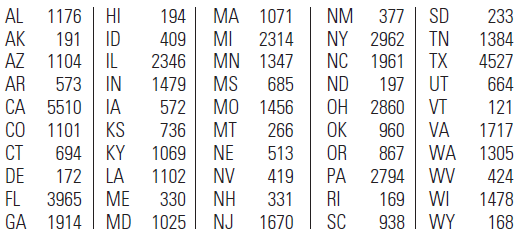
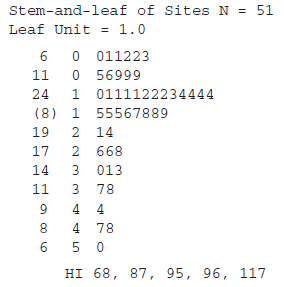
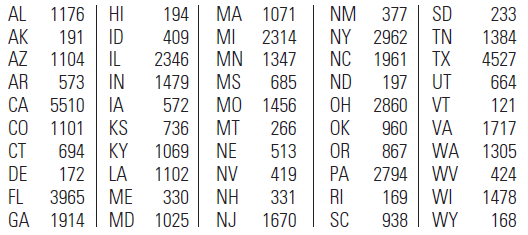
How safe is your neighborhood? Are there any hazardous waste sites nearby? The table shows the number of hazardous waste sites in each of the 50 states and the District of Columbia in the year 2006:5a. What variable is being measured? Is the variable discrete or continuous?b. A stem and leaf plot
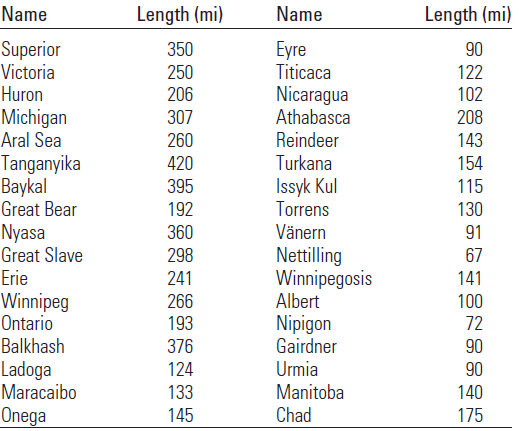
A lake is a body of water surrounded by land. Hence, some bodies of water named €œseas,€ like the Caspian Sea, are actual salt lakes. In the table that follows, the length in miles is listed for the major natural lakes of the world, excluding the Caspian Sea, which has an area
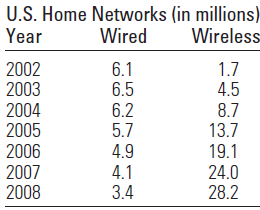
Americans become more knowledgeable about computer hardware and software, as prices drop and installation becomes easier, home networking of PCs is expected to penetrate 27 percent of U.S. households by 2008, with wireless technology leading the way.12a. What graphical methods could you use to
The 2004 election was a race in which the incumbent, George W. Bush, defeated John Kerry, Ralph Nader, and other candidates, receiving 50.7% of the popular vote. The popular vote (in thousands) for George W. Bush in each of the 50 states is listed below:8a. By just looking at the table, what shape
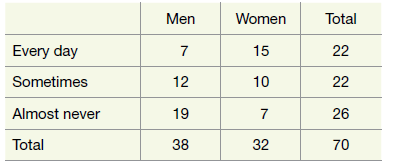
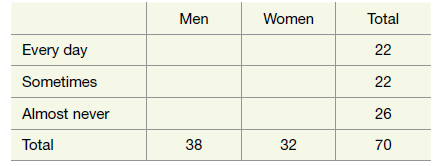
Reconsider the previous two exercises. Students at Cal Poly collected data from their classmates and produced the following two-way table of counts:a. Produce a segmented bar graph to display these data. Comment on what the graph reveals.b. Perform a simulation-based analysis using the chi-square
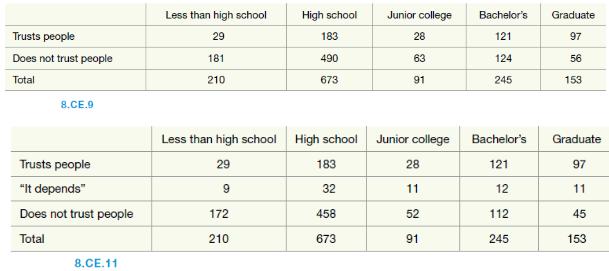
Reconsider the previous two exercises. There were actually three categories of the response variable. The response €œit depends€ had been classified as not trusting people in Exercise Table 8.CE.9 but is separated out into its own category in the 8.CE.11 table.Perform a chi-square test on
State the null and alternative hypotheses to be investigated with this study. (You may use the symbol π to represent these parameters.)
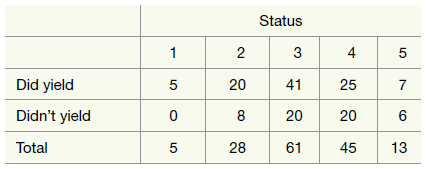
Calculate the conditional proportions of those who didn€™t yield to the pedestrian for each level of status.The following table provides descriptive statistics on the 152 drivers: Status 4 5 3 Did yield 25 20 Didn't yield 8 6 20 20 5 13 28 Total 61 45 2.
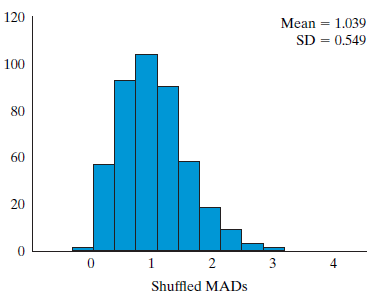
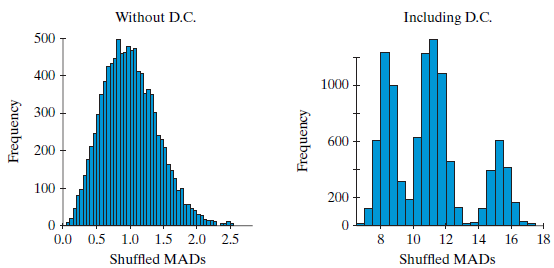
Calculate the MAD (mean absolute value of the differences) for these data.The following table provides descriptive statistics on the 152 drivers: Status 4 5 3 Did yield 25 20 Didn't yield 8 6 20 20 5 13 28 Total 61 45 2.
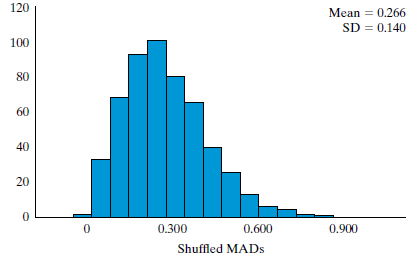
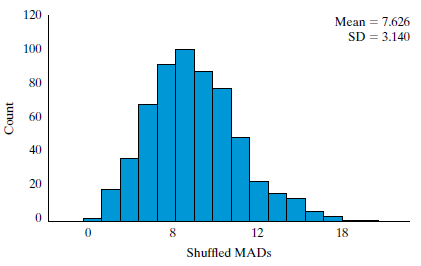
Use the appropriate applet to construct a simulated null distribution using the MAD statistic. Mark the observed MAD statistic calculated in the previous question on this graph.a. Paste a screenshot or draw your null distribution below with the observed MAD marked and the approximate p-value shaded
Are the validity conditions met to complete a theory-based chi-square test for these data? Explain. Whether the conditions are met or not, use a theory-based chi-square test to find a p-value for this test. How does this p-value compare to the p-value your found using the randomization method?The
Are the validity conditions met so we can perform follow-up analysis (pairwise comparisons) using theory-based techniques? Explain.
Regardless of your answer to #11, find confidence intervals for each pair of differences in the probabilities of not yielding. Comment on how this shows where differences can be established and where it is plausible there are no differences between probabilities.The following table provides
Are you able to conclude that the cause of any differences was due to the class status of the driver? Explain.
What generalizations are you willing to make? Explain.
Summarize the findings from the study. What worked well in this study design? What would you change? What are some follow-up research questions you would like to explore based on the findings from this study?The following table provides descriptive statistics on the 152 drivers: Status 4 5 3 Did
Suppose you were conducting a simulation with cards to compare the means of three groups of test scores. The groups consisted of samples of size 8, 10, and 12. Which of the following best describes one repetition of the simulation?A. Take 30 cards and write down each test score on a card, shuffle
When determining the p-value using the MAD statistic:A. We always count the values in the null distribution that are greater than or equal to our observed MAD statistic.B. We always count the values in the null distribution that are less than or equal to our observed MAD statistic.C. We count
When testing for an association between class level (Freshman, Sophomore, Junior, Senior) and IQ score, which of the following is NOT an appropriate way to write the alternative hypothesis?A. There is an association between class level and IQ.B. At least one of the population IQ means will be
Suppose you are comparing just two means. Among the possible statistics you could use is the difference in means, the MAD, or the max − min (the difference between the largest mean and the smallest mean).a. Will all three of these statistics always be the same? Will any pair of these statistics
Suppose there is no association between class level (Fr, So, Jr, Sr) and the amount of sleep students get per night at a certain college. What does no association imply about the mean sleep hours for each class level?
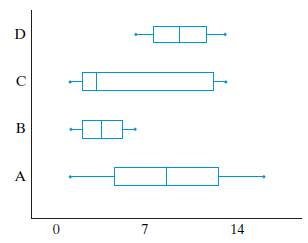
Consider the following four boxplots constructed from the four data sets A, B, C, and D.a. Which data set has the largest interquartile range? Which has the smallest?b. Which data set has the largest median? Which has the smallest?c. Which data set looks like it could be skewed? In which direction
Consider the MAD statistic. What would happen if you did not take absolute values before calculating the sum of differences between group means? Why would this not be a useful calculation without taking absolute values?
For its numerator, the MAD statistic uses the sum of absolute pairwise differences. The absolute values get rid of possible negative differences. Instead of taking absolute values, what is another way to avoid summing negative differences?
Suppose three group means are 4, 5, and 10. Compute the value of the MAD statistic.
Suppose four group means are 2, 5, 7, and 8. Compute the value of the MAD statistic.
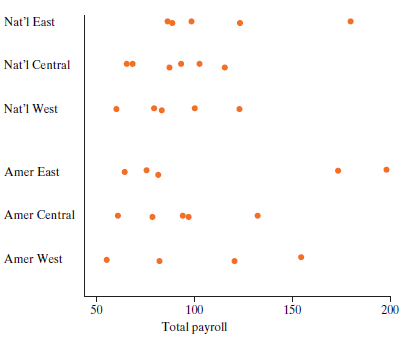
The plot shows total payroll in millions of dollars for the 30 major league teams of professional baseball sorted by league (National or American) and division (East, Central, West).a. Identify the observational units, the response, and the explanatory variable.b. For plots like the one above:i.
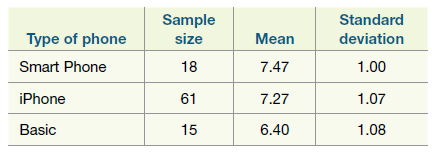
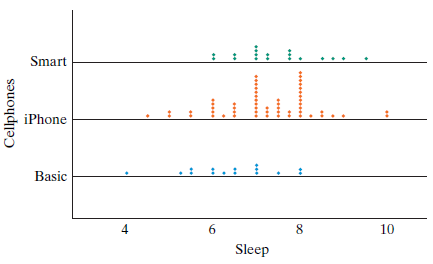
Statistics students were surveyed and two of the questions they were asked was what type of cellphone they use (Basic, iPhone, Smart Phone that is not an iPhone) and how much sleep they typically get on a school night in hours to see if there is an association between sleep and type of phone. For
Reconsider Exercises 9.1.19 on the game Halo. Besides the number of kills on each level, the students also recorded the number of deaths on each level. Use the simulation based approach to run a test for the number of deaths to determine whether at least one of the group (or level) means is
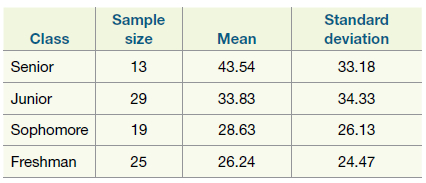
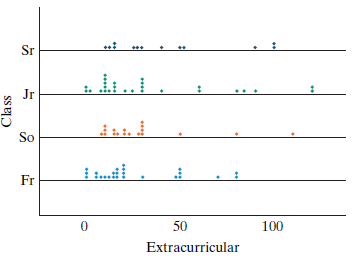
Hope College students were surveyed and were asked their class level and how many hours of extracurricular activities they participated in during the past month. For the purposes of this exercise, we will consider this sample to be representative of all students at the school. The summary
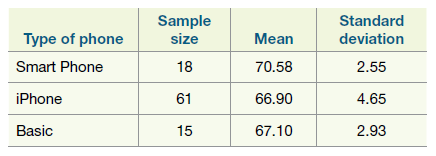
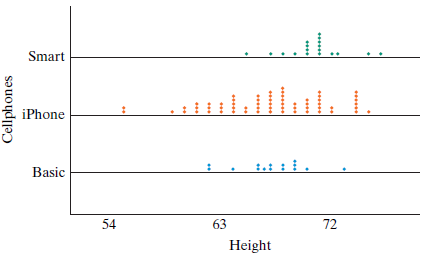
Statistics students were surveyed and two of the questions they were asked was what type of cellphone they use (Basic, iPhone®, Smart Phone that is not an iPhone) and how tall they are in inches to investigate a possible association between type of phone and student height. For the purposes of
Student researchers at Hope College studied the effects of watching certain types of videos on a person’s emotional state. The subjects were randomly shown a short happy video (babies laughing), a short sad video (abused dogs in a shelter), or no video. Aft er this, the subjects were given an
Reconsider Exercise 9.1.15 on video type and emotion. Besides assessing their subjects’ emotional state after watching the videos, they also assessed their mood. The results can be found in the data set VideoMood with the higher the mood score, the better the subject’s mood.a. Identify the
Reconsider Exercise 9.1.15 on video type and emotion. Besides assessing their subjects’ emotional state after watching the videos, they also assessed their stress. The results can be found in the data set VideoStress with the higher the stress score, the lower the stress level, so high numbers
Which diet is best? A fairly recent article in the Journal of the American Medical Association (Dansinger, Griffith, Gleason, et al., 2005) reported on a randomized, comparative experiment in which 160 subjects were randomly assigned to one of four popular diet plans: Atkins, Ornish, Weight
Halo is a popular science fiction video game. It can be played on different levels. Statistics students at Hope College wanted to determine whether or not the level on which the game was played affects how well a person plays. Data were collected from 90 different games of Halo, 30 from each of the
Reconsider Exercises 9.1.19 on the game Halo. Besides the number of kills on each level, the students also recorded the number of assists on each level. Use the simulation based approach to run a test for the number of assists to determine whether at least one of the group (or level) means is diff
Reconsider Exercises 9.1.19 on the game Halo. Besides the number of kills on each level, the students also recorded the number of medals on each level. Use the simulation based approach to run a test for the number of medals to determine whether at least one of the group (or level) means is
A group of Hope College statistics students wanted to see if there was an association between students’ major and the time (in seconds) it takes them to complete a small Sudoku-like puzzle. They grouped majors into four categories: applied science (as), natural science (ns), social science (ss),
Reconsider Exercise 9.1.23 on major and time needed to complete a puzzle. There was one outlier in the applied science group. The researchers reported that this subject kept getting distracted while completing the puzzle. Suppose the first step in computing the MAD statistic was to find the
Reconsider Exercise 9.1.23 on major and time needed to complete a puzzle. Th ere was one outlier in the applied science group. The researchers reported that this subject kept getting distracted while completing the puzzle. Put the data MajorPuzzle into the Multiple Means applet and run a
Suppose two studies are to compare three means. The results are found in the data sets Study1 and Study2.a. Copy and paste the data from Study 1 into the Multiple Means applet and report the three means, the three standard deviations, and the MAD statistic.b. Do at least 1,000 shuffles to find a
Is this a randomized experiment or an observational study? Explain how you know.
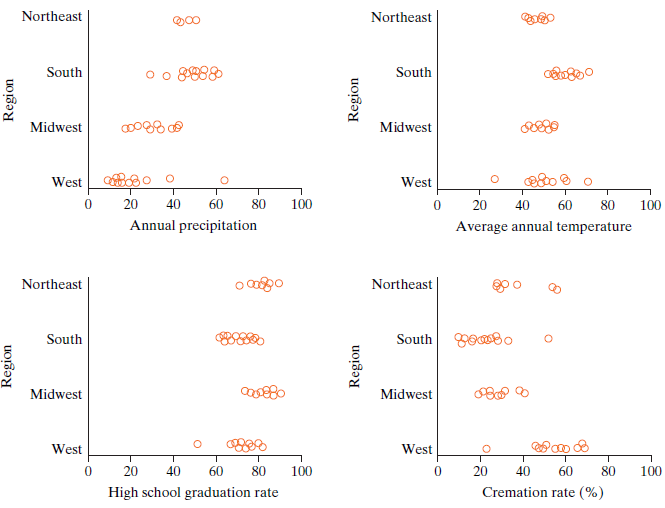
The observational unit and explanatory variable are the same as in Exercise 9.CE.17. Th e dotplots for Exercise 9.CE.19 are for a third set of response variables: precipitation (a state€™s annual average), temperature (again, a state€™s annual average), a state€™s high
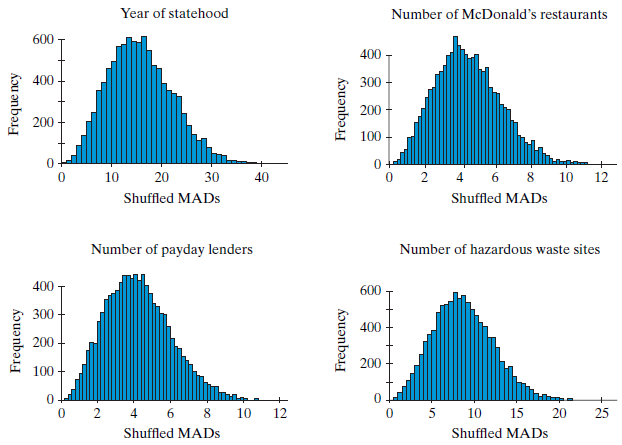
The observational unit and explanatory variable are the same as in Exercise 9.CE.17. Consider another four response variables: Year that a state joined the union, number of McDonald€™s restaurants in the state, number of payday lenders in the state, and number of hazardous waste sites in
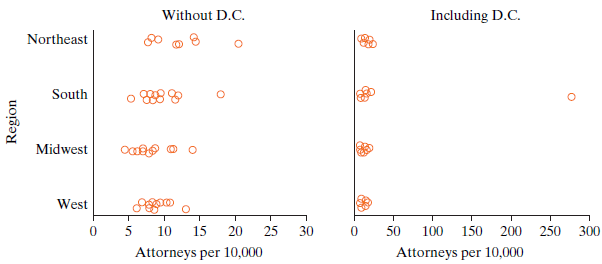
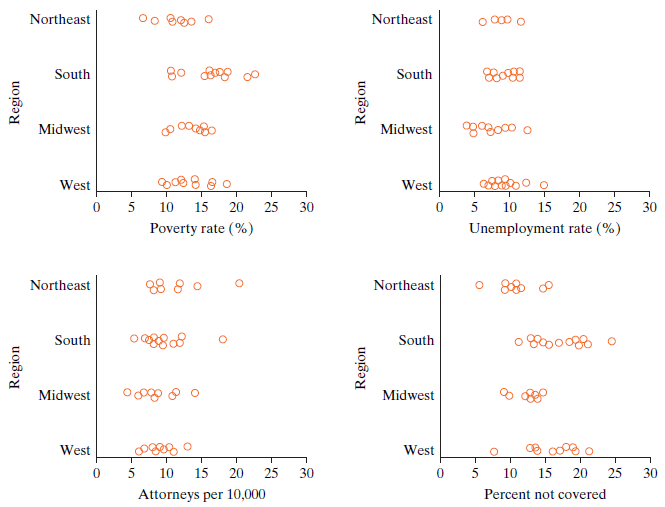
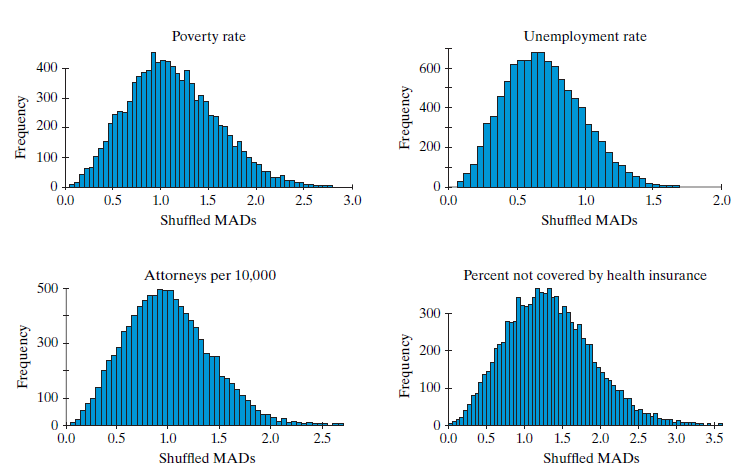
The U.S. Census Bureau classifies the 50 U.S. states into four regions:Northeast (9 states, New England and Middle Atlantic):CT, ME, MA, NH, NJ, NY, PA, RI, VTSouth (16 states, South Atlantic, East South Central, and West South Central):AL, AR, DE, FL, GA, KY, LA, MD, MS, NC, OK, SC, TN, TX, VA,
A British study (North, Shilcock, and Hargreaves, 2003) examined whether the type of background music playing in a restaurant affected the amount of money that diners spent on their meals. The researchers asked a restaurant to alternate silence, popular music, and classical music on successive
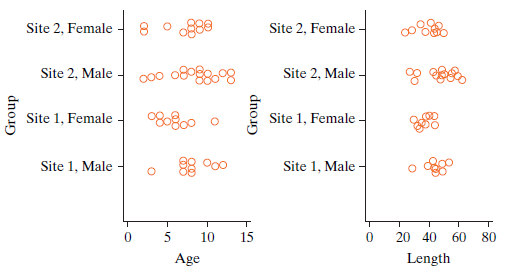
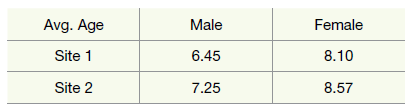
The two plots below show distributions of age (left panel) and length (right panel) for male and female rattlesnakes caught at two different sites. Here are the four groups:a. Classify each of the following statements as True or False:A. The observational unit is the same for both plots.B. The
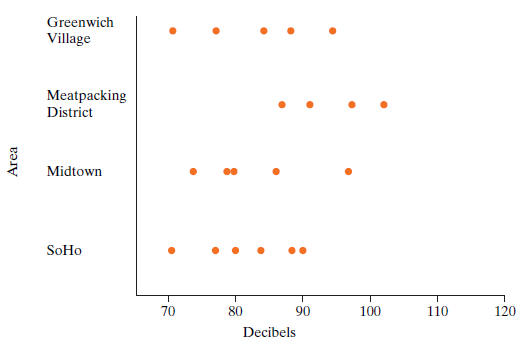
Recorded noise levels in decibels for a sample of locations in four different parts of New York City are shown in the 9.CE.14 dotplots.a. What is the observational unit? What is the response variable? What is the explanatory variable?b. Which of the following best describes the pattern in the plot?
A study was conducted to investigate whether how well you know a person is associated with your ability to detect a lie told by that person. Ten statements were devised about the researcher (e.g., “My toothbrush is blue.”)—five of which were true and five of which were false—but for which
Reconsider the previous exercise.a. Th e data file CarCrashDummiesLog contains the same data but with the response variable being the logarithm (base 10) of the original head injury measurements. Reexamine the distributions of these (transformed) measurements by the number of doors. Do the validity
The data file CarCrashDummies contains data on automobile crash test results. The explanatory variable is the number of doors on the vehicle, and the response variable is a measurement of the extent of injury on the dummy’s head.a. Produce graphical displays of the head injury measurements by the
Each singer in the New York Choral Society in 1979 self-reported his or her height to the nearest inch. Their voice parts in order from highest pitch to lowest pitch are Soprano, Alto, Tenor, and Bass. The first two are typically sung by female voices and the last two by male voices. The data can
The file EarningsByDegree contains data from random samples of 50 American adults taken in the year 2000 in each of five categories of higher educational achievement:• Some higher education• Associate degree• Bachelor’s degree• Master’s degree• DoctorateThe response variable is the
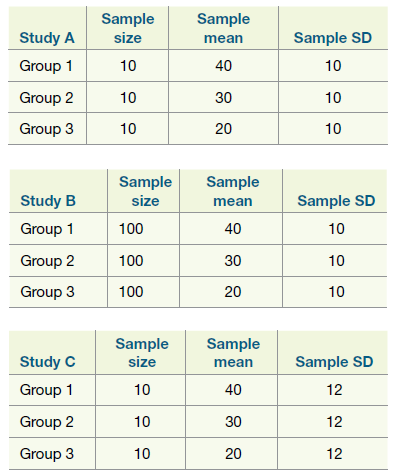
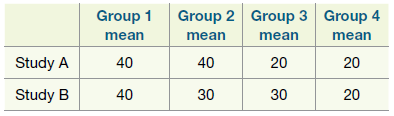
Consider summary statistics from three different studies (A, B, C) presented below:a. Which study provides the least evidence of a significant difference among the group means? Explain your thinking, without performing any calculations or simulations.b. Which study provides the strongest evidence
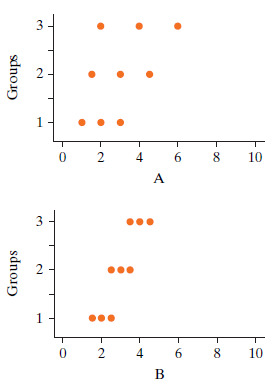
Suppose that two different studies (A and B) have the same sample sizes in each of four groups, with similar standard deviations in the four groups. Furthermore, those sample sizes and sample SDs are also the same, or very similar, in Study A and Study B. Consider the following group means:a.
Give your own example of a research question that you could use methods of this chapter to investigate. Include the following components:a. The research question itselfb. The observational unitsc. The explanatory variabled. The number of categories/groups of the explanatory variablee. The response
Is the average of group averages always equal to the overall average? Let’s make this question more precise: Suppose that an instructor teaches four sections of a course, and the average scores on an exam for the four sections are 77, 80, 83, and 84. Is it necessarily true that the average exam
Why do the μ and x̅ symbols in this chapter have subscripts? What do the subscripts represent?
The symbols μ and x̅ both stand for means or averages but represent different quantities. What’s the difference between μ and x̅?
Suppose that you collect data on heights of singers in order to investigate whether the four different singing parts in a chorus tend to have different heights, on average. Your friend Josephine says that there are four explanatory variables in this study (soprano, alto, tenor, bass), and your
a. If all other things remain the same, then larger differences between group means have what effect on the p-value (smaller, larger, or no effect)?b. If all other things remain the same, then larger variation within groups has what effect on the p-value (smaller, larger, or no effect)?c. If all
Reconsider the previous exercise of the study of the Hatha yoga, walking exercise, and wait-list control. The researchers were also interested in change in subjects’ perception of their own health. An outcome of interest was change in perception of one’s vitality. The researchers reported the
Reconsider the previous exercise of the study of the Hatha yoga, walking exercise, and wait-list control. Another outcome of interest was change in number of words correctly recalled from a list aft er a time delay. The researchers reported the corresponding p-value to be 0.38. We have presented a
Reconsider the previous exercise of the study of the Hatha yoga, walking exercise, and wait-list control. Another outcome of interest was change in simple reaction time (msec). Th e researchers reported the corresponding p-value to be 0.760. (Note: We have presented a simplified version of the
Researchers Oken et al. (Alternative Therapy Health Medicine, 2006) conducted a study where 135 generally healthy men and women aged 65–85 years were randomly assigned to either 6 months of Hatha yoga class (44 people), walking exercise (47 people), or wait-list control (44 people). One of the
Reconsider the previous exercise about the study of the effect of wing length on the flight time of paper helicopters. Recall that there were two wing lengths of interest: 2 cm and 3 cm, and that flight time was measured in seconds taken for a paper helicopter to hit the ground after being dropped
In a study of the effect of wing length on the flight time of paper helicopters, two wing lengths were of interest: 2 cm and 3 cm. Two paper helicopters were made, one with a wing length of 2 cm and the other with 3 cm. All other aspects of the helicopters were made to be as identical as possible.
Reconsider the previous exercise. In the actual study conducted on the statistics students in California, participants were asked for an amount that they would be willing to donate. Suppose that instead the participants were asked whether or not they would be willing to make a donation, and their
Reconsider the previous exercise about the effect of distance on size of donation. In the study conducted on the statistics students in California, there were 14 people assigned to “California,” 14 to “Kansas,” and 16 to “Maine” for a total of 44 subjects. Suppose that instead each
Students in a statistics class in a four-year university in California were randomly assigned to be asked one of the following three questions:• Suppose that a part of the state of California was affected by a devastating earthquake, and you were contacted via e-mail by the American Red Cross,
Reconsider the previous exercise about the effect of social media on a person’s self-esteem. In the actual study conducted by the statistics students, participants were given a score that measured their self-esteem.Suppose that instead of recording a numeric score, participants were categorized
Reconsider the previous exercise about the effect of social media on a person’s self-esteem. In the actual study conducted by the statistics students, there were 27 people assigned to each of the three groups, for a total of 81 subjects. Suppose that instead of 27, each group had 30 people and
A group of statistics students wanted to investigate the effect of social media on a person’s self-esteem. For this purpose, they conducted a study where participants were randomly assigned to one of three groups: browsing ENews for 2 minutes and then taking a survey, browsing Facebook for 2
Refer to the previous three exercises.Perform an appropriate test of significance to determine whether there is a relationship between the level the game is played and if a player wins (1) or loses (0). The data file is HaloWins.
Refer to the previous two exercises.a. Use a theory-based approach to run an ANOVA test to investigate whether the average number of medals (data file HaloMedals) is different for at least one of the groups (or levels). Report the value of the F-statistic and the corresponding p-value. (Note: As
Refer to the previous exercise about the popular science fiction video game Halo.a. Use a theory-based approach to run an ANOVA test to investigate whether the average number of assists (data file HaloAssists) is different for at least one of the groups (or levels). Report the value of the
Reconsider Exercises 9.1.19–9.1.22 as well as the previous exercise about the popular science fiction video game Halo. Statistics students at Hope College, Holland, Michigan, wanted to determine whether players at different levels of the game diff er in how well they do. Each of three players,
Recall Exercises 9.1.19–9.1.22 about the popular science fiction video game Halo. Statistics students at Hope College, Holland, MI, wanted to determine whether or not the level on which the game was played affects how well a person plays, and so data were collected from 90 different games of
Alarming levels of mercury are starting to creep into our food chain: Our fi sh are showing up with levels of mercury in them that used to be absent. Are the mercury levels the same in all fish? The data set Mercury gives mercury levels in parts per million for four types of fish.a. What is the
This question explores a data set considered in Chapter 6 using an independent-samples t-test to make your conclusion. (We will compare those results with the results using ANOVA.) Do heart rates of men and women diff er? To answer this question, we will look at a data set in an article by Allen L.
Recall Exercise 9.1.18 about the article in the Journal of the American Medical Association (Dansinger, Griffith, Gleason, et al., 2005) that reported on a randomized, comparative experiment in which 160 subjects were randomly assigned to one of four popular diet plans: Atkins, Ornish, Weight
The pair of plots below shows two artificial data sets, A and B.a. Which data set will have the larger mean absolute pairwise difference?A. Larger for A than for BB. Larger for B than for AC. Same size for bothD. Can€™t tellb. Suppose your null hypothesis is that there is no association
Suppose you are conducting an ANOVA test with four groups and each group has a sample size of 20.a. Suppose the variability between groups increases. Does the F-statistic increase or decrease? Does the p-value increase or decrease?b. Suppose the variability within groups increases. Does the
Suppose you are conducting an ANOVA test in a situation where the alternative hypothesis is true. Are you more likely or less likely to be able to conclude the alternative hypothesis if:a. The differences in the population means increase?b. The population standard deviations increase?c. Your
If we are comparing means from three different groups, why would we use ANOVA rather than doing three independent-samples t-tests?
What is an ANOVA test used for?
Refer to the previous exercise about the association between a person’s height and their biological father’s height. Recall that the data file DadandChildHeights contains data for students in a statistics class on the following two variables: student’s height (inches) and biological
Refer back to Exercise 10.1.17, which explores the association between children’s heights and (biological) fathers’ heights. The data file DadandChildHeights contains data for students in a statistics class on the following two variables: student’s height (inches) and biological father’s
Refer to the previous exercise about the association between a person’s height and their biological mother’s height. Recall that the data fi le MomandChildHeights contains data for students in a statistics class on the following two variables: student’s height (inches) and biological
Recall from Exercise 10.1.16 that the data file MomandChildHeights contains data for students in a statistics class on the following two variables: student’s height (inches) and biological mother’s height (inches).a. State in words the appropriate null and alternative hypotheses to test whether
Refer to the previous exercise about the association between maximum speed and maximum height of roller coasters. Recall that the data file Rollercoasters contains data on the maximum speed (miles per hour) and the maximum height (feet) for each of a sample of roller coasters in the U.S.a. Enter
Showing 300 - 400
of 2042
1
2
3
4
5
6
7
8
9
10
11
12
13
14
15
Last
Step by Step Answers