New Semester
Started
Get
50% OFF
Study Help!
--h --m --s
Claim Now
Question Answers
Textbooks
Find textbooks, questions and answers
Oops, something went wrong!
Change your search query and then try again
S
Books
FREE
Study Help
Expert Questions
Accounting
General Management
Mathematics
Finance
Organizational Behaviour
Law
Physics
Operating System
Management Leadership
Sociology
Programming
Marketing
Database
Computer Network
Economics
Textbooks Solutions
Accounting
Managerial Accounting
Management Leadership
Cost Accounting
Statistics
Business Law
Corporate Finance
Finance
Economics
Auditing
Tutors
Online Tutors
Find a Tutor
Hire a Tutor
Become a Tutor
AI Tutor
AI Study Planner
NEW
Sell Books
Search
Search
Sign In
Register
study help
statistics
elementary statistics in social research
Elementary Statistics Picturing The World 8th Edition Ron Larson - Solutions
In a survey of 1790 U.S. adults in a recent year, 1325 say they have a New Year’s resolution.
In a survey of 1790 U.S. adults in a recent year, 816 have a New Year’s resolution related to their health.
In a survey of 1010 U.S. adults, 364 said that they worry a great deal about the possibility of a future terrorist attack.
In a survey of 1010 U.S. adults, 556 said that they worry a great deal about hunger and homelessness.
In a survey of 15,349 U.S. adults, 860 identify as lesbian, gay, bisexual, or transgender. Construct a 95% confidence interval for the population proportion of U.S. adults who identify as lesbian, gay, bisexual, or transgender.
In a survey of 692 lesbian, gay, bisexual, or transgender U.S adults, 378 said that they consider themselves bisexual.Construct a 90% confidence interval for the population proportion of lesbian, gay, bisexual, or transgender U.S. adults who consider themselves bisexual.
You wish to estimate, with 95% confidence, the population proportion of likely U.S. voters who think Congress is doing a good or excellent job. Your estimate must be accurate within 4% of the population proportion.(a) No preliminary estimate is available. Find the minimum sample size needed.(b)
In Exercise 11, would it be unusual for the population proportion to be 72.5%? Explain.Exercise 11In a survey of 1790 U.S. adults in a recent year, 1325 say they have a New Year’s resolution.
In Exercise 12, would it be unusual for the population proportion to be 48%?Explain.Exercise 12In a survey of 1790 U.S. adults in a recent year, 816 have a New Year’s resolution related to their health.
In Exercise 17(b), would a sample size of 400 be acceptable? Explain.Exercise 17(b)You wish to estimate, with 95% confidence, the population proportion of likely U.S. voters who think Congress is doing a good or excellent job. Your estimate must be accurate within 4% of the population
In Exercise 18(b), would a sample size of 5000 be acceptable? Explain.Exercise 18(b) You wish to estimate, with 99% confidence, the population proportion of U.S. adults who disapprove of the U.S Senate’s use of the filibuster. Your estimate must be accurate within 2% of the population
Construct a 99% confidence interval for the population proportion of adults who say national identity is strongly tied to birthplace for each country listed.
In Exercise 25, which two countries are the least likely to have equal population proportions? Explain.Exercise 25Construct a 99% confidence interval for the population proportion of adults who say national identity is strongly tied to birthplace for each country listed.
Construct a 95% confidence interval for the population proportion of U.S. adults who gave each response.use the figure, which shows the results of a survey in which 1021 U.S. adults were asked whether they see each of the possible threats to the vital interests of the United States as a critical
In a survey of 1502 U.S. adults, 31% said that they use Pinterest. The survey’s margin of error is ±2.9%.
In a survey of 220 U.S. adults ages 18 – 29, 65% said that they use Snapchat.The survey’s margin of error is ±7.9%.
In a survey of 880 unmarried U.S. adults who are living with a partner, 73%say love was a major reason why they decided to move in together. The survey’s margin of error is ±4.8%.
In a survey of 2094 U.S. adults who have used an online dating app, 57%said their personal experience with online dating was positive. The survey’s margin of error is ±3.6%.
From a random sample of 35 months from January 2006 through December 2020, the mean number of tornadoes per month in the United States was about 100.Assume the population standard deviation is 111.you are given the sample mean and the population standard deviation. Use this information to construct
In Exercise 35, would it be unusual for the population mean to be over $1500? Explain.Exercise 35From a random sample of 48 business days from May 9, 2016, through May 7, 2021, U.S. gold prices had a mean of \($1404.09\). Assume the population standard deviation is $232.09.you are given the sample
In Exercise 38, does it seem likely that the population mean could be less than 100? Explain.Exercise 38From a random sample of 35 months from January 2006 through December 2020, the mean number of tornadoes per month in the United States was about 100.Assume the population standard deviation is
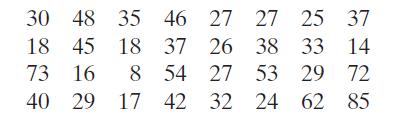
Researchers surveyed a random sample of 32 U.S. workers ages 16 years and over who did not work from home and asked how long (in minutes) it takes them to get from home to work. The responses are listed.From past studies, the researchers assume that σ is 14.9 minutes. 30 48 35 46 27 27 25 37 18 45
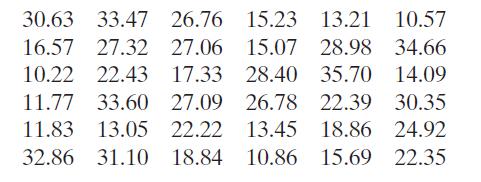
The sodium chloride concentrations (in grams per liter) for 36 randomly selected seawater samples are listed. Assume that σ is 7.61 grams per liter. 30.63 33.47 26.76 15.23 13.21 10.57 34.66 14.09 16.57 27.32 27.06 15.07 28.98 10.22 22.43 17.33 28.40 35.70 11.77 33.60 27.09 26.78 22.39 11.83 13.05
List six features that are common to both the standard normal curve and the t-distribution curve.
Describe how the t@distribution curve changes as the sample size increases.
x̄ = 70.3, μ = 64.8, s = 7.1, n = 16 find the t-value for the given values of x̄, μ, s, and n.
x̄ = 22.9, μ = 24.5, s = 4.3, n = 40 find the t-value for the given values of x̄, μ, s, and n.
The grade point averages of 14 randomly selected college students 2.3 3.3 2.6 1.8 3.1 4.0 0.7 2.3 2.0 3.1 3.4 2.3 1.3 2.6 2.6
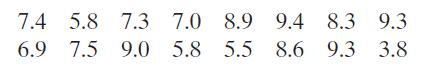
The weekly time (in hours) spent weight lifting for 16 randomly selected college football players 7.4 5.8 7.3 7.0 8.9 9.4 8.3 9.3 6.9 7.5 9.0 5.8 5.5 8.6 9.3 3.8
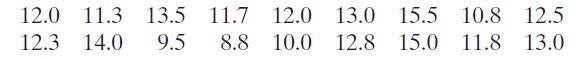
The weekly time spent (in hours) on homework for 18 randomly selected high school students 12.0 11.3 13.5 13.5 11.7 12.3 14.0 9.5 8.8 12.0 13.0 12.0 13.0 15.5 10.8 12.5 10.0 12.8 15.0 12.8 15.0 11.8 13.0
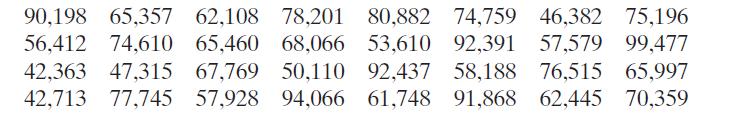
The annual earnings (in dollars) of 32 randomly selected intermediate level life insurance underwritersuse the data set to (a) find the sample mean, (b) find the sample standard deviation, and (c) construct a 98% confidence interval for the population mean. 90,198 65,357 62,108 78,201 80,882 74,759
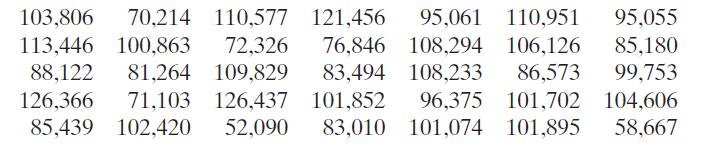
The annual earnings (in dollars) of 35 randomly selected senior magnetic resonance imaging (MRI) technologistsuse the data set to (a) find the sample mean, (b) find the sample standard deviation, and (c) construct a 98% confidence interval for the population mean. 121,456 121,456 95,061 110,951
In Exercise 31, the population mean salary is $67,319. Does the t-value fall between -t0.98 and t0.98?Exercise 31The annual earnings (in dollars) of 32 randomly selected intermediate level life insurance underwriters 90,198 65,357 62,108 78,201 80,882 74,759 46,382 75,196 56,412 74,610 65,460
In Exercise 32, the population mean salary is $93,867. Does the t-value fall between -t0.98 and t0.98? Exercise 32The annual earnings (in dollars) of 35 randomly selected senior magnetic resonance imaging (MRI) technologists 121,456 121,456 95,061 110,951 76,846 108,294 106,126 95,055 103,806
In a random sample of 50 people, the mean body mass index (BMI) was 27.7 and the standard deviation was 6.12.
In a random sample of 18 months from January 2011 through December 2020, the mean interest rate for 30-year fixed rate home mortgages was 3.95% and the standard deviation was 0.49%. Assume the interest rates are normally distributed.
The population standard deviation of the weights of the two‑year‑old males on a pediatrician’s patient list is 2.49 pounds. The mean weight of a sample of 10 of the two‑year‑old males is 13.68 pounds. Weights are known to be normally distributed.
The mean number of gigabytes (GB) of data used in the past month by a sample of 18 college students is 7.9 GB with a standard deviation of 1.7 GB. The distribution is not symmetric due to the various limits on data plans.
The gas mileages (in miles per gallon) of 28 randomly selected sports cars are listed. The mileages are not normally distributed. 21 30 19 20 21 21 24 18 24 27 20 22 30 25 25 26 22 17 21 21 24 24 22 20 24 21 20 18 20 21 21 20 20 27
In the 2020 – 2021 NFL season, the population standard deviation of the yards per carry for all running backs was 1.76. The yards per carry of 13 randomly selected running backs are listed below. Assume the yards per carry are normally distributed. 3.3 5.6 5.3 5.1 3.3 5.0 3.9 4.6 4.3 5.3 3.1 4.7
Find the z-score that corresponds to each value.The scores for the reading portion of the ACT test are normally distributed. In a recent year, the mean test score was 21.2 and the standard deviation was 6.9.The test scores of four students selected at random are 17, 29, 8, and 23.Use this
Determine whether any of the values are unusual.The scores for the reading portion of the ACT test are normally distributed. In a recent year, the mean test score was 21.2 and the standard deviation was 6.9.The test scores of four students selected at random are 17, 29, 8, and 23.Use this
\(P(z
\(P(z>-0.74)\).In Exercises 21–26, find the indicated probability using the standard normal distribution. If convenient, use technology to find the probability.
\(P(-2.15
\(P(x
\(P(x
\(P(60
\(P(72
Yearly amounts of greenhouse gases from U.S. energy sources since 1990 are normally distributed, with a mean of 5774 million metric tons carbon dioxide equivalent (MMT \(\mathrm{CO}_{2}\) eq.) and a standard deviation of 333 MMT \(\mathrm{CO}_{2}\) eq. Find the probability that the amount of
The daily surface concentration of carbonyl sulfide on the Indian Ocean is normally distributed, with a mean of 9.1 picomoles per liter and a standard deviation of 3.5 picomoles per liter. Find the probability that on a randomly selected day, the surface concentration of carbonyl sulfide on the
0.4721 In Exercises 37-42, use the Standard Normal Table or technology to find the \(z\)-score that corresponds to the cumulative area or percentile.
\(P_{46}\)In Exercises 37-42, use the Standard Normal Table or technology to find the \(z\)-score that corresponds to the cumulative area or percentile.
The population densities in people per square mile in the 50 U.S. states have a mean of 199.6 and a standard deviation of 265.4. Random samples of size 35 are drawn from this population, and the mean of each sample is determined.Find the mean and standard deviation of the indicated sampling
The test scores for the Law School Admission Test (LSAT) in a recent year are normally distributed, with a mean of 151.88 and a standard deviation of 9.95. Random samples of size 40 are drawn from this population, and the mean of each sample is determined.Find the mean and standard deviation of the
The mean ACT composite score in a recent year is 20.7. A random sample of \(36 \mathrm{ACT}\) composite scores is selected. What is the probability that the mean score for the sample is (a) less than 22, (b) greater than 23 , and (c) between 20 and 21.5? Assume \(\sigma=5.9\).
The mean annual salary for Level 1 actuaries in the United States is about \(\$ 72,000\). A random sample of 45 Level 1 actuaries is selected. What is the probability that the mean annual salary of the sample is (a) less than \(\$ 75,000\) and (b) more than \(\$ 68,000\) ? Assume \(\sigma=\$
The mean annual salary for physical therapists in the United States is about \(\$ 87,000\). A random sample of 50 physical therapists is selected. What is the probability that the mean annual salary of the sample is (a) less than \(\$ 84,000\) and (b) more than \(\$ 85,000\) ? Assume \(\sigma=\$
A survey of U.S. adults ages 33 to 40 earning more than $150,000 per year found that 94% are content with how their lives have turned out so far. You randomly select 20 U.S. adults ages 33 to 40 earning more than $150,000 and ask if they are content with their lives so far.A binomial experiment is
A survey of U.S. adults found that 69% have a favorable view of farming and agriculture. You randomly select 45 U.S. adults and ask whether they have a favorable view of farming and agriculture.A binomial experiment is given. Determine whether you can use a normal distribution to approximate the
\(P(x
\(P(54
A survey of U.S. adults found that 72% used a mobile device to manage their bank account at least once in the previous month. You randomly select 70 U.S. adults and ask whether they used a mobile device to manage their bank account at least once in the previous month. Find the probability that the
Thirty-four percent of U.S. college graduates work in jobs that do not require a college degree. You randomly select 20 U.S. college graduates.Find the probability that the number working in a job that does not require a college degree is (a) exactly 7, (b) at most 6, and (c) between 5 and 10,
Find the probability that the number who feel they have little or no control over data collected about them by companies is (a) at most 200, (b) less than 210 , and (c) exactly 202 . Identify any unusual events. Explain.
\(\mu=150, \sigma=25, n=49\)In Exercises 1-4, a population has a mean \(\mu\) and a standard deviation \(\sigma\). Find the mean and standard deviation of the sampling distribution of sample means with sample size \(n\).
\(\mu=45, \sigma=15, n=100\)In Exercises 1-4, a population has a mean \(\mu\) and a standard deviation \(\sigma\). Find the mean and standard deviation of the sampling distribution of sample means with sample size \(n\).
\(\mu=790, \sigma=48, n=250\)In Exercises 1-4, a population has a mean \(\mu\) and a standard deviation \(\sigma\). Find the mean and standard deviation of the sampling distribution of sample means with sample size \(n\).
\(\mu=1275, \sigma=6, n=1000\)In Exercises 1-4, a population has a mean \(\mu\) and a standard deviation \(\sigma\). Find the mean and standard deviation of the sampling distribution of sample means with sample size \(n\).
For a random sample of \(n=45\), find the probability of a sample mean being greater than 551 when \(\mu=550\) and \(\sigma=3.7\).The population mean and standard deviation are given. Find the indicated probability and determine whether the given sample mean would be considered unusual.
During a recent period of two years, the day-ahead prices for renewable energy in Germany (in euros per mega-watt hour)have a mean of 31.58 and a standard deviation of 12.293. Random samples of size 75 are drawn from this population, and the mean of each sample is determined.
The zloty is the official currency of Poland. During a recent period of two years, the day-ahead prices for renewable energy in Poland (in zlotys per mega-watt hour) have a mean of 158.51 and a standard deviation of 33.424. Random samples of size 100 are drawn from this population, and the mean of
In a recent study involving 54 women, the mean body temperature of the women was found to be 97.2°F, with a standard deviation of 0.83. Random samples of size 36 are drawn from this population, and the mean of each sample is determined.
In a recent study involving 42 men, the mean body temperature of the men was found to be 96.8°F, with a standard deviation of 0.61. Random samples of size 30 are drawn from this population, and the mean of each sample is determined.
The annual salaries for entry-level marketing analysts are normally distributed, with a mean of about $54,000 and a standard deviation of about$11,000. Random samples of 34 are drawn from this population, and the mean of each sample is determined.
The annual salaries for web software development managers are normally distributed, with a mean of about \($136,000\) and a standard deviation of about \($11,500\). Random samples of 40 are drawn from this population, and the mean of each sample is determined.
The scores on the SAT French Subject Test for the 2018 –2020 graduating classes are normally distributed, with a mean of 603 and a standard deviation of 111.Random samples of size 16 are drawn from this population, and the mean of each sample is determined.
The scores on the SAT Italian Subject Test for the 2018 –2020 graduating classes are normally distributed, with a mean of 628 and a standard deviation of 110.Random samples of size 25 are drawn from this population, and the mean of each sample is determined.
From 1975 through 2020, the mean annual gain of the Dow Jones Industrial Average was 652.A random sample of 32 years is selected from this population. What is the probability that the mean gain for the sample was between 400 and 700? Assume \(\sigma=1540\).
From 1921 through 2020, the mean return of the Standard \& Poor's 500 was \(12.59 \%\). A random sample of 38 years is selected from this population. What is the probability that the mean return for the sample was between \(10.0 \%\) and \(11.0 \%\) ? Assume \(\sigma=19.58 \%\).
The mean percent of asthma prevalence of the 50 U.S. states is \(9.51 \%\). A random sample of 30 states is selected. What is the probability that the mean percent of asthma prevalence for the sample is greater than \(10 \%\) ? Assume \(\sigma=1.17 \%\).
A fertility rate is the number of births per 1000 women aged 15-44. The mean fertility rate of the 50 U.S. states for a recent year was 59.0 with a standard deviation of 5.47. A random sample of 40 states is selected. What is the probability that the mean fertility rate for the sample for the
Assume that the asthma prevalences in Exercise 31 are normally distributed. Are you more likely to randomly select a state with asthma prevalence less than \(10 \%\) or to randomly select a sample of 10 states in which the mean of the state asthma prevalences is less than \(10 \%\) ? Explain.
A machine is set to fill paint cans with a mean of 128 ounces and a standard deviation of 0.2 ounce. A random sample of 40 cans has a mean of 127.9 ounces. The machine needs to be reset when the mean of a random sample is unusual. Does the machine need to be reset? Explain.
The weights of ice cream cartons are normally distributed with a mean weight of 10 ounces and a standard deviation of 0.5 ounce.(a) What is the probability that a randomly selected carton has a weight greater than 10.21 ounces?(b) You randomly select 25 cartons. What is the probability that their
In a sample of 1000 fines issued by the City of Toronto for parking infractions in September of 2020, the mean fine was \(\$ 49.83\) and the standard deviation was \(\$ 52.15\). A random sample of size 60 is selected from this population. What is the probability that the mean fine is less than \(\$
In a sample of 100 eruptions of the Old Faithful geyser at Yellowstone National Park, the mean interval between eruptions was 129.58 minutes and the standard deviation was 108.54 minutes. A random sample of size 30 is selected from this population. What is the probability that the mean interval
Twenty-two percent of adults over 18 years of age have a bachelor’s degree. You randomly select 20 adults over 18 years of age and ask whether they have a bachelor’s degree.In Exercises 17 and 18, a binomial experiment is given. Determine whether you can use a normal distribution to approximate
In a survey of U.S. college students, 74% believed that colleges do not have the right to restrict the expression of political views on campus. You randomly select 20 college students and ask them if they believe colleges have the right to restrict the expression of political views on campus.In
In a survey of U.S. college students, 62% said that if their college offers new programs tailored to the new economy, it will make them more likely to re-enroll. You randomly select 40 college students.Find the probability that the number who are more likely to enroll if their college offers new
A survey of Americans found that 55% would be disappointed if Facebook disappeared. You randomly select 500 Americans and ask them whether they would be disappointed if Facebook disappeared. Find the probability that the number who say yes is (a) less than 250, (b) at least 300, and (c) between 240
In a survey of U.S. adults, 43% said they would favor allowing people to carry guns in more places. You randomly select 100 U.S.adults. Find the probability that the number who favor allowing people to carry guns in more places is (a) more than 50, (b) at most 50, and (c) between 40 and 45,
A survey of U.S. registered voters found that 71%have a favorable opinion of police. You randomly select 150 U.S. registered voters. Find the probability that the number who have a favorable opinion of police is (a) at most 100, (b) more than 120, and (c) between 90 and 110, inclusive.In Exercises
In a survey of college athletes, 84% said they are willing to speak up and be more active in social issues. You randomly select 25 college athletes. Find the probability that the number who are willing to speak up and be more active in social issues is (a) at least 24, (b) less than 23, and (c)
In a survey of U.S. registered voters, 36% said that someone in their household owns a gun. You randomly select 20 U.S.registered voters. Find the probability that the number who live with someone who owns a gun is (a) no more than 8, (b) exactly 7, and (c) between 6 and 9 inclusive.In Exercises
In a survey of U.S. adults, 19% said that they have participated in a clinical trial. You randomly select 200 U.S. adults. Find the probability that the number who have participated in a clinical trial is (a) no fewer than 30, (b) more than 40, and (c) between 35 and 45 inclusive.In Exercises
In a survey of U.S. adults, 77% said are willing to share their personal health information to advance medical research. You randomly select 500 U.S. adults. Find the probability that the number who are willing to share their personal health information to advance medical research is (a) at most
About 83% of U.S. employees drive their own vehicle to work. You randomly select a sample of U.S. employees. Find the probability that more than 100 of the employees drive their own vehicle to work.(a) You select 110 U.S. employees.(b) You select 125 U.S. employees.(c) You select 150 U.S. employees.
A survey of employed U.S. adults found that only 35% believe their employer cares about their well-being. You randomly select a sample of U.S. employees. Find the probability that fewer than 100 believe their employer cares about their well-being.(a) You select 250 U.S. employees.(b) You select 300
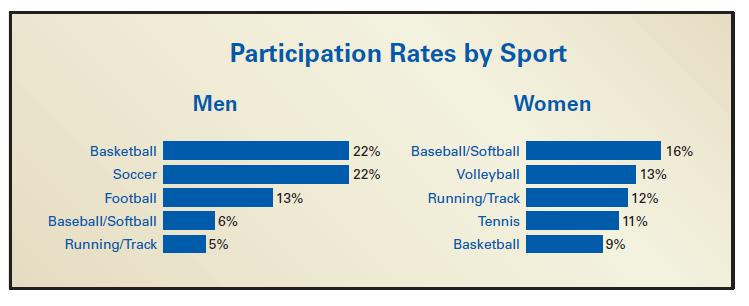
You randomly select 250 U.S. men ages 18 to 29 and ask them whether they participate in at least one sport. You find that 80% say no. How likely is this result? Do you think this sample is a good one? Explain your reasoning.The figure shows the results of a survey of U.S. adults ages 18 to 29 who
Showing 100 - 200
of 1977
1
2
3
4
5
6
7
8
9
10
11
12
13
14
15
Last
Step by Step Answers