New Semester
Started
Get
50% OFF
Study Help!
--h --m --s
Claim Now
Question Answers
Textbooks
Find textbooks, questions and answers
Oops, something went wrong!
Change your search query and then try again
S
Books
FREE
Study Help
Expert Questions
Accounting
General Management
Mathematics
Finance
Organizational Behaviour
Law
Physics
Operating System
Management Leadership
Sociology
Programming
Marketing
Database
Computer Network
Economics
Textbooks Solutions
Accounting
Managerial Accounting
Management Leadership
Cost Accounting
Statistics
Business Law
Corporate Finance
Finance
Economics
Auditing
Tutors
Online Tutors
Find a Tutor
Hire a Tutor
Become a Tutor
AI Tutor
AI Study Planner
NEW
Sell Books
Search
Search
Sign In
Register
study help
statistics
elementary statistics in social research
Elementary Statistics Picturing The World 8th Edition Ron Larson - Solutions
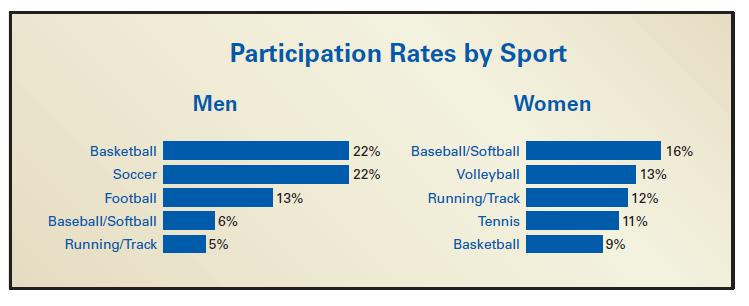
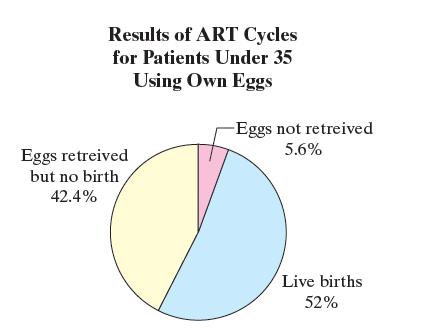
You randomly select 300 U.S. women ages 18 to 29 and ask them whether they participate in at least one sport. Of the 72 who say yes, 50% say they participate in volleyball. How likely is this result? Do you think this sample is a good one? Explain your reasoning.The figure shows the results of a
0.2090 Use the Standard Normal Table or technology to find the z-score that corresponds to the cumulative area or percentile.
0.4364 Use the Standard Normal Table or technology to find the z-score that corresponds to the cumulative area or percentile.
0.6736 Use the Standard Normal Table or technology to find the z-score that corresponds to the cumulative area or percentile.
0.7995 Use the Standard Normal Table or technology to find the z-score that corresponds to the cumulative area or percentile.
0.05 Use the Standard Normal Table or technology to find the z-score that corresponds to the cumulative area or percentile.
0.94 Use the Standard Normal Table or technology to find the z-score that corresponds to the cumulative area or percentile.
0.85 Use the Standard Normal Table or technology to find the z-score that corresponds to the cumulative area or percentile.
0.0093 Use the Standard Normal Table or technology to find the z-score that corresponds to the cumulative area or percentile.
\(P_{33}\)Use the Standard Normal Table or technology to find the z-score that corresponds to the cumulative area or percentile.
\(P_{97.5}\)Use the Standard Normal Table or technology to find the z-score that corresponds to the cumulative area or percentile.
\(P_{1.5}\)Use the Standard Normal Table or technology to find the z-score that corresponds to the cumulative area or percentile.
\(P_{25}\)Use the Standard Normal Table or technology to find the z-score that corresponds to the cumulative area or percentile.
\(P_{40}\)Use the Standard Normal Table or technology to find the z-score that corresponds to the cumulative area or percentile.
\(P_{91}\)Use the Standard Normal Table or technology to find the z-score that corresponds to the cumulative area or percentile.
\(P_{75}\)Use the Standard Normal Table or technology to find the z-score that corresponds to the cumulative area or percentile.
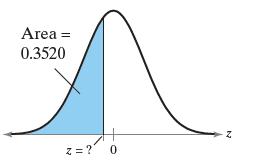
Find the indicated z-score(s) shown in the graph. Area = 0.3520 Z z=? 0
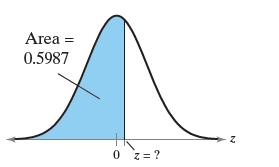
Find the indicated z-score(s) shown in the graph. Area = 0.5987 0 z=?
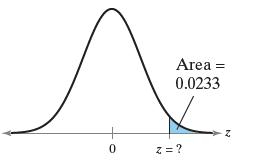
Find the indicated z-score(s) shown in the graph. Area = 0.0233 0 z = ?
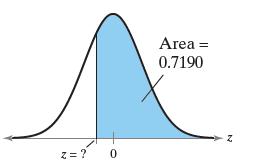
Find the indicated z-score(s) shown in the graph. z = ? 0 Area = 0.7190 Z
Find the indicated z-score(s) shown in the graph. Area = 0.05 Area = 0.05 z = ? 0 z = ? Z
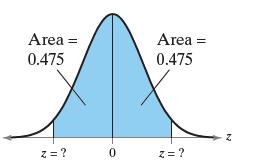
Find the indicated z-score(s) shown in the graph. Area = 0.475 Area = 0.475 z = ? 0 z=? N
In a survey of 18-year old males, the mean weight was 166.7 pounds with a standard deviation of 49.3 pounds.(a) What weight represents the 95th percentile?(b) What weight represents the 43rd percentile?(c) What weight represents the first quartile?
Surveyors asked respondents to rate ten key aspects of their government’s response to the COVID-19 pandemic, including preparedness, communication, and material aid. A pandemic response score that ranged from 0 to 100 was calculated. The mean score for U.S. respondents was 50.6 with a standard
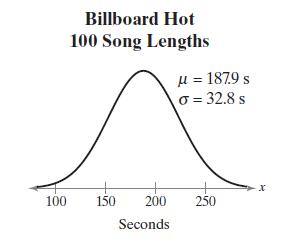
The length (in seconds) of the 100 most popular songs during the week of May 5, 2021, can be approximated by a normal distribution, as shown in the figure.(a) What song length represents the 5th percentile?(b) What song length represents the 17th percentile?(c) What song length represents the third
A water footprint is a measure of the appropriation of fresh water. The water footprint (in cubic meters) for a kilogram of wheat can be approximated by a normal distribution, as shown in the figure.(a) What water footprint represents the 80th percentile?(b) What water footprint represents the 29th
The Advanced Dental Admission Test (ADAT) is designed so that the scores fit a normal distribution, as shown in the figure.(a) What is the minimum ADAT score that is in the top 5% of scores?(b) Between what two values does the middle 50% of the ADAT scores lie?
The test scores for the analytical writing section of the Graduate Record Examination (GRE) can be approximated by a normal distribution, as shown in the figure.(a) What is the maximum score that can be in the bottom 20% of scores?(b) Between what two values does the middle 80% of the scores lie?
The pregnancy durations (in days) for a population of new mothers can be approximated by a normal distribution, with a mean of 267 days and a standard deviation of 10 days.(a) What is the minimum pregnancy durations that can be in the top 10% of pregnancy durations?(b) What pregnancy durations
In a history class, the grades for various assessments are all positive numbers and have different distributions. Determine whether the grades for each assessment could be normally distributed. Explain your reasoning.(a) a midterm exam with a mean of 67, standard deviation of 15, and 75th
\(P(x
\(P(x
\(P(160
\(P(172
In a survey of 19-year-old U.S. women, their heights were normally distributed, with a mean of 63.9 inches and a standard deviation of 3.3 inches. Find the probability that a randomly selected survey participant has a height that is (a) less than 57 inches, (b) between 60 and 65 inches, and (c)
In a survey of male infants from 3 to 5 months of age, head circumference was found to be normally distributed, with a mean of 42.9 centimeters and a standard deviation of 1.5 centimeters.Find the probability that a randomly selected infant from the survey had a head circumference of (a) less than
The monthly utility bills in a city are normally distributed, with a mean of \($100\) and a standard deviation of \($12\). Find the probability that a randomly selected utility bill is (a) less than \($70\), (b) between \($90\) and \($120\), and (c) more than $140.Find the indicated probabilities.
Use the normal distribution in Exercise 13.(a) What percent of the SAT total scores are less than 1300?(b) Out of 1000 randomly selected SAT total scores, about how many would you expect to be greater than 1100?Exercise 13A member is selected at random from the population represented by the graph.
Use the normal distribution in Exercise 14.(a) What percent of the ACT composite scores are less than 19?(b) Out of 1500 randomly selected ACT composite scores, about how many would you expect to be greater than 21?Exercise 14A member is selected at random from the population represented by the
Use the normal distribution in Exercise 15.(a) What percent of the new mothers had a pregnancy length of less than 290 days?(b) What percent of the new mothers had a pregnancy length of between 260 and 300 days?(c) Out of 250 randomly selected new mothers, about how many would you expect to have
Use the normal distribution in Exercise 16.(a) What percent of the adult males have a red blood cell count less than 6 million cells per microliter?(b) What percent of the adult males have a red blood cell count between 4.7 and 5.3 million cells per microliter?(c) Out of 200 randomly selected adult
Given the mean of a normal distribution, how can you find the median?
Describe the inflection points on the graph of a normal distribution. At what x-values are the inflection points located?
Give two real-life examples of a continuous variable. Include one that is likely to be normally distributed. Explain your reasoning.
Explain how to transform a given x-value of a normally distributed variable x into a z-score.
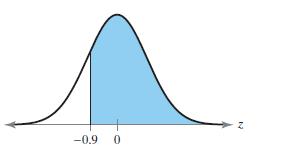
In Exercises 17–22, find the area of the shaded region under the standard normal curve. If convenient, use technology to find the area. -0.9 0 z
To the left of z = -1.675.Find the indicated area under the standard normal curve. If convenient, use technology to find the area.
To the right of z = 2.215.Find the indicated area under the standard normal curve. If convenient, use technology to find the area.
The test scores for the Stanford-Binet Intelligence Scale are normally distributed with a mean score of 100 and a standard deviation of 16.The test scores of four students selected at random are 98, 65, 106, and 124.In Exercises 39 and 40, (a) find the z-score that corresponds to each value and (b)
The test scores for students who took the SAT (without the essay) are normally distributed with a mean score of 1051 and a standard deviation of 211.The test scores of four students selected at random are 1050, 960, 870, and 1440.In Exercises 39 and 40, (a) find the z-score that corresponds to each
\(P(z
\(P(z
\(P(-0.89
\(P(0
\(P(-1.78
\(P(-1.54
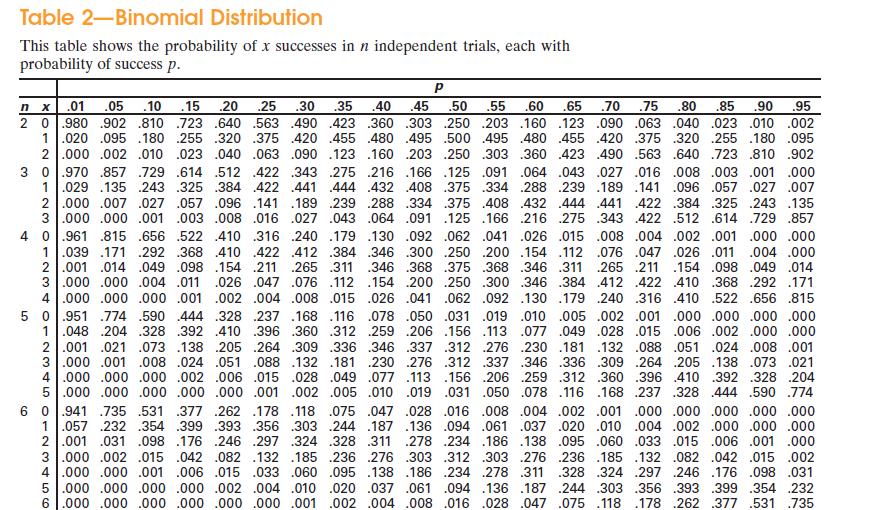
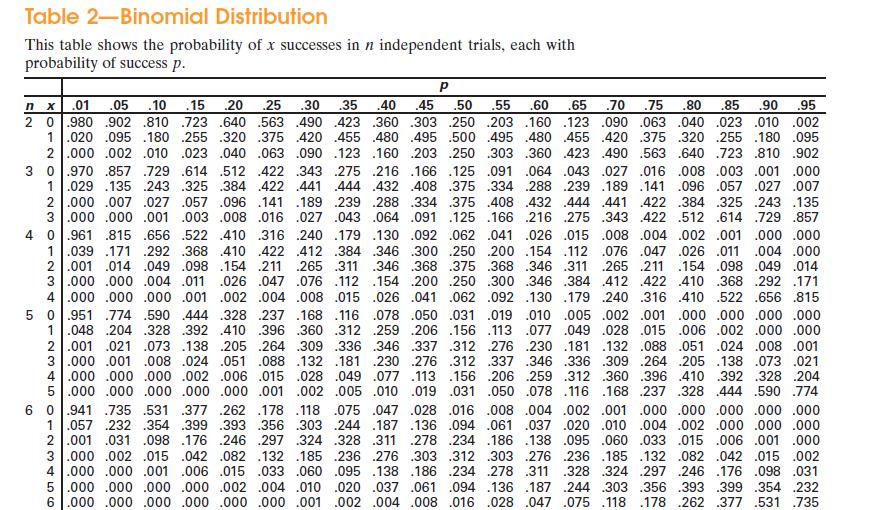
Which counting rule is used in the binomial probability formula?
A survey found that 29% of gamers own a virtual reality (VR) device. Ten gamers are randomly selected. The random variable represents the number who own a VR device.In Exercises 15–18, determine whether the experiment is a binomial experiment. If it is, identify a success; specify the values of
Argentine soccer player Lionel Messi converts 78% of his penalty kicks. Suppose Messi takes six penalty kicks next season. Find the probability that the number he converts is(a) exactly six,(b) at most three, and(c) more than three.In Exercises 19–26, find the indicated probabilities. If
Forty-five percent of consumers say it is important that the clothing they buy is made without child labor. You randomly select 16 consumers. Find the probability that the number of of consumers who say it is important that the clothing they buy is made without child labor is(a) exactly eight,(b)
Five percent of the U.S. workforce test positive for illicit drugs. You randomly select 14 workers. Find the probability that the number who test positive for illicit drugs is(a) exactly two,(b) more than two, and(c) from two to five.In Exercises 19–26, find the indicated probabilities. If
Sixty-six percent of people pronounce pecan “puh-CON” instead of “PEA-can.” You randomly select 15 people. Find the probability that the number of people who pronounce pecan “puh-CON” is(a) exactly seven,(b) more than seven, and(c) from seven to eleven.In Exercises 19–26, find the
Pennsylvania State University accepts 49% of applicants. You randomly select seven Pennsylvania State University applicants. The random variable represents the number who are accepted.In Exercises 19–26, find the indicated probabilities. If convenient, use technology or Table 2 in Appendix B.
Thirty-three percent of immigrants to the United States ages 25 and older have a bachelor’s degree or higher. You randomly select eight immigrants to the U.S. ages 25 and older. The random variable represents the number who have a bachelor’s degree or higher.In Exercises 19–26, find the
Seventy-seven percent of adults want to live to age 100.You randomly select five adults and ask them whether they want to live to age 100.The random variable represents the number who want to live to age 100.In Exercises 19–26, find the indicated probabilities. If convenient, use technology or
Eighty-five percent of U.S. adults believe cloning humans is morally wrong. You randomly select 10 U.S. adults and ask them whether they believe cloning humans is morally wrong. The random variable represents the number who believe cloning humans is morally wrong.In Exercises 31–36, find the
Thirty-one percent of U.S. employees who are late for work blame oversleeping. You randomly select 12 U.S. employees who are late for work and ask them whether they blame oversleeping. The random variable represents the number who are late for work and blame oversleeping.In Exercises 31–36, find
The probability of winning a game of rock-paper-scissors is 1/3.You play nine games of rock-paper-scissors. Find the probability that the number of games you win is (a) exactly five, (b) more than five, and (c) less than two.In Exercises 37 and 38, find the indicated probabilities.Then determine if
Fifty-three percent of U.S. adults are currently married. You randomly select twelve U.S. adults. Find the probability that the number who are married is (a) exactly nine, (b) less than four, and (c) from eight to eleven.In Exercises 37 and 38, find the indicated probabilities.Then determine if the
Sixty percent of U.S. adults favor establishing policies to reduce the use of fossil fuels. You randomly select eight U.S. adults. Find the probability that the number who favor establishing policies to reduce the use of fossil fuels is (a) exactly four, (b) less than five, and (c) at least
Eighteen percent of U.S. adults say they use Reddit. You randomly select seven U.S. adults. Find the probability that the number who use Reddit is (a) exactly one, (b) more than three, and (c) from two to four.In Exercises 11–26, find the indicated probabilities using the geometric distribution,
Let x represent the grade on an exam worth a total of 100 points.In Exercises 1 and 2, determine whether the random variable x is discrete or continuous. Explain.
Forty-two percent of U.S. adults have a gun in their home. You randomly select 12 U.S. adults. Find the probability that the number who have a gun in their home is(a) exactly two,(b) at least two, and(c) more than two.In Exercises 13–16, find the indicated binomial probabilities. If convenient,
Seventy-two percent of U.S. civilian employees have access to medical care benefits. You randomly select nine civilian employees. Find the probability that the number who have access to medical care benefits is(a) exactly six,(b) at least six, and(c) more than six.In Exercises 13–16, find the
Sixty-two percent of candidates taking the Texas Bar Exam pass the test.You randomly select five Texas Bar Exam candidates. Find the probability that the number who pass is(a) exactly two,(b) at least two, and(c) more than two.In Exercises 13–16, find the indicated binomial probabilities. If
Seventy-two percent of U.S adults have read a book in any format in the past year. You randomly select five U.S adults and ask them whether they have read a book in any format in the past year. The random variable represents the number of adults who have read a book in any format in the past
Forty-nine percent of U.S adults answer correctly when asked “What is phishing?” You randomly select six U.S adults and ask them “What is phishing?” The random variable represents the number of adults who answer correctly.In Exercises 17 and 18, (a) construct a binomial distribution, (b)
Thirty-three percent of NCAA student-athletes have a job waiting for them when they graduate college. You randomly select ten NCAA student‑athletes who are graduating and ask them whether they have a job waiting for them.The random variable represents the number who have a job waiting for them.In
Fourteen percent of noninstitutionalized U.S. adults smoke cigarettes.After randomly selecting ten noninstitutionalized U.S. adults, you ask them whether they smoke cigarettes. Find the probability that the first adult who smokes cigarettes is (a) the third person selected, (b) the fourth or fifth
From 1940 to 2020, tornadoes killed about 0.26 people per day in the United States. Assume this rate holds true today and is constant throughout the year. Find the probability that the number of people in the United States killed by a tornado tomorrow is (a) exactly zero, (b) at most two, and(c)
In a recent season, hockey player Evgeni Malkin scored 25 goals in 55 games he played. Assume that his goal production stayed at that level for the next season. Find the probability that he would get his first goal (a) in the first game of the season, (b) in the second game of the season, (c)
During a 10-year period, sharks killed an average of 6.4 people each year worldwide. Find the probability that the number of people killed by sharks next year is (a) exactly three, (b) more than six, and (c) at most five.In Exercises 21–26, find the indicated probabilities using the geometric
Sixty-nine percent of U.S. adults plan to get a COVID-19 vaccine or already have. You randomly select ten U.S. adults and ask them whether they plan to get a COVID-19 vaccine or already have. Find the probability that the number who plan to get a COVID-19 vaccine or already have is(a) exactly
Determine whether the random variable x is discrete or continuous. Explain your reasoning.(a) Let x represent the number of lightning strikes that occur in Wyoming during the month of June.(b) Let x represent the amount of fuel (in gallons) used by a jet during takeoff.(c) Let x represent the final
In the past year, thirty-three percent of U.S. adults have put off medical treatment because of the cost. You randomly select nine U.S. adults. Find the probability that the number who have put off medical treatment because of the cost in the past year is (a) exactly three, (b) at most four, and
The five-year survival rate of people who undergo a liver transplant is 75%.The surgery is performed on six patients.(a) Construct a binomial distribution.(b) Graph the binomial distribution using a histogram and describe its shape.(c) Find the mean, variance, and standard deviation of the binomial
Basketball player Stephen Curry makes a 3-pointer about 43% of the time.Find the probability that (a) the first 3-pointer he makes is the third shot,(b) the first 3-pointer he makes is the fourth or fifth shot, and (c) he does not make his first six shots.
One out of every 42 tax returns for incomes over $1 million requires an audit.An auditor is examining tax returns for over $1 million. Find the probability that (a) the first return requiring an audit is the 25th return the tax auditor examines, (b) the first return requiring an audit is the first
About 53% of U.S. full-time college students drank alcohol within a one-month period. You randomly select six U.S. full-time college students.Find the probability that the number who drank alcohol within a one-month period is (a) exactly two, (b) at least three, and (c) less than four.
The mean increase in the U.S. population is about 1.5 people per minute.Find the probability that the increase in the U.S. population in any given minute is (a) exactly three people, (b) more than four, and (c) at most four people.
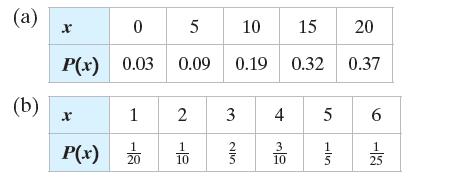
Determine whether the distribution is a probability distribution. If it is not a probability distribution, explain why. (a) x 0 5 10 15 20 P(x) 0.03 0.09 0.19 0.32 (b) x 1 P(x) 20 1 23 4 10 -19 25 0.37 5 6 43 115 319 10 25 112
Fifty-six percent of federal student loans are in repayment. You randomly select five student loans and determine whether they are in repayment.The random variable represents the number that are in repayment.(a) Construct a probability distribution.(b) Graph the probability distribution using a
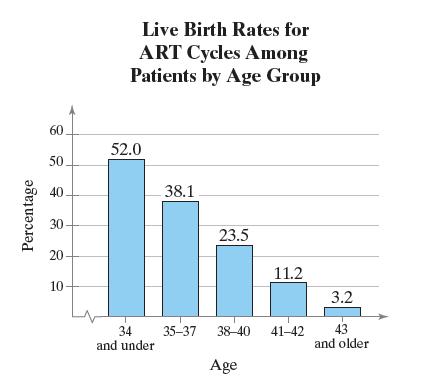
The Centers for Disease Control and Prevention (CDC) is required by law to publish a report on assisted reproductive technology (ART). ART includes all fertility treatments in which both the egg and the sperm are used. These procedures generally involve removing eggs from a patient’s ovaries,
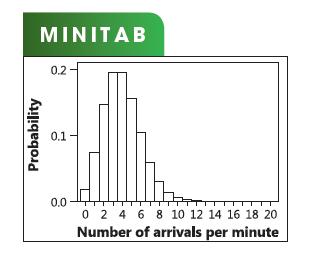
The mean number of customers who arrive at the checkout counters each minute is 4.Create a Poisson distribution with \(\mu=4\) for \(x=0\) to 20 . Compare your results with the histogram shown at the upper right.In Exercises 1–7, consider a grocery store that can process a total of four customers
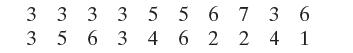
Minitab was used to generate 20 random numbers with a Poisson distribution for \(\mu=4\). Let the random number represent the number of arrivals at the checkout counter each minute for 20 minutes.During each of the first four minutes, only three customers arrived. These customers could all be
Generate a list of 20 random numbers with a Poisson distribution for \(\mu=4\). Create a table that shows the number of customers waiting at the end of 1 through 20 minutes.In Exercises 1–7, consider a grocery store that can process a total of four customers at its checkout counters each
The mean increases to five arrivals per minute, but the store can still process only four per minute. Generate a list of 20 random numbers with a Poisson distribution for \(\mu=5\). Then create a table that shows the number of customers waiting at the end of 20 minutes.In Exercises 1–7, consider
The mean number of arrivals per minute is five. What is the probability that 10 customers will arrive during the first minute?In Exercises 1–7, consider a grocery store that can process a total of four customers at its checkout counters each minute.Queuing means waiting in line to be served.
The mean number of arrivals per minute is four. Find the probability that(a) three, four, or five customers will arrive during the third minute.(b) more than four customers will arrive during the first minute.(c) more than four customers will arrive during each of the first four minutes.In
The mean number of arrivals per minute is four. Find the probability that(a) no customers are waiting in line after one minute.(b) one customer is waiting in line after one minute.(c) one customer is waiting in line after one minute and no customers are waiting in line after the second minute.(d)
Showing 200 - 300
of 1977
1
2
3
4
5
6
7
8
9
10
11
12
13
14
15
Last
Step by Step Answers