New Semester
Started
Get
50% OFF
Study Help!
--h --m --s
Claim Now
Question Answers
Textbooks
Find textbooks, questions and answers
Oops, something went wrong!
Change your search query and then try again
S
Books
FREE
Study Help
Expert Questions
Accounting
General Management
Mathematics
Finance
Organizational Behaviour
Law
Physics
Operating System
Management Leadership
Sociology
Programming
Marketing
Database
Computer Network
Economics
Textbooks Solutions
Accounting
Managerial Accounting
Management Leadership
Cost Accounting
Statistics
Business Law
Corporate Finance
Finance
Economics
Auditing
Tutors
Online Tutors
Find a Tutor
Hire a Tutor
Become a Tutor
AI Tutor
AI Study Planner
NEW
Sell Books
Search
Search
Sign In
Register
study help
statistics
elementary statistics in social research
Elementary Statistics Picturing The World 7th Global Edition Betsy Farber, Ron Larson - Solutions
A financial services accountant claims that the median amount of financial debt for families holding such debts is less than \(\$ 60,000\). In a random sample of 70 families with financial debt, the debts of 24 families were less than \(\$ 60,000\) and the debts of 46 families were greater than
A research group claims that the median age of the users of a social media website is greater than 30 years old. In a random sample of 24 users, 11 are less than 30 years old, 10 are more than 30 years old, and 3 are 30 years old. At \(\alpha=0.01\), can you support the research group's claim? (a)
A research group claims that the median age of the users of a social networking website is less than 32 years old. In a random sample of 20 users, 5 are less than 32 years old, 13 are more than 32 years old, and 2 are 32 years old. At \(\alpha=0.05\), can you support the research group's
A renters' organization claims that the median number of rooms in renter-occupied units is four. You randomly select 120 renter-occupied units and obtain the results shown below. At \(\alpha=0.05\), can you reject the organization's claim?(a) identify the claim and state \(H_{0}\) and \(H_{a}\),(b)
A renters' organization claims that the median square footage of renter-occupied units is 1000 square feet. You randomly select 22 renter-occupied units and obtain the results shown above. At \(\alpha=0.10\), can you reject the organization's claim?(a) identify the claim and state \(H_{0}\) and
A labor organization claims that the median hourly wage of computer systems analysts is \(\$ 41.93\). In a random sample of 45 computer systems analysts, 18 earn less than \(\$ 41.93\) per hour, 25 earn more than \(\$ 41.93\) per hour, and 2 earn \(\$ 41.93\) per hour. At \(\alpha=0.01\), can you
A labor organization claims that the median hourly wage of podiatrists is at least \(\$ 60.01\). In a random sample of 23 podiatrists, 17 earn less than \(\$ 60.01\) per hour, 5 earn more than \(\$ 60.01\) per hour, and 1 earns \(\$ 60.01\) per hour. At \(\alpha=0.05\), can you reject the labor
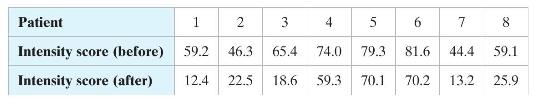
A physician claims that lower back pain intensity scores will decrease after receiving acupuncture treatment. The table shows the lower back pain intensity scores for eight patients before and after receiving acupuncture for eight weeks. At \(\alpha=0.05\), is there enough evidence to support the
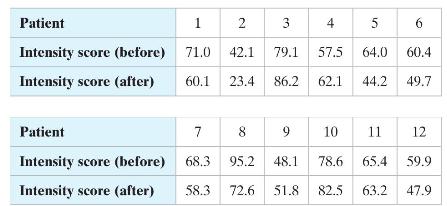
A physician claims that lower back pain intensity scores will decrease after taking anti-inflammatory drugs. The table shows the lower back pain intensity scores for 12 patients before and after taking anti-inflammatory drugs for 8 weeks. At \(\alpha=0.05\), is there enough evidence to support the
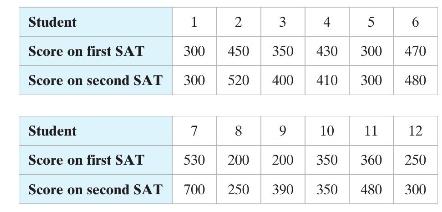
A tutoring agency claims that by completing a special course, students will improve their math SAT scores. In part of a study, 12 students take the math part of the SAT, complete the special course, then take the math part of the SAT again. The students' scores are shown below. At \(\alpha=0.05\),
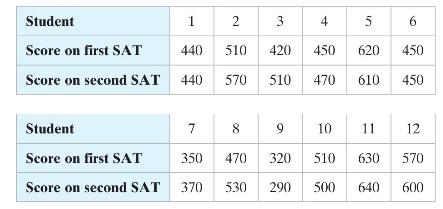
A guidance counselor claims that students who take the SAT twice will improve their scores the second time they take the SAT. The table shows both math SAT scores for 12 students who took the SAT twice. At \(\alpha=0.01\), can you support the guidance counselor's claim?(a) identify the claim and
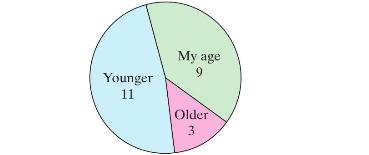
A research organization conducts a survey by randomly selecting adults and asking each, "How do you feel relative to your age?" The results are shown in the figure.(a) Use a sign test to test the null hypothesis that the proportion of adults who feel older is equal to the proportion of adults who
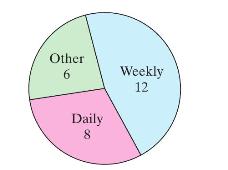
A research organization conducts a survey by randomly selecting adults and asking each, "How frequently do you contact your parents by phone?" The results are shown in the figure. (a) Use a sign test to test the null hypothesis that the proportion of adults who contact their parents by phone
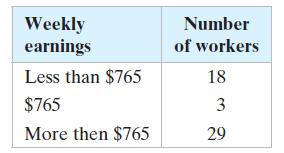
A labor organization claims that the median weekly earnings of female workers is less than or equal to \(\$ 765\). To test this claim, you randomly select 50 female workers and ask each to provide her weekly earnings. The table shows the results. At \(\alpha=0.01\), can you reject the
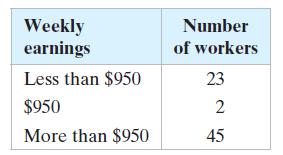
A labor organization claims that the median weekly earnings of male workers is greater than \(\$ 950\). To test this claim, you randomly select 70 male workers and ask each to provide his weekly earnings. The table shows the results. At \(\alpha=0.01\), can you support the organization's claim?Use
A marriage counselor claims that the median age of brides at the time of their first marriage is less than or equal to 27 years old. In a random sample of 65 brides, 24 are less than 27 years old, 35 are more than 27 years old, and 6 are 27 years old. At \(\alpha=0.05\), can you reject the
A marriage counselor claims that the median age of grooms at the time of their first marriage is greater than 28 years old. In a random sample of 56 grooms, 33 are less than 28 years old and 23 are more than 28 years old. At \(\alpha=0.05\), can you support the counselor's claim?Use a right-tailed
How do you know whether to use a Wilcoxon signed-rank test or a Wilcoxon rank sum test?
What is the requirement for the sample size of each sample when using the Wilcoxon rank sum test?
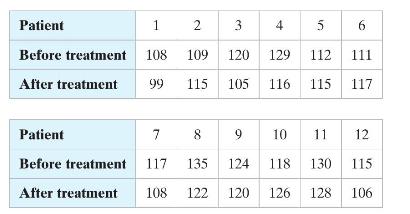
In a study testing the effects of calcium supplements on blood pressure in men, 12 men were randomly chosen and given a calcium supplement for 12 weeks. The table shows the measurements for each subject's diastolic blood pressure taken before and after the 12-week treatment period. At
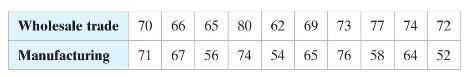
A private industry analyst claims that there is no difference in the salaries earned by workers in the wholesale trade and manufacturing industries. The table shows the salaries (in thousands of dollars) of a random sample of 10 wholesale trade workers and 10 manufacturing workers. At
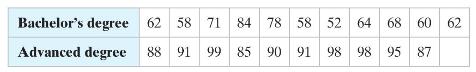
A college administrator claims that there is a difference in the earnings of people with bachelor's degrees and those with advanced degrees. The table shows the earnings (in thousands of dollars) of a random sample of 11 people with bachelor's degrees and 10 people with advanced degrees. At
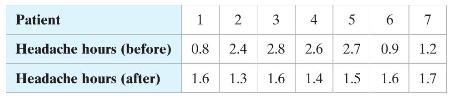
A medical researcher wants to determine whether a new drug affects the number of headache hours experienced by headache sufferers. To do so, the researcher randomly selects seven patients and asks each to give the number of headache hours (per day) each experiences before and after taking the drug.
A teacher's union representative claims that there is a difference in the salaries earned by teachers in Wisconsin and Michigan. The table shows the salaries (in thousands of dollars) of a random sample of 11 teachers from Wisconsin and 12 teachers from Michigan. At \(\alpha=0.05\), is there enough
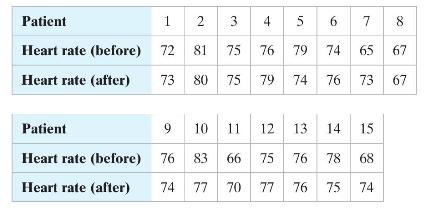
A physician wants to determine whether an experimental medication affects an individual's heart rate. The physician randomly selects 15 patients and measures the heart rate of each. The subjects then take the medication and have their heart rates measured after one hour. The table shows the
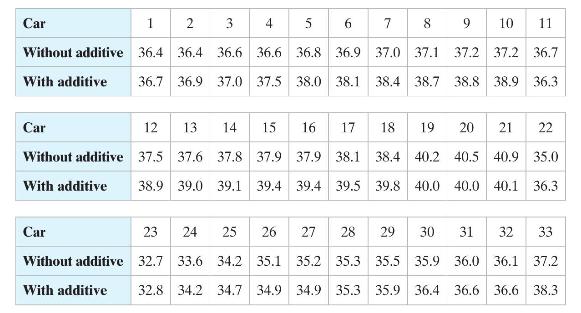
A petroleum engineer wants to know whether a certain fuel additive improves a car's gas mileage. To decide, the engineer records the gas mileages (in miles per gallon) of 33 randomly selected cars with and without the fuel additive. The table shows the results. At \(\alpha=0.10\), can the engineer
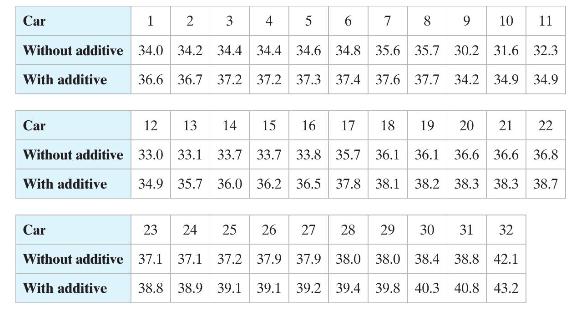
A petroleum engineer claims that a fuel additive improves gas mileage. The table shows the gas mileages (in miles per gallon) of 32 randomly selected cars measured with and without the fuel additive. Test the petroleum engineer's claim at \(\alpha=0.05\).Perform the Wilcoxon signed-rank test using
Correlation and Regression Correlation and regression analysis can be used to determine whether there is a significant relationship between two variables. When there is, you can use one of the variables to predict the value of the other variable. For instance, educators have used correlation and
The equation used to predict the net sales (in millions of dollars) for a fiscal year for a clothing retailer is\[ \hat{y}=23,769+9.18 x_{1}-8.41 x_{2} \]where \(x_{1}\) is the number of stores open at the end of the fiscal year and \(x_{2}\) is the average square footage per store. Use the
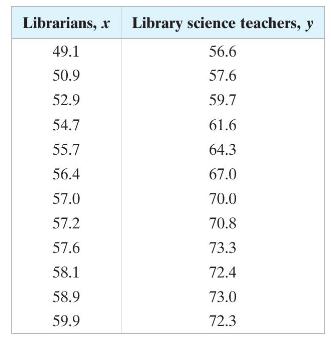
Calculate the correlation coefficient \(r\) and interpret the result.Use the data in the table, which shows the average annual salaries (both in thousands of dollars) for librarians and postsecondary library science teachers in the United States for 12 years. Librarians, .x Library science
Test the significance of the correlation coefficient \(r\) that you found in Exercise 3.Use \(\alpha=0.01\).Use the data in the table, which shows the average annual salaries (both in thousands of dollars) for librarians and postsecondary library science teachers in the United States for 12
Find the equation of the regression line for the data. Draw the regression line on the scatter plot that you constructed in Exercise 2.Use the data in the table, which shows the average annual salaries (both in thousands of dollars) for librarians and postsecondary library science teachers in the
Use the regression equation that you found in Exercise 5 to predict the average annual salary of postsecondary library science teachers when the average annual salary of librarians is \(\$ 56,000\).Use the data in the table, which shows the average annual salaries (both in thousands of dollars) for
Find the coefficient of determination \(r^{2}\) and interpret the result.Use the data in the table, which shows the average annual salaries (both in thousands of dollars) for librarians and postsecondary library science teachers in the United States for 12 years. Librarians, .x Library science
Find the standard error of estimate \(s_{e}\) and interpret the result.Use the data in the table, which shows the average annual salaries (both in thousands of dollars) for librarians and postsecondary library science teachers in the United States for 12 years. Librarians, .x Library science
Construct a \(99 \%\) prediction interval for the average annual salary of postsecondary library science teachers when the average annual salary of librarians is \(\$ 56,000\). Interpret the results.Use the data in the table, which shows the average annual salaries (both in thousands of dollars)
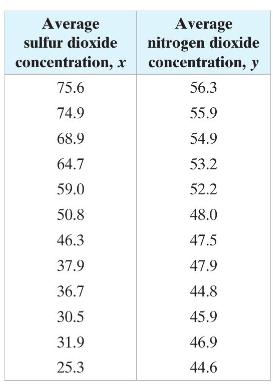
Acid rain affects the environment by increasing the acidity of lakes and streams to dangerous levels, damaging trees and soil, accelerating the decay of building materials and paint, and destroying national monuments. The goal of the Environmental Protection Agency's (EPA) Acid Rain Program is to
The U.S. Food and Drug Administration (FDA) requires nutrition labeling for most foods. Under FDA regulations, manufacturers are required to list the amounts of certain nutrients in their foods, such as calories, sugar, fat, and carbohydrates. This nutritional information is displayed in the
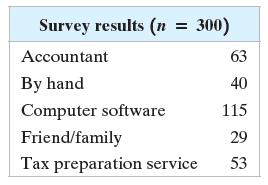
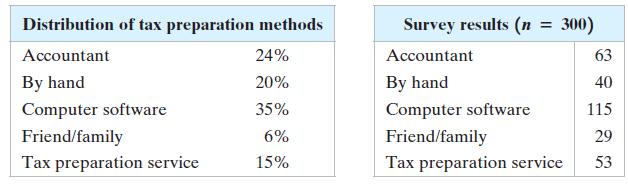
A tax preparation company randomly selects 300 adults and asks them how they prepare their taxes. The results are shown at the right. Find the observed frequency and the expected frequency (using the distribution on the preceding page) for each tax preparation method. Survey results (n = 300)
A retail trade association claims that the tax preparation methods of adults are distributed as shown in the table at the left below. A tax preparation company randomly selects 300 adults and asks them how they prepare their taxes. The results are shown in the table at the right below. At α =
A researcher claims that the number of different-colored candies in bags of dark chocolate M&M’s® is uniformly distributed. To test this claim, you randomly select a bag that contains 500 dark chocolate M&M’s®. The results are shown in the table below. At α = 0.10, test the researcher’s
\(n=125, p_{i}=0.4\)Find the expected frequency for the values of \(n\) and \(p_{i}\).
\(n=800, p_{i}=0.7\)Find the expected frequency for the values of \(n\) and \(p_{i}\).
\(n=350, p_{i}=0.35\)Find the expected frequency for the values of \(n\) and \(p_{i}\).
\(n=610, p_{i}=0.89\)Find the expected frequency for the values of \(n\) and \(p_{i}\).
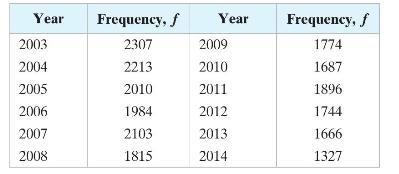
A researcher claims that the number of violent crimes in England and Wales by year is uniformly distributed. To test this claim, you randomly select 22,526 crimes from recent years and record the year when each happened. The table shows the results. At \(\alpha=0.05\), test the researcher's
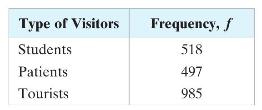
An organization claims that the number of people visiting Egypt each year, which includes students, patients, and tourists, is not uniformly distributed. To test this claim, you randomly select 2000 prospective visitors and ask them the purpose of their visit. The table at the left shows the
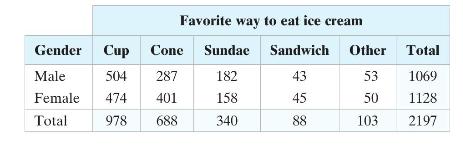
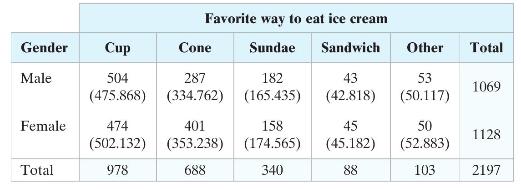
Find the expected frequency for each cell in the contingency table. Assume that the variables favorite way to eat ice cream and gender are independent. Gender Cup Cone Favorite way to eat ice cream Sundae Cone Sundae Sandwich Other Total Male 504 287 182 43 53 1069 Female 474 401 158 45 50 1128
The contingency table shows the results of a random sample of 2197 adults classified by their favorite way to eat ice cream and gender. The expected frequencies are displayed in parentheses. At \(\alpha=0.01\), can you conclude that the variables favorite way to eat ice cream and gender are
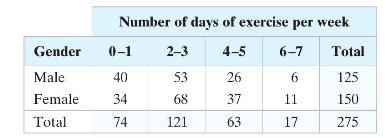
A health club manager wants to determine whether the number of days per week that college students exercise is related to gender. A random sample of 275 college students is selected and the results are classified as shown in the table. At \(\alpha=0.05\), is there enough evidence to conclude that
Is the chi-square homogeneity of proportions test a left-tailed, right-tailed, or two-tailed test?Use this information about the homogeneity of proportions test. Another chi-square test that involves a contingency table is the homogeneity of proportions test. This test is used to determine whether
Explain how the chi-square independence test is different from the chi-square homogeneity of proportions test.Use this information about the homogeneity of proportions test. Another chi-square test that involves a contingency table is the homogeneity of proportions test. This test is used to
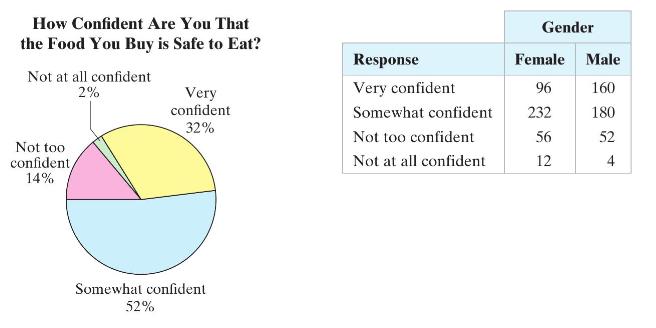
In your opinion, how safe is the food you buy? CBS News polled 1048 U.S. adults and asked them the question below.Overall, how confident are you that the food you buy is safe to eat: very confident, somewhat confident, not too confident, not at all confident?The pie chart shows the responses to the
Find the critical \(F\)-value for a right-tailed test when \(\alpha=0.10\), d.f. \(_{\mathrm{N}}=5\), and d.f. \(_{\mathrm{D}}=28\).
Find the critical \(F\)-value for a two-tailed test when \(\alpha=0.05\), d.f. \(_{\mathrm{N}}=4\), and d.f. \(_{\mathrm{D}}=8\).
A restaurant manager is designing a system that is intended to decrease the variance of the time customers wait before their meals are served. Under the old system, a random sample of 10 customers had a variance of 400. Under the new system, a random sample of 21 customers had a variance of 256 .
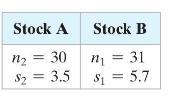
You want to purchase stock in a company and are deciding between two different stocks. Because a stock's risk can be associated with the standard deviation of its daily closing prices, you randomly select samples of the daily closing prices for each stock to obtain the results shown at the left. At
\(\alpha=0.05\), d.f. \({ }_{\mathrm{N}}=9\), d.f. \(_{\mathrm{D}}=16\)Find the critical F-value for a right-tailed test using the level of significance \(\alpha\) and degrees of freedom d.f.N and d.f.D.
\(\alpha=0.01\), d.f. \(_{\mathrm{N}}=2\), d.f. \(_\mathrm{D}=11\)Find the critical F-value for a right-tailed test using the level of significance \(\alpha\) and degrees of freedom d.f.N and d.f.D.
\(\alpha=0.10\), d.f. \({ }_{\mathrm{N}}=10\), d.f. \(_{\mathrm{D}}=15\)Find the critical F-value for a right-tailed test using the level of significance \(\alpha\) and degrees of freedom d.f.N and d.f.D.
\(\alpha=0.025\), d.f. \(_{\mathrm{N}}=7\), d.f. \(_{\mathrm{D}}=3\)Find the critical F-value for a right-tailed test using the level of significance \(\alpha\) and degrees of freedom d.f.N and d.f.D.
City A claims that the variance of its drunk-driving accidents is less than the variance of the drunk-driving accidents in City B. A sample of the drunk-driving cases of 15 of City A's accidents has a variance of 1.9. A sample of the drunk-driving cases of 20 of City B's accidents has a variance of
\(\alpha=0.05\), d.f. \(_{\mathrm{N}}=6\), d.f. \(_{\mathrm{D}}=3\)Find the right- and left-tailed critical F-values for a two-tailed test using the level of significance \(\alpha\) and degrees of freedom \(d . f_{\cdot N}\) and d.f.D.
\(\alpha=0.10\), d.f. \(_{\mathrm{N}}=20\), d.f. \(_{\mathrm{D}}=15\)Find the right- and left-tailed critical F-values for a two-tailed test using the level of significance \(\alpha\) and degrees of freedom \(d . f_{\cdot N}\) and d.f.D.
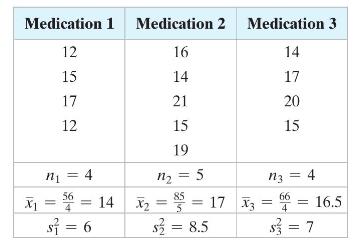
A medical researcher wants to determine whether there is a difference in the mean lengths of time it takes three types of pain relievers to provide relief from headache pain. Several headache sufferers are randomly selected and given one of the three medications. Each headache sufferer records the
A researcher believes that for city driving, the fuel economy of compact, midsize, and large cars are the same. The gas mileages (in miles per gallon) for city driving for several randomly selected cars from each category are shown in the table at the left. Assume that the populations are normally
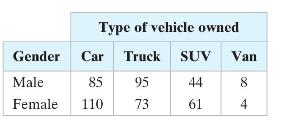
The contingency table shows the results of a random sample of individuals by gender and type of vehicle owned. At \(\alpha=0.01\), can you conclude that gender is related to the type of vehicle owned?(a) find the expected frequency for each cell in the contingency table,(b) identify the claim and
\(\alpha=0.05\), d.f. \(_{\mathrm{N}}=6\), d.f. \(_{\mathrm{D}}=50\)Find the critical F-value for a right-tailed test using the level of significance \(\alpha\) and degrees of freedom d.f.N and d.f.D.
\(\alpha=0.01\), d.f. \(_{\mathrm{N}}=12\), d.f. \(_{\mathrm{D}}=10\)Find the critical F-value for a right-tailed test using the level of significance \(\alpha\) and degrees of freedom d.f.N and d.f.D.
\(\alpha=0.10\), d.f. \(_{\mathrm{N}}=5\), d.f. \(_{\mathrm{D}}=12\)Find the critical F-value for a right-tailed test using the level of significance \(\alpha\) and degrees of freedom d.f.N and d.f.D.
\(\alpha=0.05\), d.f. \(_{\mathrm{N}}=20\), d.f. \(_{\mathrm{D}}=25\)Find the critical F-value for a right-tailed test using the level of significance \(\alpha\) and degrees of freedom d.f.N and d.f.D.
\(\alpha=0.10\), d.f. \(_{\mathrm{N}}=15\), d.f. \(_{\mathrm{D}}=27\)Find the critical F-value for a two-tailed test using the level of significance \(\alpha\) and degrees of freedom d.f.N and d.f.D.
\(\alpha=0.05\), d.f. \(_{\mathrm{N}}=9\), d.f. \(_{\mathrm{D}}=8\)Find the critical F-value for a two-tailed test using the level of significance \(\alpha\) and degrees of freedom d.f.N and d.f.D.
\(\alpha=0.01\), d.f. \(_{\mathrm{N}}=40\), d.f. \(_{\mathrm{D}}=60\)Find the critical F-value for a two-tailed test using the level of significance \(\alpha\) and degrees of freedom d.f.N and d.f.D.
\(\alpha=0.01\), d.f. \(_{\mathrm{N}}=11\), d.f. \(_{\mathrm{D}}=13\)Find the critical F-value for a two-tailed test using the level of significance \(\alpha\) and degrees of freedom d.f.N and d.f.D.
An instructor claims that the variance of SAT critical reading scores for females is different than the variance of SAT critical reading scores for males. The table shows the SAT critical reading scores for 12 randomly selected female students and 12 randomly selected male students. At
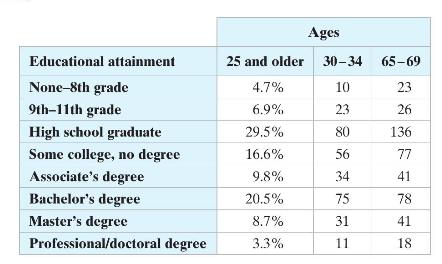
Does the distribution for people in the United States ages 25 and older differ from the distribution for people in the United States ages 30-34? Use \(\alpha=0.05\).(a) identify the claim and state \(H_{0}\) and \(H_{a}\),(b) find the critical value and identify the rejection region,(c) find the
Use the data for 30 - to 34 -year-olds and 65 - to 69 -year-olds to test whether age and educational attainment are related. Use \(\alpha=0.01\).(a) identify the claim and state \(H_{0}\) and \(H_{a}\),(b) find the critical value and identify the rejection region,(c) find the test statistic,(d)
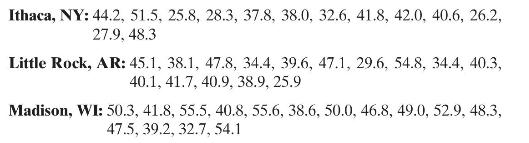
At \(\alpha=0.01\), is there enough evidence to conclude that the variances of the annual wages for Ithaca, NY, and Little Rock, AR, are different?(a) identify the claim and state \(H_{0}\) and \(H_{a}\),(b) find the critical value and identify the rejection region,(c) find the test statistic,(d)
Are the mean annual wages the same for all three cities? Use \(\alpha=0.10\). Assume that the population variances are equal.(a) identify the claim and state \(H_{0}\) and \(H_{a}\),(b) find the critical value and identify the rejection region,(c) find the test statistic,(d) decide whether to
In a survey of 3015 U.S. adults, \(80 \%\) say their household contains a desktop or laptop computer.(a) Construct a 95\% confidence interval for the proportion of U.S. adults who say their household contains a desktop or laptop computer.(b) A researcher claims that more than \(75 \%\) of U.S.
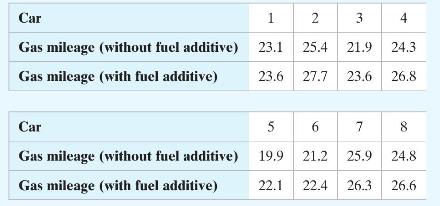
The table shows the gas mileages (in miles per gallon) of eight cars with and without using a fuel additive. At \(\alpha=0.10\), is there enough evidence to conclude that the additive improved gas mileage? Assume the populations are normally distributed. Car 1 2 3 4 24.3 Gas mileage (without fuel
\(c=0.95, \bar{x}=26.97, \sigma=3.4, n=42\)Construct the indicated confidence interval for the population mean \(\mu\). Which distribution did you use to create the confidence interval?
\(c=0.95, \bar{x}=3.46, s=1.63, n=16\)Construct the indicated confidence interval for the population mean \(\mu\). Which distribution did you use to create the confidence interval?
\(c=0.99, \bar{x}=12.1, s=2.64, n=26\)Construct the indicated confidence interval for the population mean \(\mu\). Which distribution did you use to create the confidence interval?
\(c=0.90, \bar{x}=8.21, \sigma=0.62, n=8\)Construct the indicated confidence interval for the population mean \(\mu\). Which distribution did you use to create the confidence interval?
\(\mu
\(p \geq 0.19\)The statement represents a claim. Write its complement and state which is \(H_{0}\) and which is \(H_{a}\).
\(\sigma=0.63\)The statement represents a claim. Write its complement and state which is \(H_{0}\) and which is \(H_{a}\).
\(\mu eq 2.28\)The statement represents a claim. Write its complement and state which is \(H_{0}\) and which is \(H_{a}\).
A pediatrician claims that the mean birth weight of a single-birth baby is greater than the mean birth weight of a baby that has a twin. The mean birth weight of a random sample of 85 single-birth babies is 3086 grams. Assume the population standard deviation is 563 grams. The mean birth weight of
The mean room rate for two adults for a random sample of 26 three-star hotels in Cincinnati has a sample standard deviation of \(\$ 31\). Assume the population is normally distributed.(a) Construct a 99\% confidence interval for the population variance.(b) Construct a \(99 \%\) confidence interval
An education organization claims that the mean SAT scores for male athletes and male non-athletes at a college are different. A random sample of 26 male athletes at the college has a mean SAT score of 1189 and a standard deviation of 218.A random sample of 18 male non-athletes at the college has a
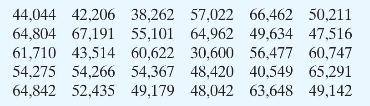
The annual earnings (in dollars) for 30 randomly selected locksmiths are shown below. Assume the population is normally distributed.(a) Construct a \(95 \%\) confidence interval for the population mean annual earnings for locksmiths.(b) A researcher claims that the mean annual earnings for
A medical research team studied the use of a marijuana extract to treat children with an epilepsy disorder. Of the 52 children who were given the extract, the number of convulsive seizures was reduced from 12 to 6 per month. Of the 56 children who were given a placebo, the number of convulsive
A random sample of 40 ostrich eggs has a mean incubation period of 42 days. Assume the population standard deviation is 1.6 days.(a) Construct a 95\% confidence interval for the population mean incubation period.(b) A zoologist claims that the mean incubation period for ostriches is at least 45
A researcher claims that \(5 \%\) of people who wear eyeglasses purchase their eyeglasses online. Describe type I and type II errors for a hypothesis test of the claim.
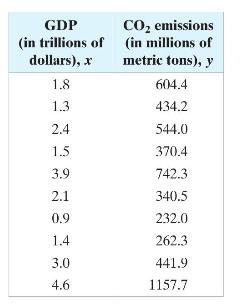
An economist wants to determine whether there is a linear relationship between a country's gross domestic product (GDP) and carbon dioxide \(\left(\mathrm{CO}_{2}\right)\) emissions. The data are shown in the table at the left. Display the data in a scatter plot and describe the type of
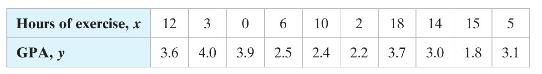
A student conducts a study to determine whether there is a linear relationship between the number of hours a student exercises each week and the student's grade point average (GPA). The data are shown in the table below. Display the data in a scatter plot and describe the type of correlation. Hours
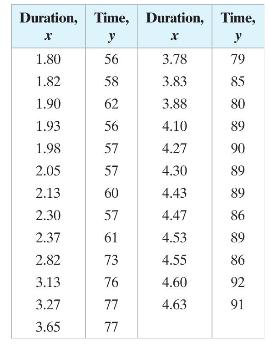
Old Faithful, located in Yellowstone National Park, is the world's most famous geyser. The durations (in minutes) of several of Old Faithful's eruptions and the times (in minutes) until the next eruption are shown in the table at the left. Use technology to display the data in a scatter plot.
Showing 600 - 700
of 1977
1
2
3
4
5
6
7
8
9
10
11
12
13
14
15
Last
Step by Step Answers