New Semester
Started
Get
50% OFF
Study Help!
--h --m --s
Claim Now
Question Answers
Textbooks
Find textbooks, questions and answers
Oops, something went wrong!
Change your search query and then try again
S
Books
FREE
Study Help
Expert Questions
Accounting
General Management
Mathematics
Finance
Organizational Behaviour
Law
Physics
Operating System
Management Leadership
Sociology
Programming
Marketing
Database
Computer Network
Economics
Textbooks Solutions
Accounting
Managerial Accounting
Management Leadership
Cost Accounting
Statistics
Business Law
Corporate Finance
Finance
Economics
Auditing
Tutors
Online Tutors
Find a Tutor
Hire a Tutor
Become a Tutor
AI Tutor
AI Study Planner
NEW
Sell Books
Search
Search
Sign In
Register
study help
statistics
elementary statistics in social research
Elementary Statistics Picturing The World 7th Global Edition Betsy Farber, Ron Larson - Solutions
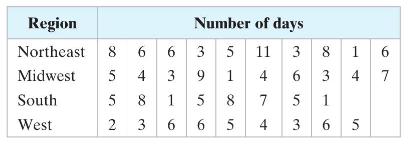
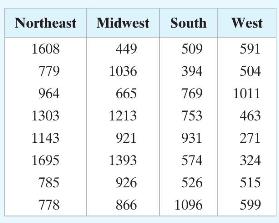
An insurance underwriter claims that the number of days patients spend in the hospital is different in at least one region of the United States. The table shows the numbers of days randomly selected patients spent in the hospital in four U.S. regions. At \(\alpha=0.01\), can you support the
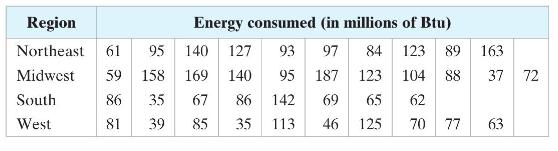
The table shows the energy consumed (in millions of Btu) in one year for a random sample of households from four U.S. regions. At \(\alpha=0.01\), can you conclude that the energy consumed is different in at least one region?(a) perform a Kruskal-Wallis test.(b) perform a one-way ANOVA test,
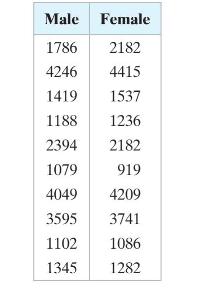
The table shows the school enrollments of males and females for a random sample of 10 colleges. At \(\alpha=0.05\), can you conclude that there is a significant correlation between the number of males and the number of females enrolled at a college? Male Female 1786 2182 4246 4415 1419 1537 1188
What are some advantages of the Spearman rank correlation coefficient over the Pearson correlation coefficient?
Describe the ranges of the Spearman rank correlation coefficient and the Pearson correlation coefficient.
What does it mean when \(r_{s}\) is equal to 1 ? What does it mean when \(r_{s}\) is equal to -1 ? What does it mean when \(r_{s}\) is equal to 0 ?
Explain, in your own words, what \(r_{s}\) and \(ho_{s}\) represent in Example 1.
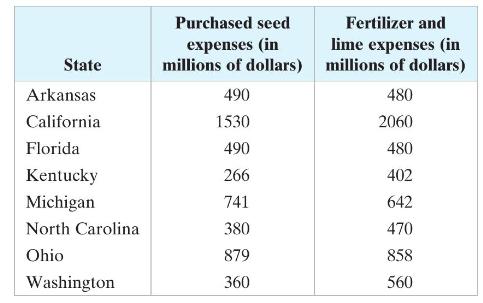
In an agricultural report, a commodities analyst claims that there is a significant correlation between purchased seed expenses and fertilizer and lime expenses in the farming business. The table shows the total purchased seed expenses and fertilizer and lime expenses for farms in eight randomly
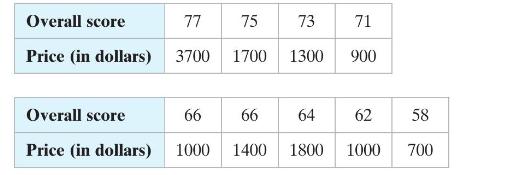
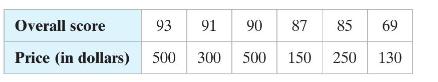
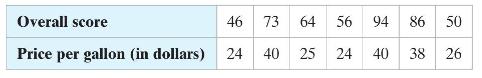
The table shows the overall scores and the prices for a random sample of nine different models of elliptical exercise machines. The overall score represents the ergonomics, exercise range, ease of use, construction, heart-rate monitoring, and safety. At \(\alpha=0.05\), can you conclude that there
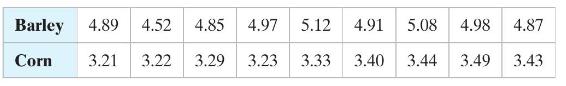
The table shows the prices (in dollars per bushel) received for barley and corn for a random sample of nine U.S. farmers. At \(\alpha=0.05\), can you conclude that there is a significant correlation between the barley and corn prices?(a) identify the claim and state \(H_{0}\) and \(H_{a}\), (b)
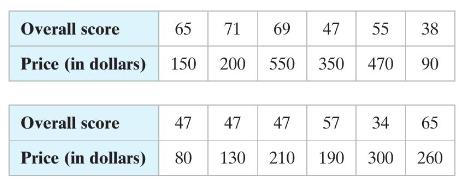
Vacuum Cleaners The table shows the overall scores and the prices for a random sample of 12 different models of vacuum cleaners. The overall score represents cleaning, airflow, handling, noise, and emissions. At \(\alpha=0.10\), can you conclude that there is a significant correlation between the
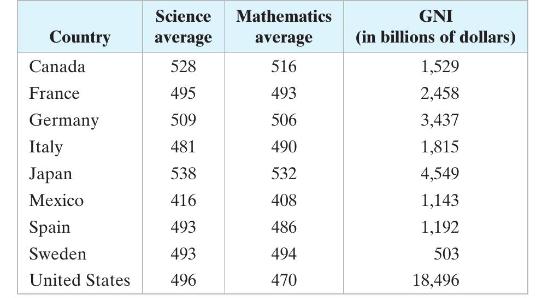
At \(\alpha=0.10\), can you conclude that there is a significant correlation between science achievement scores and GNI?Use the table below. The table shows the average achievement scores of 15-year-olds in science and mathematics along with the gross national incomes (GNI) of nine randomly
At \(\alpha=0.10\), can you conclude that there is a significant correlation between mathematics achievement scores and GNI?Use the table below. The table shows the average achievement scores of 15-year-olds in science and mathematics along with the gross national incomes (GNI) of nine randomly
At \(\alpha=0.10\), can you conclude that there is a significant correlation between science and mathematics achievement scores?Use the table below. The table shows the average achievement scores of 15-year-olds in science and mathematics along with the gross national incomes (GNI) of nine randomly
Use the results from Exercises \(9-11\) to write a summary about the correlation (or lack of correlation) between test scores and GNI.Use the table below. The table shows the average achievement scores of 15-year-olds in science and mathematics along with the gross national incomes (GNI) of nine
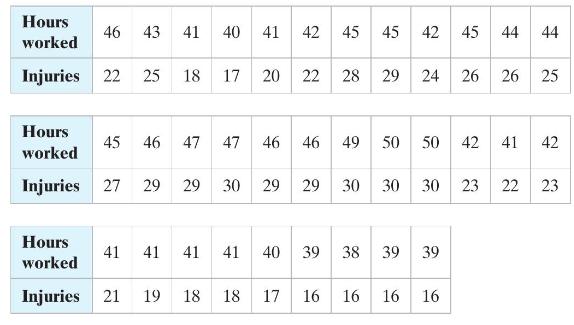
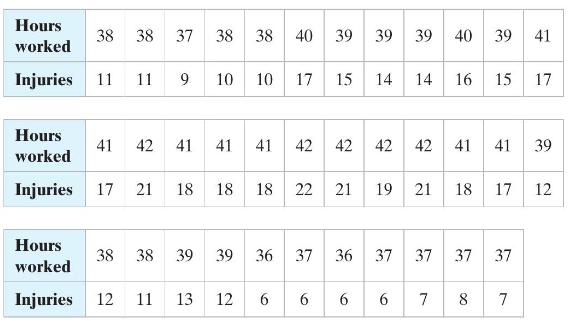
The table shows the average hours worked per week and the numbers of on-the-job injuries for a random sample of U.S. companies in a recent year. At \(\alpha=0.10\), can you conclude that there is a significant correlation between average hours worked and the number of on-the-job injuries?When you
The table shows the average hours worked per week and the numbers of on-the-job injuries for a random sample of U.S. construction companies in a recent year. At \(\alpha=0.05\), can you conclude that there is a significant correlation between average hours worked and the number of on-the-job
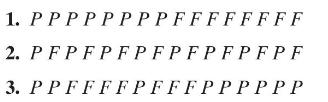
A liquid-dispensing machine has been designed to fill one-liter bottles. A quality control inspector decides whether each bottle is filled to an acceptable level and passes inspection \((P)\) or fails inspection \((F)\). Determine the number of runs for each sequence and find the length of each
As people enter a concert, an usher records where they are sitting. The results for 13 people are shown, where \(L\) represents a lawn seat and \(P\) represents a pavilion seat. At \(\alpha=0.05\), can you conclude that the sequence of seat locations is not random?LL L P P L P P P LL P L
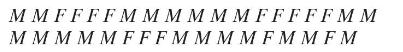
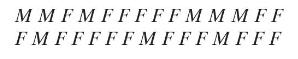
You want to determine whether the selection of recently hired employees in a large company is random with respect to gender. The genders of 36 recently hired employees are shown below, where \(F\) represents a female and \(M\) represents a male. At \(\alpha=0.05\), can you conclude that the
In your own words, explain why the hypothesis test discussed in this section is called the runs test.
Describe the test statistic for the runs test when the sample sizes \(n_{1}\) and \(n_{2}\) are less than or equal to 20 and when either \(n_{1}\) or \(n_{2}\) is greater than 20 .
\(T F T F T T T F F F T F\)Determine the number of runs in the sequence. Then find the length of each run.
\(U U D D U D U U D D U D U\)Determine the number of runs in the sequence. Then find the length of each run.
\(M F M F M F F F F F F M M M F F M M M M\)Determine the number of runs in the sequence. Then find the length of each run.
\(A A A B B B A B B A A A A A A B A A B A B B\)Determine the number of runs in the sequence. Then find the length of each run.
Find the values of \(n_{1}\) and \(n_{2}\) in Exercise 3.Data from Exercises 3\(T F T F T T T F F F T F\)Determine the number of runs in the sequence. Then find the length of each run.
Find the values of \(n_{1}\) and \(n_{2}\) in Exercise 4 .Data from Exercises 4\(U U D D U D U U D D U D U\)Determine the number of runs in the sequence. Then find the length of each run.
Find the values of \(n_{1}\) and \(n_{2}\) in Exercise 5 .Data from Exercises 5\(M F M F M F F F F F F M M M F F M M M M\)Determine the number of runs in the sequence. Then find the length of each run.
Find the values of \(n_{1}\) and \(n_{2}\) in Exercise 6 .Data from Exercises 6\(A A A B B B A B B A A A A A A B A A B A B B\)Determine the number of runs in the sequence. Then find the length of each run.
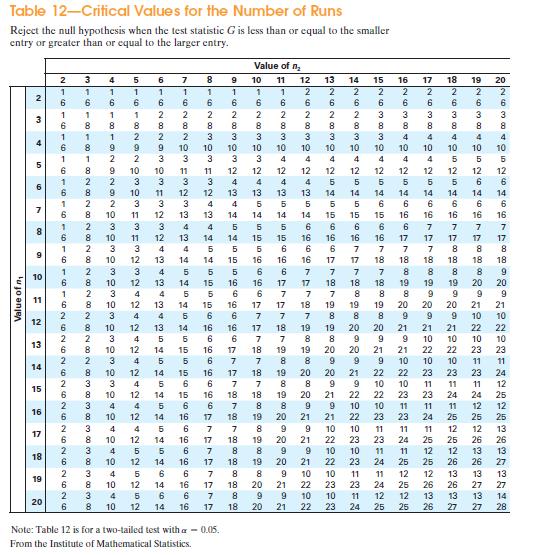
T F T F T F T F T F T F Use the sequence and Table 12 in Appendix B to determine the number of runs that are considered too high and the number of runs that are considered too low for the data to be in random order. Value of n Table 12-Critical Values for the Number of Runs Reject the null
\(M F M M M M M M F F M M\)Use the sequence and Table 12 in Appendix B to determine the number of runs that are considered too high and the number of runs that are considered too low for the data to be in random order. Value of n Table 12-Critical Values for the Number of Runs Reject the null
\(N S S S N N N N S N S N S S N N N\)Use the sequence and Table 12 in Appendix B to determine the number of runs that are considered too high and the number of runs that are considered too low for the data to be in random order. Value of n Table 12-Critical Values for the Number of Runs Reject the
\(X X X X X X X Y Y Y Y Y Y Y Y Y Y Y Y Y Y\)Use the sequence and Table 12 in Appendix B to determine the number of runs that are considered too high and the number of runs that are considered too low for the data to be in random order. Value of n Table 12-Critical Values for the Number of Runs
A coach records the results of the coin toss at the beginning of each football game for a season. The results are shown, where \(H\) represents heads and \(T\) represents tails. The coach claimed the tosses were not random. Test the coach's claim.(a) identify the claim and state \(H_{0}\) and
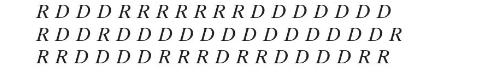
The sequence shows the majority party of the U.S. Senate after each election for a recent group of years, where \(R\) represents the Republican party and \(D\) represents the Democratic party. Can you conclude that the sequence is not random?(a) identify the claim and state \(H_{0}\) and
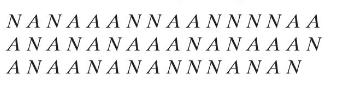
The sequence shows the Major League Baseball league of each World Series winning team from 1969 to 2016, where \(N\) represents the National League and \(A\) represents the American League. Can you conclude that the sequence of leagues of World Series winning teams is not random?(a) identify the
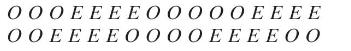
A number generator outputs the sequence of digits shown, where \(O\) represents an odd digit and \(E\) represents an even digit. Test the claim that the digits were not randomly generated.(a) identify the claim and state \(H_{0}\) and \(H_{a}\),(b) find the critical values,(c) find the test
A team of veterinarians record, in order, the genders of every dog that is microchipped at their pet hospital in one month. The genders of recently microchipped dogs are shown, where \(F\) represents a female and \(M\) represents a male. A veterinarian claims that the microchips are random by
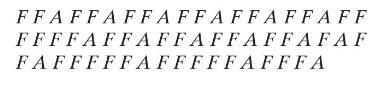
A golf tournament official records whether each past winner is American-born \((A)\) or foreign-born \((F)\). The results are shown for every year the tournament has existed. Can you conclude that the sequence is not random?(a) identify the claim and state \(H_{0}\) and \(H_{a}\),(b) find the
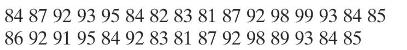
The sequence shows the daily high temperatures (in degrees Fahrenheit) for a city during the month of July. Test the claim that the daily high temperatures do not occur randomly.Use the following information to perform a runs test. You can also use the runs test for randomness with quantitative
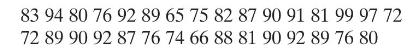
Exam Scores The sequence shows the exam scores of a class based on the order in which the students finished the test. Test the claim that the scores occur randomly.Use the following information to perform a runs test. You can also use the runs test for randomness with quantitative data. First,
Use technology to generate a sequence of 30 numbers from 1 to 99 , inclusive. Test the claim that the sequence of numbers is not random.Use the following information to perform a runs test. You can also use the runs test for randomness with quantitative data. First, calculate the median. Then
Before you could perform many of the hypothesis tests you learned about in previous chapters, you had to ensure that certain conditions about the population were satisfied. For instance, before you could perform a \(t\)-test, you had to verify that the population was normally distributed or the
A store manager claims that the median number of customers per day is no more than 650 . The numbers of customers per day for 17 randomly selected days are listed below. At \(\alpha=0.01\), can you reject the manager's claim?Use a sign test to test the claim by doing the following.(a) Identify the
A company claims that the median credit score for U.S. adults is at least 710 . The credit scores for 13 randomly selected U.S. adults are listed below. At \(\alpha=0.05\), can you reject the company's claim?Use a sign test to test the claim by doing the following.(a) Identify the claim and state
A government agency claims that the median sentence length for all federal prisoners is 2 years. In a random sample of 180 federal prisoners, 65 have sentence lengths that are less than 2 years, 109 have sentence lengths that are more than 2 years, and 6 have sentence lengths that are 2 years. At
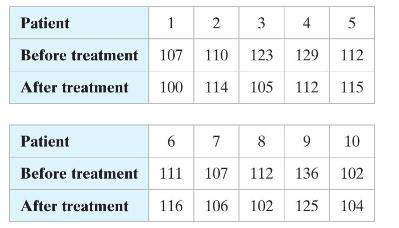
In a study testing the effects of calcium supplements on blood pressure in men, 10 randomly selected men were given a calcium supplement for 12 weeks. The table shows the measurements for each subject's diastolic blood pressure taken before and after the 12-week treatment period. At
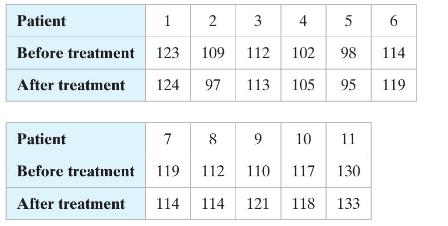
In a study testing the effects of an herbal supplement on blood pressure in men, 11 randomly selected men were given an herbal supplement for 12 weeks. The table shows the measurements for each subject's diastolic blood pressure taken before and after the 12-week treatment period. At
An association claims that the median annual salary of lawyers is \(\$ 118,160\). In a random sample of 125 lawyers, 76 were paid less than \(\$ 118,160\), and 49 were paid more than \(\$ 118,160\). At \(\alpha=0.05\), can you reject the association's claim?Use a sign test to test the claim by
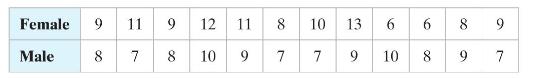
A career placement advisor claims that there is a difference in the total times required to earn a doctorate degree by female and male graduate students. The table shows the total times (in years) to earn a doctorate for a random sample of 12 female and 12 male graduate students. At
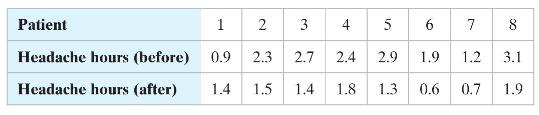
A medical researcher claims that a new drug affects the number of headache hours experienced by headache sufferers. The numbers of headache hours (per day) experienced by eight randomly selected patients before and after taking the drug are shown in the table. At \(\alpha=0.05\), can you support
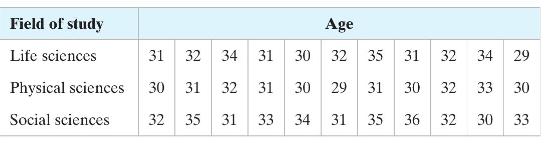
The table shows the ages for a random sample of doctorate recipients in three fields of study. At \(\alpha=0.01\), can you conclude that the distribution of the ages of the doctorate recipients in at least one field of study is different from the others?Use the Kruskal-Wallis test to test the claim
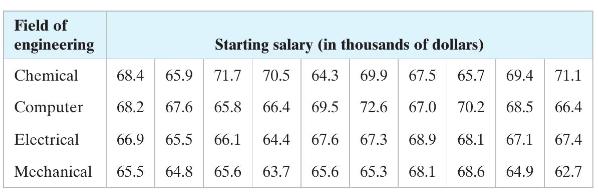
The table shows the starting salaries for a random sample of college graduates in four fields of engineering. At \(\alpha=0.05\), can you conclude that the distribution of the starting salaries in at least one field of engineering is different from the others?Use the Kruskal-Wallis test to test the
The table shows the overall scores and the prices for six randomly selected video disk players. The overall score is based mainly on picture quality. At \(\alpha=0.10\), can you conclude that there is a significant correlation between the overall score and the price?Use the Spearman rank
The table shows the overall scores and the prices per gallon for seven randomly selected interior paints. The overall score represents hiding, surface smoothness, and resistance to staining, scrubbing, gloss change, sticking, mildew, and fading. At \(\alpha=0.10\), can you conclude that there is a
A highway patrol officer stops speeding vehicles on an interstate highway. The genders of the last 25 drivers who were stopped are shown, where \(F\) represents a female driver and \(M\) represents a male driver. Can you conclude that the stops were not random by gender?(a) identify the claim and
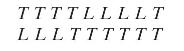
The sequence shows the departure status of the last 18 buses to leave a bus station, where \(T\) represents a bus that departed on time and \(L\) represents a bus that departed late. Can you conclude that the departure status of the buses is not random?(a) identify the claim and state \(H_{0}\) and
An organization claims that the median number of annual volunteer hours is 52. In a random sample of 75 people who volunteered last year, 47 volunteered for less than 52 hours, 23 volunteered for more than 52 hours, and 5 volunteered for 52 hours. At \(\alpha=0.05\), can you reject the
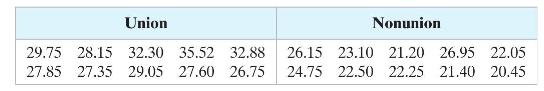
A labor organization claims that there is a difference in the hourly earnings of union workers and nonunion workers in state and local governments. The table shows the hourly earnings (in dollars) for a random sample of 10 union workers and 10 nonunion workers in state and local governments. At
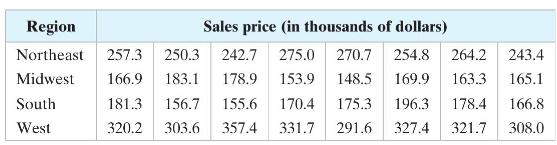
The table shows the sales prices for a random sample of apartment condominiums and cooperatives in four U.S. regions. At \(\alpha=0.01\), can you conclude that the distribution of the sales prices in at least one region is different from the others?(a) identify the claim and state \(H_{0}\) and
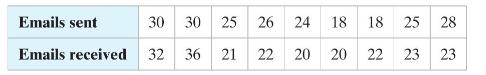
The table shows the numbers of emails sent and the numbers of emails received in a week for a random sample of nine people. At \(\alpha=0.01\), can you conclude that there is a significant correlation between the number of emails sent and the number of emails received?(a) identify the claim and
A meteorologist wants to determine whether days with rain occur randomly in April in his hometown. To do so, the meteorologist records whether it rains for each day in April. The results are shown, where \(R\) represents a day with rain and \(N\) represents a day with no rain. At \(\alpha=0.05\),
The mayor called on council members at a town meeting in the sequence shown, where \(R\) represents a Republican council member and \(D\) represents a Democrat council member. At \(\alpha=0.05\), can you conclude that the selection of members was not random?(a) identify the claim and state
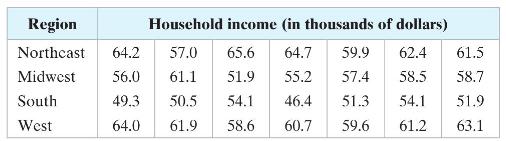
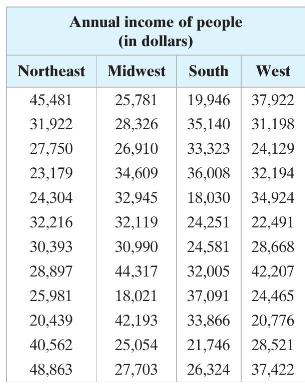
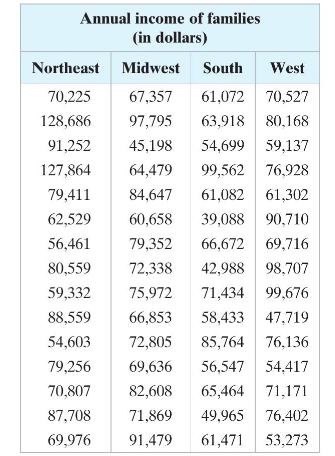
An employment agency representative wants to determine whether there is a difference in the annual household incomes in four regions of the United States. The representative randomly selects several households in each region and records the annual household income for each. The table shows the
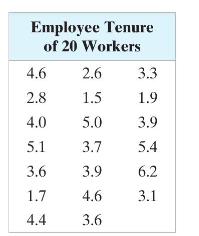
An investment company claims that the median age of people with mutual funds is 51 years. The ages (in years) of 20 randomly selected mutual fund owners are listed below. At \(\alpha=0.01\), is there enough evidence to reject the company's claim?(a) identify the claim and state \(H_{0}\) and
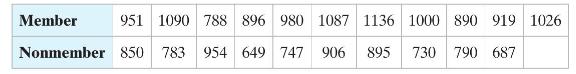
An employment agency claims that there is a difference in the weekly earnings of workers who are union members and workers who are not union members. The table shows the weekly earnings (in dollars) for a random sample of nine union members and eight nonunion members. At \(\alpha=0.05\), can you
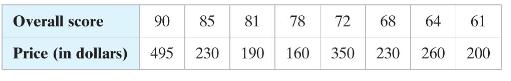
The table shows the overall scores and the prices for a random sample of eight different suitcases. The overall score represents the ease of use, features, construction, and durability of a suitcase. At \(\alpha=0.05\), can you conclude that there is a significant correlation between the overall
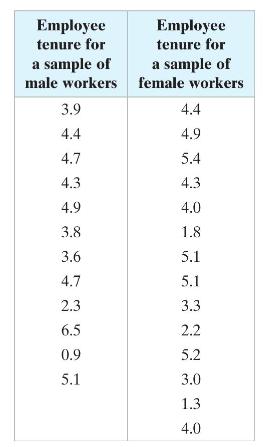
In a recent year, according to the Bureau of Labor Statistics, the median number of years that wage and salary workers had been with their current employer (called employee tenure) was 4.2 years. Information on employee tenure has been gathered since 1996 using the Current Population Survey (CPS),
The National Bureau of Economic Research (NBER) is a private, nonprofit, nonpartisan research organization. The NBER provides information for better understanding of how the U.S. economy works. Researchers at the NBER concentrate on four types of empirical research: developing new statistical
The heights (in inches) of 12 randomly selected current National Basketball Association players are listed. Use technology to construct a normal probability plot to determine whether the data come from a population that has a normal distribution. 74 69 78 75 73 71 80 82 81 76 86 77
In a normal probability plot, what is usually plotted along the horizontal axis? What is usually plotted along the vertical axis?
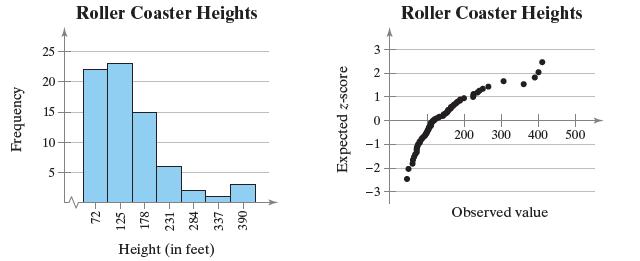
Use the histogram and normal probability plot to determine whether the data come from a normal distribution.Explain your reasoning. Frequency 25 20 20 15 10 5 Roller Coaster Heights Height (in feet) Expected z-score 3 2 7 2 1 Roller Coaster Heights 200 300 400 500 Observed value
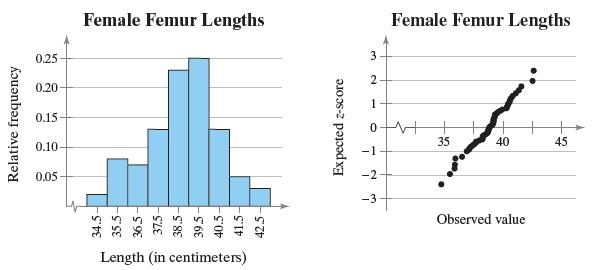
Use the histogram and normal probability plot to determine whether the data come from a normal distribution.Explain your reasoning. Relative frequency 0.25 0.20 0.15 0.10 0.05 34.5- 35.5- 36.5- 37.5- 38.5- 39.5- Female Femur Lengths 40.5- Length (in centimeters) 41.5- 42.5 Expected z-score -1 -2 -3
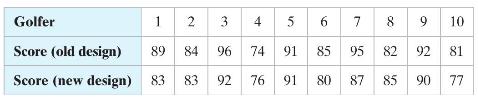
A golf club manufacturer claims that golfers can lower their scores by using the manufacturer's newly designed golf clubs. The table shows the scores of 10 golfers while using the old design and while using the new design on the same golf course. At \(\alpha=0.05\), can you support the
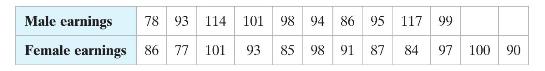
The table shows the earnings (in thousands of dollars) of a random sample of 10 male and 12 female pharmaceutical sales representatives. At \(\alpha=0.10\), can you conclude that there is a difference between the males' and females' earnings? Male earnings 78 93 114 101 98 94 86 95 117 99 Female
One-Way Analysis of Variance (ANOVA) ANOVA can help you make important decisions about the allocation of resources. For instance, suppose you work for a large manufacturing company and part of your responsibility is to determine the distribution of the company's sales throughout the world and
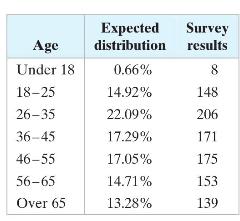
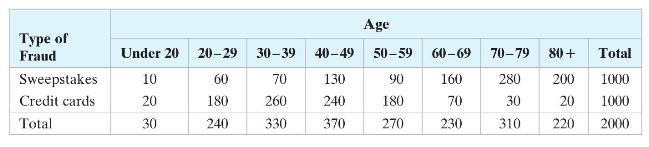
Fraud.org was created by the National Consumers League (NCL) to combat the growing problem of telemarketing and Internet fraud by improving prevention and enforcement. NCL works to protect and promote social and economic justice for consumers and workers in the United States and abroad.You work for
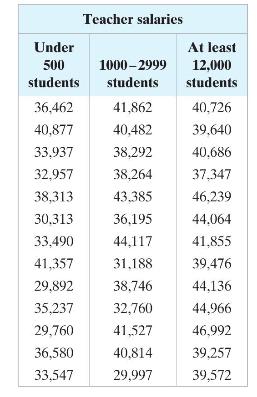
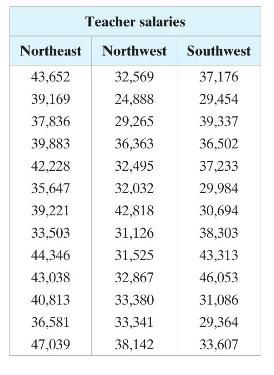
The Illinois State Board of Education conducts an annual study of the salaries of Illinois teachers. The study looks at how teachers' salaries are distributed based on factors such as degree and experience level, district size, and geographic region.The table shows the beginning salaries of a
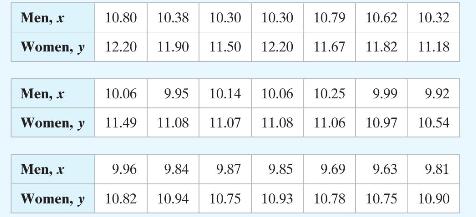
The table below shows the winning times (in seconds) for the men's and women's 100-meter runs in the Summer Olympics from 1928 to 2016.(a) Display the data in a scatter plot, calculate the correlation coefficient \(r\), and describe the type of correlation.(b) At \(\alpha=0.05\), is there enough
The table at the right shows the residential natural gas expenditures (in dollars) in one year for a random sample of households in four regions of the United States. Assume that the populations are normally distributed and the population variances are equal. At \(\alpha=0.10\), can you reject the
The equation used to predict the annual sweet potato yield (in pounds per acre) is \(\hat{y}=16,212-0.227 x_{1}+0.212 x_{2}\), where \(x_{1}\) is the number of acres planted and \(x_{2}\) is the number of acres harvested. Use the multiple regression equation to predict the annual sweet potato
A school administrator claims that the standard deviations of reading test scores for eighth-grade students are the same in Colorado and Utah. A random sample of 16 test scores from Colorado has a standard deviation of 34.6 points, and a random sample of 15 test scores from Utah has a standard
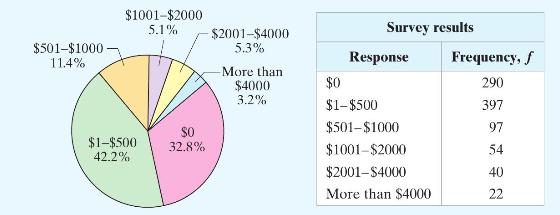
A researcher claims that the credit card debts of college students are distributed as shown in the pie chart. You randomly select 900 college students and record the credit card debt of each. The table shows the results. At \(\alpha=0.05\), test the researcher's claim. $501-$1000 11.4% $1001-$2000
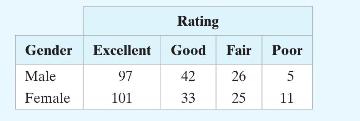
The contingency table shows how a random sample of adults rated a newly released movie and gender. At \(\alpha=0.05\), can you conclude that the adults' ratings are related to gender? Rating Gender Excellent Good Fair Poor Male 97 42 26 in 5 Female 101 33 25 11
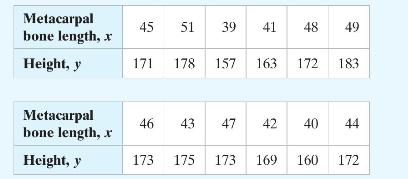
The table shows the metacarpal bone lengths (in centimeters) and the heights (in centimeters) of 12 adults. The equation of the regression line is \(\hat{y}=1.707 x+94.380\). Metacarpal 45 51 39 41 48 49 bone length, x Height, y 171 178 157 163 172 183 Metacarpal 46 43 47 42 40 44 bone length, x
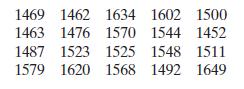
A website administrator for a company claims that the median number of visitors per day to the company’s website is no more than 1500. An employee doubts the accuracy of this claim. The numbers of visitors per day for 20 randomly selected days are listed below. At α = 0.05, can the employee
An organization claims that the median annual attendance for museums in the United States is at least 39,000. A random sample of 125 museums reveals that the annual attendances for 79 museums were less than 39,000, the annual attendances for 42 museums were more than 39,000, and the annual
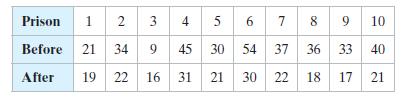
A psychologist claims that the number of repeat offenders will decrease when first-time offenders complete a particular rehabilitation course. You randomly select 10 prisons and record the number of repeat offenders during a two-year period. Then, after first-time offenders complete the course, you
What is a nonparametric test? How does a nonparametric test differ from a parametric test? What are the advantages and disadvantages of using a nonparametric test?
When the sign test is used, what population parameter is being tested?
Describe the test statistic for the sign test when the sample size \(n\) is less than or equal to 25 and when \(n\) is greater than 25 .
In your own words, explain why the hypothesis test discussed in this section is called the sign test.
Explain how to use the sign test to test a population median.
List the two conditions that must be met in order to use the paired-sample sign test.
A financial service accountant claims that the median credit card balance of college students is more than \(\$ 300\). You randomly select the credit card accounts of 12 college students and record the balance for each account. The balances (in dollars) are listed below. At \(\alpha=0.01\), can you
A meteorologist claims that the median daily high temperature for the month of July in Pittsburgh is \(83^{\circ}\) Fahrenheit. The high temperatures (in degrees Fahrenheit) for 15 randomly selected July days in Pittsburgh are listed below. At \(\alpha=0.01\), is there enough evidence to reject the
A real estate agent claims that the median sales price of new privately owned one-family homes sold in a recent month is \(\$ 253,000\) or less. The sales prices (in dollars) of 10 randomly selected homes are listed below. At \(\alpha=0.05\), is there enough evidence to reject the agent's claim?
During a weather report, a meteorologist claims that the median daily high temperature for the month of January in San Diego is \(66^{\circ}\) Fahrenheit. The high temperatures (in degrees Fahrenheit) for 16 randomly selected January days in San Diego are listed below. At \(\alpha=0.01\), can you
A financial services institution claims that the median amount of credit card debt for families holding such debts is at least \(\$ 2300\). In a random sample of 104 families with credit card debt, the debts of 60 families were less than \(\$ 2300\) and the debts of 44 families were greater than
Showing 500 - 600
of 1977
1
2
3
4
5
6
7
8
9
10
11
12
13
14
15
Last
Step by Step Answers