New Semester
Started
Get
50% OFF
Study Help!
--h --m --s
Claim Now
Question Answers
Textbooks
Find textbooks, questions and answers
Oops, something went wrong!
Change your search query and then try again
S
Books
FREE
Study Help
Expert Questions
Accounting
General Management
Mathematics
Finance
Organizational Behaviour
Law
Physics
Operating System
Management Leadership
Sociology
Programming
Marketing
Database
Computer Network
Economics
Textbooks Solutions
Accounting
Managerial Accounting
Management Leadership
Cost Accounting
Statistics
Business Law
Corporate Finance
Finance
Economics
Auditing
Tutors
Online Tutors
Find a Tutor
Hire a Tutor
Become a Tutor
AI Tutor
AI Study Planner
NEW
Sell Books
Search
Search
Sign In
Register
study help
statistics
elementary statistics in social research
Elementary Statistics Picturing The World 7th Global Edition Betsy Farber, Ron Larson - Solutions
Use the data in Example 1 to construct a 95% confidence interval for the population proportion of U.S. adults who use Facebook.Data from Example 1In a survey of 1550 U.S. adults, 1054 said that they use the social media website Facebook. Find a point estimate for the population proportion of U.S.
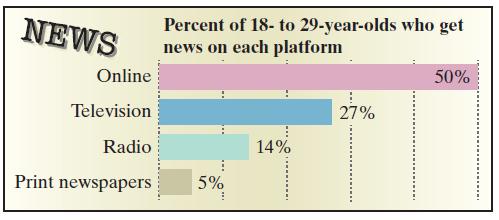
The figure below is from a survey of 800 U.S. adults ages 18 to 29. Construct a 99% confidence interval for the population proportion of 18-to 29-year-olds who get their news on television. NEWS Online Television Radio Print newspapers Percent of 18- to 29-year-olds who get news on each platform
You are running a political campaign and wish to estimate, with 95% confidence, the population proportion of registered voters who will vote for your candidate.Your estimate must be accurate within 3% of the population proportion. Find the minimum sample size needed when (1) no preliminary
A survey of adults in the United States found that 61% ate at a restaurant at least once in the past week. You randomly select 30 adults and ask them whether they ate at a restaurant at least once in the past week.(a) Verify that a normal distribution can be used to approximate the binomial
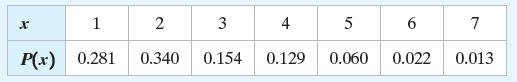
The table shows the distribution of household sizes in the United States for a recent year.Find the(a) mean,(b) variance,(c) standard deviation, and(d) expected value of the probability distribution. Interpret the results. x 1 2 3 4 5 6 7 P(x) 0.281 0.340 0.154 0.129 0.060 0.022 0.013
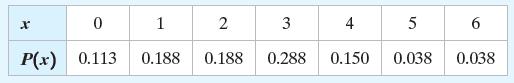
The table shows the distribution of personal fouls per game for Garrett Temple in a recent NBA season.Find the(a) mean,(b) variance,(c) standard deviation, and(d) expected value of the probability distribution. Interpret the results. x 0 1 2 3 4 5 6 P(x) 0.113 0.188 0.188 0.288 0.150 0.038 0.038
Use the probability distribution in Exercise 3 to find the probability of randomly selecting a game in which Garrett Temple had(a) fewer than four personal fouls,(b) at least three personal fouls, and(c) between two and four personal fouls, inclusive.Data from Exercises 3The table shows the
From a pool of 16 candidates, 9 men and 7 women, the offices of president, vice president, secretary, and treasurer will be filled. (a) In how many different ways can the offices be filled? (b) What is the probability that all four of the offices are filled by women?
To the left of z = 0.72 Find the indicated area under the standard normal curve. If convenient, use technology to find the area.
To the left of z = –3.08 Find the indicated area under the standard normal curve. If convenient, use technology to find the area.
To the right of z = –0.84 Find the indicated area under the standard normal curve. If convenient, use technology to find the area.
Between z = 0 and z = 2.95 Find the indicated area under the standard normal curve. If convenient, use technology to find the area.
Between z = -1.22 and z = -0.26 Find the indicated area under the standard normal curve. If convenient, use technology to find the area.
To the left of z = 0.12 or to the right of z = 1.72 Find the indicated area under the standard normal curve. If convenient, use technology to find the area.
Twenty-eight percent of U.S. adults think that climate scientists understand the causes of climate change very well. You randomly select 25 U.S. adults.Find the probability that the number of U.S. adults who think that climate scientists understand the causes of climate change very well is (a)
An auto parts seller finds that 1 in every 200 parts sold is defective. Use the geometric distribution to find the probability that (a) the first defective part is the fifth part sold, (b) the first defective part is the first, second, or third part sold, and (c) none of the first 20 parts sold are
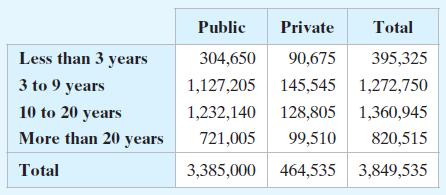
The table shows the results of a survey in which 3,405,100 public and 489,900 private school teachers were asked about their full-time teaching experience.(a) Find the probability that a randomly selected private school teacher has 10 to 20 years of full-time teaching experience.(b) Find the
The initial pressures for bicycle tires when first filled are normally distributed, with a mean of 70 pounds per square inch (psi) and a standard deviation of 1.2 psi.(a) Random samples of size 40 are drawn from this population, and the mean of each sample is determined. Find the mean and standard
The life spans of car batteries are normally distributed, with a mean of 44 months and a standard deviation of 5 months.(a) Find the probability that the life span of a randomly selected battery is less than 36 months.(b) Find the probability that the life span of a randomly selected battery is
A florist has 12 different flowers from which floral arrangements can be made. A centerpiece is made using four different flowers. (a) How many different centerpieces can be made? (b) What is the probability that the four flowers in the centerpiece are roses, daisies, hydrangeas, and lilies?
Seventy percent of U.S. adults anticipate major cyberattacks on public infrastructure in the next five years. You randomly select 10 U.S. adults.(a) Construct a binomial distribution for the random variable x, the number of U.S. adults who anticipate major cyberattacks on public infrastructure in
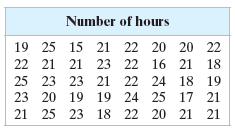
A researcher is collecting data about a college athletic conference and its student-athletes. A random sample of 40 student-athletes is selected and their numbers of hours spent on required athletic activities for one week are recorded (see table at left). Find a point estimate for the population
Use the data in Example 1 and a 95% confidence level to find the margin of error for the mean number of hours spent on required athletic activities by all student-athletes in the conference. Assume the population standard deviation is 2.3 hours.Data from Example 1A researcher is collecting data
Use the data in Example 1 to construct a 95% confidence interval for the mean number of hours spent on required athletic activities by all student-athletes in the conference.Data from Example 1A researcher is collecting data about a college athletic conference and its student-athletes. A random
Use the data in Example 1 and technology to construct a 99% confidence interval for the mean number of hours spent on required athletic activities by all student-athletes in the conference.Data from Example 1A researcher is collecting data about a college athletic conference and its
A college admissions director wishes to estimate the mean age of all students currently enrolled. In a random sample of 20 students, the mean age is found to be 22.9 years. From past studies, the standard deviation is known to be 1.5 years, and the population is normally distributed. Construct a
The researcher in Example 1 wants to estimate the mean number of hours spent on required athletic activities by all student-athletes in the conference.How many student-athletes must be included in the sample to be 95%confident that the sample mean is within 0.5 hour of the population mean?Data from
Find each probability using the standard normal distribution.(a) \(P(z>-1.68)\)(b) \(P(z
The random variable \(x\) is normally distributed with the given parameters. Find each probability.(a) \(\mu=9.2, \sigma \approx 1.62, P(x40.5)\)(c) \(\mu=5.5, \sigma \approx 0.08, P(5.36
Find the probability that a randomly selected person has an IQ score higher than 125.Is this an unusual event? Explain.In a standardized IQ test, scores are normally distributed, with a mean score of 100 and a standardized deviation of 15.
Find the probability that a randomly selected person has an IQ score between 95 and 105.Is this an unusual event? Explain.In a standardized IQ test, scores are normally distributed, with a mean score of 100 and a standardized deviation of 15.
What percent of the IQ scores are greater than 112 ?In a standardized IQ test, scores are normally distributed, with a mean score of 100 and a standardized deviation of 15.
Out of 2000 randomly selected people, about how many would you expect to have IQ scores less than 90 ?In a standardized IQ test, scores are normally distributed, with a mean score of 100 and a standardized deviation of 15.
What is the lowest score that would still place a person in the top \(5 \%\) of the scores?In a standardized IQ test, scores are normally distributed, with a mean score of 100 and a standardized deviation of 15.
What is the highest score that would still place a person in the bottom \(10 \%\) of the scores?In a standardized IQ test, scores are normally distributed, with a mean score of 100 and a standardized deviation of 15.
A random sample of 60 people is selected from this population. What is the probability that the mean IQ score of the sample is greater than 105 ? Interpret the result.In a standardized IQ test, scores are normally distributed, with a mean score of 100 and a standardized deviation of 15.
Are you more likely to randomly select one person with an IQ score greater than 105 or are you more likely to randomly select a sample of 15 people with a mean IQ score greater than 105? Explain.In a standardized IQ test, scores are normally distributed, with a mean score of 100 and a standardized
Determine whether you can use a normal distribution to approximate the binomial distribution. If you can, find the mean and standard deviation. If you cannot, explain why.In a survey of U.S. adults, 16% say they have had someone take over their email accounts without their permission. You randomly
Find the probability that the number of U.S. adults who say they have had someone take over their email accounts without their permission is (a) at most 40, (b) less than 45, and (c) exactly 48.Identify any unusual events. Explain.In a survey of U.S. adults, 16% say they have had someone take over
1. Find the z-score that corresponds to a cumulative area of 0.3632.2. Find the z-score that has 10.75% of the distribution’s area to its right.
Find the z-score that corresponds to each percentile.1. P5 2. P50 3. P90
A veterinarian records the weights of cats treated at a clinic. The weights are normally distributed, with a mean of 9 pounds and a standard deviation of 2 pounds. Find the weight x corresponding to each z-score. Interpret the results.1. z = 1.96 2. z = –0.44 3. z = 0
Scores for the California Peace Officer Standards and Training test are normally distributed, with a mean of 50 and a standard deviation of 10. An agency will only hire applicants with scores in the top 10%. What is the lowest score an applicant can earn and still be eligible to be hired by the
In a randomly selected sample of women ages 20 –34, the mean total cholesterol level is 179 milligrams per deciliter with a standard deviation of 38.9 milligrams per deciliter. Assume the total cholesterol levels are normally distributed. Find the highest total cholesterol level a woman in this
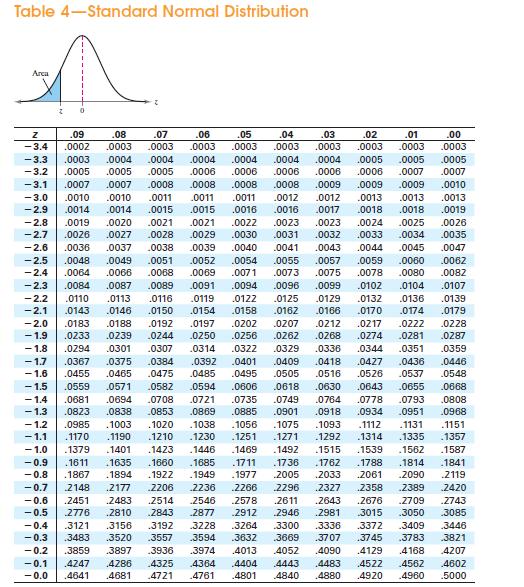
0.8365 Use the Standard Normal Table or technology to find the z-score that corresponds to the cumulative area or percentile. Table 4-Standard Normal Distribution Arca Z 0 Z .09 .08 .07 .06 .05 .04 .03 .02 .01 .00 -3.4 .0002 .0003 .0003 .0003 .0003 .0003 .0003 .0003 .0003 .0003 -3.3 .0003 .0004
0.7357 Use the Standard Normal Table or technology to find the z-score that corresponds to the cumulative area or percentile. Table 4-Standard Normal Distribution Arca Z 0 Z .09 .08 .07 .06 .05 .04 .03 .02 .01 .00 -3.4 .0002 .0003 .0003 .0003 .0003 .0003 .0003 .0003 .0003 .0003 -3.3 .0003 .0004
0.063 Use the Standard Normal Table or technology to find the z-score that corresponds to the cumulative area or percentile. Table 4-Standard Normal Distribution Arca Z 0 Z .09 .08 .07 .06 .05 .04 .03 .02 .01 .00 -3.4 .0002 .0003 .0003 .0003 .0003 .0003 .0003 .0003 .0003 .0003 -3.3 .0003 .0004
0.3409 Use the Standard Normal Table or technology to find the z-score that corresponds to the cumulative area or percentile. Table 4-Standard Normal Distribution Arca Z 0 Z .09 .08 .07 .06 .05 .04 .03 .02 .01 .00 -3.4 .0002 .0003 .0003 .0003 .0003 .0003 .0003 .0003 .0003 .0003 -3.3 .0003 .0004
0.0284 Use the Standard Normal Table or technology to find the z-score that corresponds to the cumulative area or percentile. Table 4-Standard Normal Distribution Arca Z 0 Z .09 .08 .07 .06 .05 .04 .03 .02 .01 .00 -3.4 .0002 .0003 .0003 .0003 .0003 .0003 .0003 .0003 .0003 .0003 -3.3 .0003 .0004
0.81 Use the Standard Normal Table or technology to find the z-score that corresponds to the cumulative area or percentile. Table 4-Standard Normal Distribution Arca Z 0 Z .09 .08 .07 .06 .05 .04 .03 .02 .01 .00 -3.4 .0002 .0003 .0003 .0003 .0003 .0003 .0003 .0003 .0003 .0003 -3.3 .0003 .0004
0.8859 Use the Standard Normal Table or technology to find the z-score that corresponds to the cumulative area or percentile. Table 4-Standard Normal Distribution Arca Z 0 Z .09 .08 .07 .06 .05 .04 .03 .02 .01 .00 -3.4 .0002 .0003 .0003 .0003 .0003 .0003 .0003 .0003 .0003 .0003 -3.3 .0003 .0004
0.0156 Use the Standard Normal Table or technology to find the z-score that corresponds to the cumulative area or percentile. Table 4-Standard Normal Distribution Arca Z 0 Z .09 .08 .07 .06 .05 .04 .03 .02 .01 .00 -3.4 .0002 .0003 .0003 .0003 .0003 .0003 .0003 .0003 .0003 .0003 -3.3 .0003 .0004
P20 Use the Standard Normal Table or technology to find the z-score that corresponds to the cumulative area or percentile. Table 4-Standard Normal Distribution Arca Z 0 Z .09 .08 .07 .06 .05 .04 .03 .02 .01 .00 -3.4 .0002 .0003 .0003 .0003 .0003 .0003 .0003 .0003 .0003 .0003 -3.3 .0003 .0004 .0004
P45 Use the Standard Normal Table or technology to find the z-score that corresponds to the cumulative area or percentile. Table 4-Standard Normal Distribution Arca Z 0 Z .09 .08 .07 .06 .05 .04 .03 .02 .01 .00 -3.4 .0002 .0003 .0003 .0003 .0003 .0003 .0003 .0003 .0003 .0003 -3.3 .0003 .0004 .0004
P95 Use the Standard Normal Table or technology to find the z-score that corresponds to the cumulative area or percentile. Table 4-Standard Normal Distribution Arca Z 0 Z .09 .08 .07 .06 .05 .04 .03 .02 .01 .00 -3.4 .0002 .0003 .0003 .0003 .0003 .0003 .0003 .0003 .0003 .0003 -3.3 .0003 .0004 .0004
P70 Use the Standard Normal Table or technology to find the z-score that corresponds to the cumulative area or percentile. Table 4-Standard Normal Distribution Arca Z 0 Z .09 .08 .07 .06 .05 .04 .03 .02 .01 .00 -3.4 .0002 .0003 .0003 .0003 .0003 .0003 .0003 .0003 .0003 .0003 -3.3 .0003 .0004 .0004
P8 Use the Standard Normal Table or technology to find the z-score that corresponds to the cumulative area or percentile. Table 4-Standard Normal Distribution Arca Z 0 Z .09 .08 .07 .06 .05 .04 .03 .02 .01 .00 -3.4 .0002 .0003 .0003 .0003 .0003 .0003 .0003 .0003 .0003 .0003 -3.3 .0003 .0004 .0004
P46 Use the Standard Normal Table or technology to find the z-score that corresponds to the cumulative area or percentile. Table 4-Standard Normal Distribution Arca Z 0 Z .09 .08 .07 .06 .05 .04 .03 .02 .01 .00 -3.4 .0002 .0003 .0003 .0003 .0003 .0003 .0003 .0003 .0003 .0003 -3.3 .0003 .0004 .0004
P83 Use the Standard Normal Table or technology to find the z-score that corresponds to the cumulative area or percentile. Table 4-Standard Normal Distribution Arca Z 0 Z .09 .08 .07 .06 .05 .04 .03 .02 .01 .00 -3.4 .0002 .0003 .0003 .0003 .0003 .0003 .0003 .0003 .0003 .0003 -3.3 .0003 .0004 .0004
P55 Use the Standard Normal Table or technology to find the z-score that corresponds to the cumulative area or percentile. Table 4-Standard Normal Distribution Arca Z 0 Z .09 .08 .07 .06 .05 .04 .03 .02 .01 .00 -3.4 .0002 .0003 .0003 .0003 .0003 .0003 .0003 .0003 .0003 .0003 -3.3 .0003 .0004 .0004
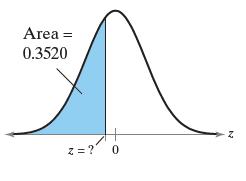
Find the indicated z-score(s) shown in the graph. Area = 0.3520 z = ? 0 Z
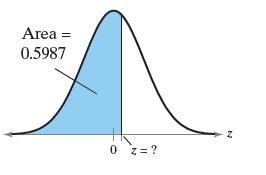
.Find the indicated z-score(s) shown in the graph. Area = 0.5987 0 z = ? Z
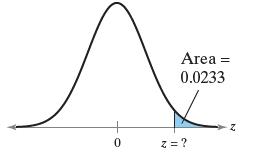
Find the indicated z-score(s) shown in the graph. Area = 0.0233 0 z = ? Z
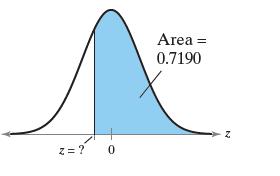
Find the indicated z-score(s) shown in the graph. z = ? 0 Area = 0.7190
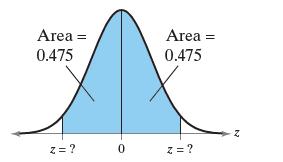
Find the indicated z-score(s) shown in the graph. Area = 0.475 Area = 0.475 z = ? 0 z = ? Z
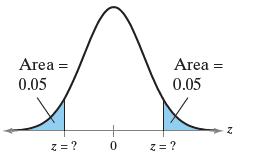
Find the indicated z-score(s) shown in the graph. Area = 0.05 Area = 0.05 z = ? 0 z=? Z
Find the z-score that has 15.6% of the distribution’s area to its right.Find the indicated z-score.
Find the z-score that has 88.9% of the distribution’s area to its right.Find the indicated z-score.
Find the z-score that has 43.5% of the distribution’s area to its left.Find the indicated z-score.
Find the z-score that has 31.5% of the distribution’s area to its left.Find the indicated z-score.
Find the z-score that has 4.887% of the distribution’s area to its right.Find the indicated z-score.
Find the z-score that has 93.1865% of the distribution’s area to its left.Find the indicated z-score.
Find the positive z-score for which 70% of the distribution’s area lies between -z and z.Find the indicated z-score.
Find the positive z-score for which 15% of the distribution’s area lies between -z and z.Find the indicated z-score.
In a survey of South African CEOs, the mean annual income was \($7.14\) million with a standard deviation of \($0.5\) million. What income represents the 90th percentile?(a) What income represents the 32nd percentile?(b) What income represents the third quartile?Answer the questions about the
The red blood cell counts (in grams per deciliter) for a population of adult females can be approximated by a normal distribution, with a mean of 13.5 grams per deciliter and a standard deviation of 0.5 grams per deciliter.(a) What is the minimum red blood cell count that can be in the top 15% of
The life span (in kilometers) for a population of a new brand of tires can be approximated by a normal distribution, with a mean of 80,000 kilometers and a standard deviation of 1,500 kilometers.(a) What is the minimum life span that can be in the top 20% of life spans?(b) What is the maximum life
The weights of bags of baby corns are normally distributed, with a mean of 500 grams and a standard deviation of 25 grams.Bags in the upper 2% are too heavy and must be repackaged. What is the most a bag of baby corns can weigh and not need to be repackaged?
You sell a brand of thermostat that has a life expectancy that is normally distributed, with a mean life of 8.5 years and a standard deviation of 0.75 years. You want to give a guarantee for free replacement of thermostats that do not work well. You are willing to replace approximately 15% of the
The number of times four people go grocery shopping in a month is given by the population values 51, 3, 5, 76. A probability histogram for the data is shown at the left. You randomly choose two of the four people, with replacement. List all possible samples of size n = 2 and calculate the mean of
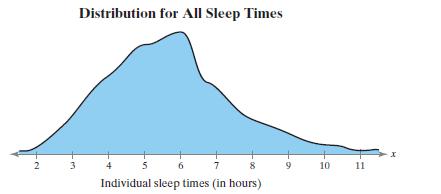
A study analyzed the sleep habits of college students. The study found that the mean sleep time was 6.8 hours, with a standard deviation of 1.4 hours. Random samples of 100 sleep times are drawn from this population, and the mean of each sample is determined. Find the mean and standard deviation of
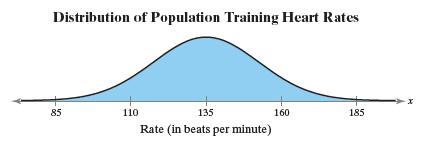
Assume the training heart rates of all 20-year-old athletes are normally distributed, with a mean of 135 beats per minute and a standard deviation of 18 beats per minute, as shown in the figure. Random samples of size 4 are drawn from this population, and the mean of each sample is determined. Find
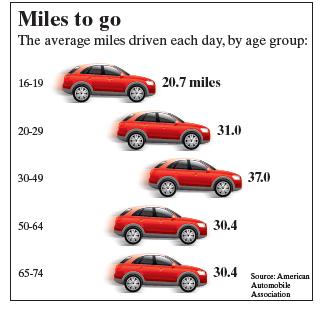
The figure at the right shows the mean distances traveled by drivers each day. You randomly select 50 drivers ages 16 to 19. What is the probability that the mean distance traveled each day is between 19.4 and 22.5 miles?Assume σ = 6.5 miles. Miles to go The average miles driven each day, by age
The mean room and board expense per year at four-year colleges is \($10,453\).You randomly select 9 four-year colleges. What is the probability that the mean room and board is less than \($10,750?\) Assume that the room and board expenses are normally distributed with a standard deviation of
Some college students use credit cards to pay for school-related expenses. For this population, the amount paid is normally distributed, with a mean of \($1615\) and a standard deviation of \($550\). 1. What is the probability that a randomly selected college student, who uses a credit card to pay
μ = 225, σ = 40, n = 75 A population has a mean μ and a standard deviation σ. Find the mean and standard deviation of the sampling distribution of sample means with sample size n.
μ = 99, σ = 12, n = 225 A population has a mean μ and a standard deviation σ. Find the mean and standard deviation of the sampling distribution of sample means with sample size n.
μ = 1022, σ = 144, n = 360 A population has a mean μ and a standard deviation σ. Find the mean and standard deviation of the sampling distribution of sample means with sample size n.
μ = 4848, σ = 24, n = 1200 A population has a mean μ and a standard deviation σ. Find the mean and standard deviation of the sampling distribution of sample means with sample size n.
For a random sample of n = 49, find the probability of a sample mean being less than 37.2 when μ = 38 and σ = 2.17.The population mean and standard deviation are given. Find the indicated probability and determine whether the given sample mean would be considered unusual.
For a random sample of n = 225, find the probability of a sample mean being greater than 37.2 when μ = 38 and σ = 2.17.The population mean and standard deviation are given. Find the indicated probability and determine whether the given sample mean would be considered unusual.
For a random sample of n = 60, find the probability of a sample mean being greater than 132 when μ = 130 and σ = 16.1.The population mean and standard deviation are given. Find the indicated probability and determine whether the given sample mean would be considered unusual.
For a random sample of n = 25, find the probability of a sample mean being less than 100 or greater than 102 when μ = 100 and σ = 4.5.The population mean and standard deviation are given. Find the indicated probability and determine whether the given sample mean would be considered unusual.
Repeat Exercise 20 for samples of size 18 and 12.What happens to the mean and the standard deviation of the distribution of sample means as the sample size decreases?Data from Exercises 20The scores for females on the critical reading portion of the SAT in 2016 are normally distributed, with a mean
A machine is set to fill paint cans with a mean of 5 kilograms and a standard deviation of 0.02 kilograms. A random sample of 75 cans has a mean of 4.99 kilograms. The machine needs to be reset when the mean of a random sample is unusual. Does the machine need to be reset? Explain.
Chocolate Cookies A machine is set to pack chocolate cookies with a mean of 125 grams and a standard deviation of 4 grams. A random sample of 16 packs has a mean of 125.5 grams. The machine needs to be reset when the mean of a random sample is unusual. Does the machine need to be reset? Explain.
Cloth Cutter The lengths of cloth a machine cuts for making dresses are normally distributed, with a mean of 3 meters and a standard deviation of 0.25 meters.(a) What is the probability that a randomly selected cloth cut by the machine has a length greater than 3.2 meters?(b) You randomly select 60
Muffins The weights of muffin cartons are normally distributed with a mean weight of 1.25 kilograms and a standard deviation of 0.1 kilograms.(a) What is the probability that a randomly selected carton has a weight greater than 1.3 kilograms?(b) You randomly select 100 cartons. What is the
Two binomial experiments are listed. Determine whether you can use a normal distribution to approximate the distribution of x, the number of people who reply yes. If you can, find the mean and standard deviation. If you cannot, explain why.1. In a survey of 8- to 18-year-old heavy media users in
Use a continuity correction to convert each binomial probability to a normal distribution probability.1. The probability of getting between 270 and 310 successes, inclusive 2. The probability of getting at least 158 successes 3. The probability of getting fewer than 63 successes
Showing 900 - 1000
of 1977
First
3
4
5
6
7
8
9
10
11
12
13
14
15
16
17
Last
Step by Step Answers