New Semester
Started
Get
50% OFF
Study Help!
--h --m --s
Claim Now
Question Answers
Textbooks
Find textbooks, questions and answers
Oops, something went wrong!
Change your search query and then try again
S
Books
FREE
Study Help
Expert Questions
Accounting
General Management
Mathematics
Finance
Organizational Behaviour
Law
Physics
Operating System
Management Leadership
Sociology
Programming
Marketing
Database
Computer Network
Economics
Textbooks Solutions
Accounting
Managerial Accounting
Management Leadership
Cost Accounting
Statistics
Business Law
Corporate Finance
Finance
Economics
Auditing
Tutors
Online Tutors
Find a Tutor
Hire a Tutor
Become a Tutor
AI Tutor
AI Study Planner
NEW
Sell Books
Search
Search
Sign In
Register
study help
statistics
elementary statistics in social research
Elementary Statistics Picturing The World 8th Edition Ron Larson - Solutions
\({ }_{7} C_{5}={ }_{7} C_{2}\)In Exercises 3– 6, determine whether the statement is true or false. If it is false, rewrite it as a true statement.
There are 72 runners in a 10-kilometer race. How many ways can the runners finish first, second, and third?
A band is preparing a setlist of 21 songs for a concert. How many different ways can the band play the first six songs?
A researcher is randomly selecting a treatment group of 10 human subjects from a group of 20 people taking part in an experiment.In how many different ways can the treatment group be selected?
The Saratoga Springs, New York, Zoning Board of Appeals has seven members. One member serves as board chair and another serves as vice chair. Given the names of the seven board members, what is the probability of randomly selecting the name of the chair and the name of the vice chair?
The University of Colorado Board of Directors has 23 members. One member serves as board chair and another serves as vice chair. Given the names of the 23 board members, what is the probability of randomly selecting the name of the chair and the name of the vice chair?
A horse race has 10 entries. Given no information about the horses or jockeys, what is the probability of randomly selecting (in no particular order) the first three horses to finish the race?
You choose two music listeners at random. What is the probability that both say their primary source for new music is someone’s playlist?In Exercises 45 – 48, use the pie chart, which shows the results of a survey of 513 music listeners who were asked about their primary source for new music.
You choose three music listeners at random. What is the probability that all three say their primary source for new music is subscription music services?In Exercises 45 – 48, use the pie chart, which shows the results of a survey of 513 music listeners who were asked about their primary source
You choose nine music listeners at random. What is the probability that none of them say their primary source for new music is friends or social media?In Exercises 45 – 48, use the pie chart, which shows the results of a survey of 513 music listeners who were asked about their primary source for
You choose five music listeners at random. What is the probability that none of them say their primary source for new music is personal search?In Exercises 45 – 48, use the pie chart, which shows the results of a survey of 513 music listeners who were asked about their primary source for new
A company has 200 employees, consisting of 144 women and 56 men. The company wants to select five employees to serve as an investment committee.(a) Use technology to find the number of ways that 5 employees can be selected from 200.(b) Use technology to find the number of ways that 5 employees can
Your roommate asks you to buy toothpaste and dental rinse but does not tell you which brands to get. The store has eight brands of toothpaste and five brands of dental rinse. What is the probability that you will purchase the correct brands of both products? Is this an unusual event? Explain.
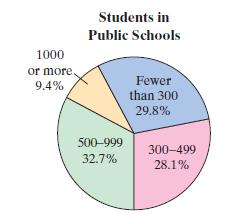
Find the probability of randomly selecting a school with fewer than 500 students.In Exercises 33 and 34, use the pie chart at the left, which shows the percent distribution of the number of students in U.S. public schools in a recent year. Students in Public Schools 1000 or more. Fewer 9.4% than
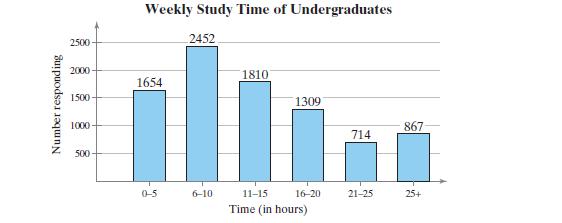
Find the probability of randomly selecting an undergraduate who studies more than 20 hours per week.In Exercises 35–38, the bar graph shows the results of a survey in which 8806 undergraduate students were asked how many hours they spend on studying and other academic activities outside of class
Find the probability of randomly selecting an undergraduate who studies less than 11 hours per week.In Exercises 35–38, the bar graph shows the results of a survey in which 8806 undergraduate students were asked how many hours they spend on studying and other academic activities outside of class
From a pool of 40 club members, the offices of president, vice president, secretary, and treasurer will be filled. In how many different ways can the offices be filled?
Your dorm enters 15 out of 65 plastic numbered ducks in a duck race. The ducks are all dumped into a stream and drift to the finish line. What is the probability that three of your dorm’s ducks finish first, second, and third?
Let x represent the populations of the 50 U.S. states.In Exercises 13–18, determine whether the random variable x is discrete or continuous. Explain.
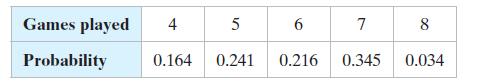
The number of games played in each World Series from 1903 through 2020In Exercises 29–34, (a) find the mean, variance, and standard deviation of the probability distribution, and (b) interpret the results. Games played Probability 4 5 6 7 8 0.164 0.241 0.216 0.345 0.034
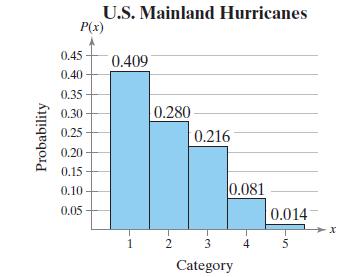
The histogram shows the distribution of hurricanes that have hit the U.S. mainland from 1851 through 2019 by Saffir-Simpson category, where 1 is the weakest level and 5 is the strongest level.In Exercises 29–34, (a) find the mean, variance, and standard deviation of the probability distribution,
Find the area of each bar of the histogram you made in Exercise 19.Then find the sum of the areas. Interpret the results.
Find the mean and standard deviation of the sum of their scores.Two random variables \(x\) and \(y\) are independent when the value of \(x\) does not affect the value of \(y\). When the variables are not independent, they are dependent. A new random variable can be formed by finding the sum or
Find the mean and standard deviation of the difference of their scores.Compare to your answers in Exercise 43.Two random variables \(x\) and \(y\) are independent when the value of \(x\) does not affect the value of \(y\). When the variables are not independent, they are dependent. A new random
A study was conducted to debunk the idea that abilities in music and math are related. Instead, the study showed a strong relationship between achievements in music and math.In Exercises 15–18, identify the two events described in the study. Do the results indicate that the events are independent
A study found no significant association between the use of talc powder and the incidence of ovarian cancer in women.In Exercises 15–18, identify the two events described in the study. Do the results indicate that the events are independent or dependent? Explain your reasoning.
A study found that business executives with high levels of self-leadership traits are more likely to attribute successes to their own efforts.In Exercises 15–18, identify the two events described in the study. Do the results indicate that the events are independent or dependent? Explain your
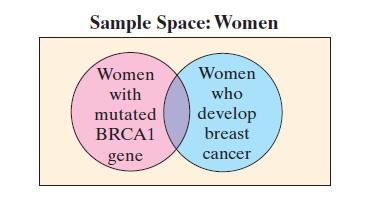
Research has shown that approximately 1 woman in 400 carries a mutation of the BRCA1 gene. About 64% of women with this mutation develop breast cancer. Find the probability that a randomly selected woman will carry the mutation of the BRCA1 gene and will develop breast cancer.In Exercises 19–32,
In a sample of 1103 probable voters, three out of four say they would like entertainers to address social and political issues. Two probable voters are selected at random.(a) Find the probability that both probable voters would like entertainers to address social and political issues.(b) Find the
In a sample of 11,771 children ages 2 to 17, 8% have lost a friend or relative to murder. Four children are selected at random.(a) Find the probability that all four have lost a friend or relative to murder.(b) Find the probability that none of the four has lost a friend or relative to murder.(c)
In a sample of 1500 adult U.S. citizens, 270 said that Barack Obama was the best president in U.S. history. Two adult U.S. citizens are selected at random.(a) Find the probability that both adult U.S. citizens say that Barack Obama was the best president in U.S. history.(b) Find the probability
In a sample of 1500 adult U.S. citizens, 690 said that Donald Trump was the worst president in U.S. history. Three adult U.S.citizens are selected at random.(a) Find the probability that all three adult U.S. citizens say that Donald Trump was the worst president in U.S. history.(b) Find the
In a recent year, about 1.9% of all infants born in the U.S. were conceived through assisted reproductive technology (ART).Of the ART deliveries, about 26.4% resulted in multiple births.(a) Find the probability that a randomly selected infant was conceived through ART and was part of a multiple
According to a survey, 57.8% of college-seeking high school seniors say they have taken one of the standardized tests for potential college students. Of these, 35.6% say they do not plan to submit their score with their college applications.(a) Find the probability that a randomly selected
According to a survey of over 31,000 college-seeking high school seniors, 31.2% have never used social media to look up a college. Of those who have used social media to look up a college, 89% have used Instagram. Find the probability that a randomly selected college-seeking high school senior has
A patient has a 60% chance of surviving bypass surgery after a heart attack. If the patient survives the surgery, then the patient has a 70% chance of making a full recovery. Find the probability that the patient survives surgery but does not make a full recovery.
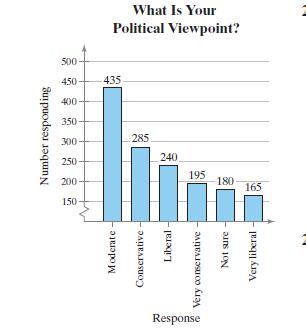
The responses of 1500 U.S. adults to a survey that asked them to state their own political viewpoints are shown in the Pareto chart. Find the probability of each event.(a) Randomly selecting a person from the sample who does not consider themselves liberal or very liberal (b) Randomly selecting a
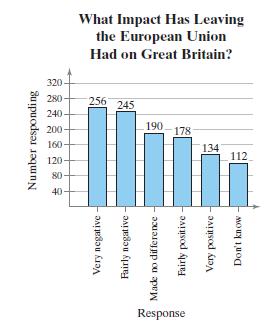
A survey asked 1115 British adults how Britain’s decision to leave the European Union has impacted the country. The results are shown in the Pareto chart. Find the probability of each event.(a) Randomly selecting a British adult who feels that the move has made no difference(b) Randomly selecting
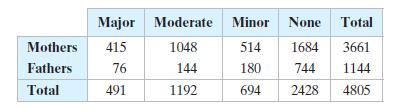
A survey asks 4805 parents the severity of the mental issues they experienced from the coronavirus pandemic. The results are shown in the table. A parent is randomly selected from the sample. Find the probability of each event.(a) The parent was unaffected mentally or is a father.(b) The parent had
\(P(A)=0.40, P(B)=0.10, P(C)=0.50\),\(P(A\) and \(B)=0.05, P(A\) and \(C)=0.25, P(B\) and \(C)=0.10\), \(P(A\) and \(B\) and \(C)=0.03\)The Addition Rule for the probability that event \(A\) or \(B\) or \(C\) will occur, \(P(A\) or \(B\) or \(C)\), is given by\[ \begin{aligned} P(A \text { or } B
\(P(A)=0.38, P(B)=0.26, P(C)=0.14\), \(P(A\) and \(B)=0.12, P(A\) and \(C)=0.03, P(B\) and \(C)=0.09\), \(P(A\) and \(B\) and \(C)=0.01\)The Addition Rule for the probability that event \(A\) or \(B\) or \(C\) will occur, \(P(A\) or \(B\) or \(C)\), is given by \[ \begin{aligned} P(A \text { or } B
18 to 24 years old In Exercises 49– 52, use the frequency distribution at the left, which shows the population of the United States by age group, to find the probability that a U.S. resident chosen at random is in the age range.
Event A: A randomly chosen resident of Ithaca is not 18 to 24 years old.The age distribution of the residents of Ithaca, New York, is shown at the left. In Exercises 59–62, find the probability of the event.
Event B: A randomly chosen resident of Ithaca is not 25 to 39 years old.The age distribution of the residents of Ithaca, New York, is shown at the left. In Exercises 59–62, find the probability of the event.
Event C: A randomly chosen resident of Ithaca is not less than 18 years old.The age distribution of the residents of Ithaca, New York, is shown at the left. In Exercises 59–62, find the probability of the event.
Event D: A randomly chosen resident of Ithaca is not 70 years old or older.The age distribution of the residents of Ithaca, New York, is shown at the left. In Exercises 59–62, find the probability of the event.
What is the probability that a voter from West Virginia chosen at random voted Republican in the 2020 governor’s election?
What is the probability that a registered voter in Texas chosen at random did not vote in the 2020 presidential election?
What is the probability that all three children are girls?In Exercises 71–74, a couple plans to have three children. Each child is equally likely to be a boy or a girl.
What is the probability that all three children are boys?In Exercises 71–74, a couple plans to have three children. Each child is equally likely to be a boy or a girl.
What is the probability that exactly one child is a girl?In Exercises 71–74, a couple plans to have three children. Each child is equally likely to be a boy or a girl.
What is the probability that at least one child is a boy?In Exercises 71–74, a couple plans to have three children. Each child is equally likely to be a boy or a girl.
A beverage company puts game pieces under the caps of its drinks and claims that one in six game pieces wins a prize. The official rules of the contest state that the odds of winning a prize are 1 : 6.Is the claim “one in six game pieces wins a prize” correct? Explain your reasoning.
The probability of winning an instant prize game is 1 /10.The odds of winning a different instant prize game are 1 : 10.You want the best chance of winning.Which game should you play? Explain your reasoning.
The odds of an event occurring are 4 : 5.Find (a) the probability that the event will occur and (b) the probability that the event will not occur.
A card is picked at random from a standard deck of 52 playing cards. Find the odds that it is a spade.
A card is picked at random from a standard deck of 52 playing cards. Find the odds that it is not a spade.
The odds of winning an event A are p : q. Show that the probability of event A is given by P(A) = p/p + q.
You roll a pair of six-sided dice and record the sum.(a) List all of the possible sums and determine the probability of rolling each sum.(b) Use technology to simulate rolling a pair of dice and record the sum 100 times. Make a tally of the 100 sums and use these results to list the probability of
In 2021, the median annual salary of a first-year chemist was $58,700.
A survey of 3941 college students in bachelor’s degree programs found that 49% think that the COVID-19 pandemic is likely to negatively impact their ability to complete their degree.
A survey of 182 undergraduate and graduate students found that 60%have had difficulty coping with stress in a healthy way.
The amounts of time (in months) that 16 stars of The Bachelorette and their chosen partner stayed together as of April 2021 are listed. 208 12 3 12 18 94 3 75 8 36 75 20 24 045
The six top-earning states in 2019 by median household income are listed. 1. Maryland 2. New Jersey 3. Hawaii 4. Massachusetts 5. Connecticut 6. Alaska
The ages of the Supreme Court justices as of April 7, 2021In Exercises 25 and 26, find the range, mean, variance, and standard deviation ofthe population data set. 66 56 72 49 82 71 66 60 53
A student’s grade on the Fundamentals of Engineering exam has a z-score of -0.5. Make an observation about the student’s grade.
Describe the relationship between quartiles and percentiles.
On a box-and-whisker plot, one quarter of a data set lies on the left whisker.In Exercises 7–10, determine whether the statement is true or false. If it is false, rewrite it as a true statement.
The second quartile is the mean of an ordered data set.In Exercises 7–10, determine whether the statement is true or false. If it is false, rewrite it as a true statement.
In Exercises 11 and 12, (a) find the quartiles, (b) find the interquartile range, and (c) identify any outliers. 56 63 51 60 57 60 60 60 54 54 63 59 80 63 60 62 65
In Exercises 11 and 12, (a) find the quartiles, (b) find the interquartile range, and (c) identify any outliers. 22 25 22 24 20 24 19 22 29 21 21 20 23 25 23 23 21 25 23 22
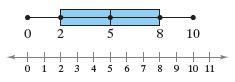
In Exercises 13 and 14, use the box-and-whisker plot to identify the five-number summary. 0 2 5 8 10 ++ ++ 0 1 2 3 4 5 6 7 8 9 10 11
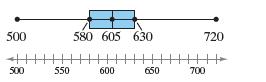
In Exercises 13 and 14, use the box-and-whisker plot to identify the five-number summary. 500 580 605 630 720 500 550 600 650 700
The number of hours spent studying per day by a sample of 28 studentsIn Exercises 23–26, use technology to draw a box-and-whisker plot that represents the data set. 2 8 7 2 261 82 35 37 25 20 73 83 56 8 35 1 3762 37
The number of vacation days used by a sample of 20 employees in a recent yearIn Exercises 23–26, use technology to draw a box-and-whisker plot that represents the data set. 3 9 2 17 5 3 2 2 6 4 0 10 0 3 5 7 8 65
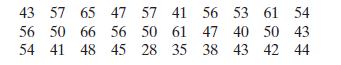
Which ages are above the 75th percentile?In Exercises 33–36, use the data set, which represents the ages of 30 executives. 43 57 65 47 57 41 56 50 66 56 50 54 41 48 45 56 53 61 54 61 47 40 50 43 28 35 38 43 42 44
z = 0, z = 2.14, z = -1.43 In Exercises 41 and 42, the midpoints A, B, and C are marked on the histograms at the left. Match them with the indicated z-scores.Which z-scores, if any, would be considered unusual?
z = 0.77, z = 1.54, z = -1.54 In Exercises 41 and 42, the midpoints A, B, and C are marked on the histograms at the left. Match them with the indicated z-scores.Which z-scores, if any, would be considered unusual?
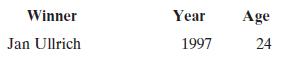
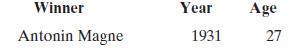
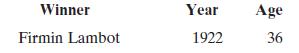
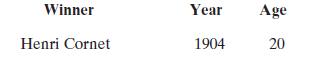
The distribution of the ages of the winners of the Tour de France from 1903 to 2020 is approximately bell-shaped. The mean age is 27.9 years, with a standard deviation of 3.4 years. In Exercises 43– 48, use the corresponding z-score to determine whether the age is unusual. Explain your reasoning.
The distribution of the ages of the winners of the Tour de France from 1903 to 2020 is approximately bell-shaped. The mean age is 27.9 years, with a standard deviation of 3.4 years. In Exercises 43– 48, use the corresponding z-score to determine whether the age is unusual. Explain your reasoning.
The distribution of the ages of the winners of the Tour de France from 1903 to 2020 is approximately bell-shaped. The mean age is 27.9 years, with a standard deviation of 3.4 years. In Exercises 43– 48, use the corresponding z-score to determine whether the age is unusual. Explain your reasoning.
The distribution of the ages of the winners of the Tour de France from 1903 to 2020 is approximately bell-shaped. The mean age is 27.9 years, with a standard deviation of 3.4 years. In Exercises 43– 48, use the corresponding z-score to determine whether the age is unusual. Explain your reasoning.
The distribution of the ages of the winners of the Tour de France from 1903 to 2020 is approximately bell-shaped. The mean age is 27.9 years, with a standard deviation of 3.4 years. In Exercises 43– 48, use the corresponding z-score to determine whether the age is unusual. Explain your reasoning.
The distribution of the ages of the winners of the Tour de France from 1903 to 2020 is approximately bell-shaped. The mean age is 27.9 years, with a standard deviation of 3.4 years. In Exercises 43– 48, use the corresponding z-score to determine whether the age is unusual. Explain your reasoning.
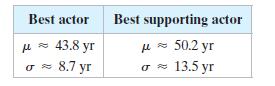
Best Actor 2018: Gary Oldman, Age: 59 Best Supporting Actor 2018: Sam Rockwell, Age: 49 The table shows population statistics for the ages of Best Actor and Best Supporting Actor winners at the Academy Awards from 1929 to 2020. The distributions of the ages are approximately bell-shaped. In
Best Actor 1970: John Wayne, Age: 62 Best Supporting Actor 1970: Gig Young, Age: 56 The table shows population statistics for the ages of Best Actor and Best Supporting Actor winners at the Academy Awards from 1929 to 2020. The distributions of the ages are approximately bell-shaped. In Exercises
In Exercises 25-28, construct a data set that has the given statistics.N=6μ=5N=8
In Exercises 25-28, construct a data set that has the given statistics.N=8σ≈2σ≈3
In Exercises 25-28, construct a data set that has the given statistics.n=6x¯=7s=2
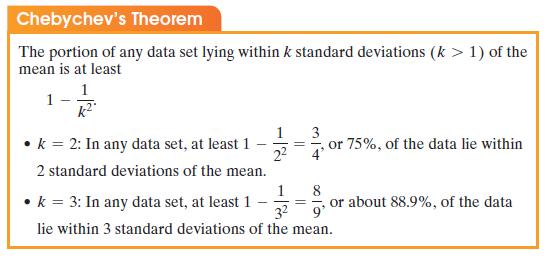
The mean number of runs per game scored by the Los Angeles Dodgers during the 2020 World Series was 5.3 runs, with a standard deviation of 1.8 runs. Apply Chebychev's Theorem to the data using k=2. Interpret the results. Chebychev's Theorem The portion of any data set lying within k standard
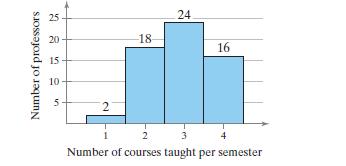
The number of courses taught per semester by a random sample of university professors are shown in the histogram. Number of professors 25 20 15 10 10 18- 24 5. 2 2 3 16 Number of courses taught per semester
The amounts of caffeine in a sample of five-ounce servings of brewed coffee are shown in the histogram. Number of 5-ounce servings S 25- 20 15 10 25 12 10 1 2 70.5 92.5 114.5 136.5 158.5 Caffeine (in milligrams)
Sample annual salaries (in thousands of dollars) for entry level software engineers in Raleigh, NC, and Wichita, KS, are listed. Raleigh 69.5 74.2 65.1 56.5 65.6 62.1 79.5 72.4 58.3 Wichita 59.7 76.0 57.1 79.7 55.2 70.7 80.0 78.8 64.2
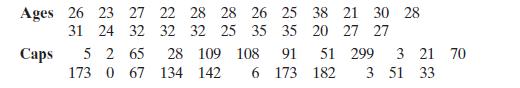
The ages (in years) and caps (number of matches played) of all members of the 2021 Women’s U.S. soccer team are listed. Ages 26 23 27 31 24 32 Caps 52 65 28 109 108 91 173 0 67 134 142 22 28 28 26 25 38 21 30 28 32 32 25 35 35 20 27 27 51 299 3 21 70 6 173 182 3 51 33
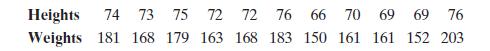
The heights (in inches) and weights (in pounds) of every France national soccer team player that started the 2018 FIFA Men’s World Cup final are listed. Heights 74 73 75 72 72 76 66 70 69 69 76 Weights 181 168 179 163 168 183 150 161 161 152 203
Sample SAT scores for eight males and eight females are listed. Males 1010 1170 1410 920 1320 1100 690 1140 Females 1190 1010 1000 1300 1470 1250 840 1060
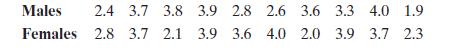
Sample grade point averages for ten male students and ten female students are listed. Males 2.4 3.7 3.8 3.9 Females 2.8 3.7 2.1 3.9 2.8 2.6 3.6 3.3 4.0 1.9 3.6 4.0 2.0 3.9 3.7 2.3
The English statistician Karl Pearson (1857-1936) introduced a formula for the skewness of a distribution.P=3(x¯− median )s Pearson's index of skewness Most distributions have an index of skewness between -3 and 3 . When P>0, the data are skewed right. When P
A research study compared the memory retention of subjects when a learning activity was followed by a brief period of wakeful rest and when a learning activity was followed by a brief period of distraction.In Exercises 11–14, determine whether the study is an observational study or an experiment.
In a survey of U.S. employees, 42% of black women say they are uncomfortable sharing thoughts about racial inequality.In Exercises 11–14, determine whether the study is an observational study or an experiment. Explain.
Showing 300 - 400
of 1977
1
2
3
4
5
6
7
8
9
10
11
12
13
14
15
Last
Step by Step Answers