New Semester
Started
Get
50% OFF
Study Help!
--h --m --s
Claim Now
Question Answers
Textbooks
Find textbooks, questions and answers
Oops, something went wrong!
Change your search query and then try again
S
Books
FREE
Study Help
Expert Questions
Accounting
General Management
Mathematics
Finance
Organizational Behaviour
Law
Physics
Operating System
Management Leadership
Sociology
Programming
Marketing
Database
Computer Network
Economics
Textbooks Solutions
Accounting
Managerial Accounting
Management Leadership
Cost Accounting
Statistics
Business Law
Corporate Finance
Finance
Economics
Auditing
Tutors
Online Tutors
Find a Tutor
Hire a Tutor
Become a Tutor
AI Tutor
AI Study Planner
NEW
Sell Books
Search
Search
Sign In
Register
study help
statistics
elementary statistics in social research
Elementary Statistics In Social Research 12th Edition Jack A. Levin, James Alan Fox, David R. Forde - Solutions
To understand better the lives of homeless people, a researcher decides to live on the streets for one week disguised as a homeless person. Which of the following would describe this research strategy?a. Meta-analysisb. Content analysisc. Experimentd. Participant observatione. Secondary analysis
A social psychologist is interested in studying how people experience grief. For each of the following situations, identify the research strategy (experiment, survey, content analysis, or participant observation) that she would be using:a. To find out how people cope with the loss of loved ones,
From the General Social Survey data, find the valid percentage of respondents in 2010 who favored the death penalty for murder (CAPPUN). Next, find the percentage of respondents who said that they are in excellent health (HEALTH). Choose another variable and comment on some aspect of it. Hint: To
Frequency distributions can be used toa. Compare gender differences in violent criminal behavior.b. Display the grades on a midterm examination for all students in a sociology course.c. Compare attitudes of college students and their parents regarding war.d. Show attitudes of all students on a
Use the General Social Survey data to find the valid percentage of Americans who said that they were very satisfied with their job or housework (SATJOB). Next, find the cumulative percentage of people who say that their family income in 2010 was below $50,000 (INCOME06). Why do you think that
Which of the following is not used to make comparisons between distributions when their total frequencies differ?a. Proportionsb. Ratesc. Ratiosd. Class limits
The Federal Bureau of Investigation collects information about Crime in the United States and publishes it on an annual basis. Use SPSS to produce a line chart for the violent crime rate in the United States from 1987 to 2010 based on the following table of data values:Violent Crime Rate in the
From the General Social Survey, generate a bar graph for the number of nights per month that Americans visit with friends (SOCFRND). Be sure to provide a title, source, and show percentages on the bar graph.
Which of the following is employed when comparing a score on a final examination against the entire distribution of grades in a class?a. Midpointb. Class intervalc. Class limitsd. Percentiles
A researcher collects information from a random sample of consumers of different social classes about whether they had purchased a new car within the past year.a. Are there independent and dependent variables in this case? If so, what are they? If not, why not?b. What percent of the sample reported
Use the General Social Survey to make a pie chart about respondents’ self-reported happiness of marriage (HAPMAR). Be sure to provide a title, source, and show percentages on the pie chart.
By definition, class intervals contain more than onea. Score value.b. Score.c. Respondent.d. Category.
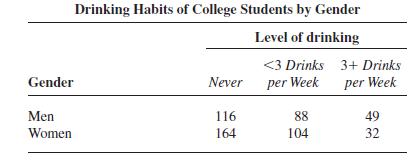
As part of a public health survey, a random sample of college students were asked about their weekly drinking habits. The following results were obtained:a. Are there independent and dependent variables in this case? If so, what are they? If not, why not?b. What percent of the sample reports not
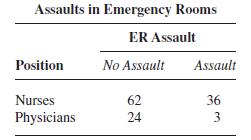
A researcher collects information from emergency room staff members about whether they have ever been assaulted by a patient or a patient’s family member while at work.a. Are there independent and dependent variables in this case? If so, what are they? If not, why not?b. What percent of the
The peakedness of a distribution of scores is also known asa. Kurtosis.b. Skewness.c. Midpoint.d. Mean.
A frequency distribution of the number of defendants sentenced to death in each of the 50 states during 2001 would be depicted best in the form of aa. Histogram.b. Bar graph.c. Frequency polygon.d. Line chart.
The direction of skewness is determined by the relative position of thea. Peak of the distribution.b. Midpoint of the distribution.c. Tail of the distribution.d. Class limits of the distribution.
To show changes in birth rate from 1980 to the present, by year, a researcher would probably use aa. Pie chart.b. Bar graph.c. Line chart.d. Frequency polygon.
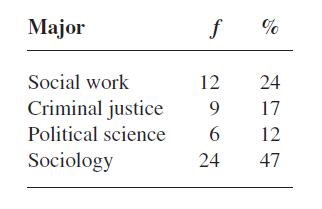
Use a pie chart to depict the following information about college majors of students in a statistics class. Major Social work Criminal justice Political science Sociology f 12 9 6 24 % 24 17 12 47
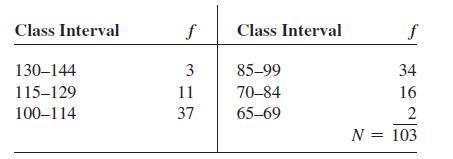
On graph paper, draw both a histogram and a frequency polygon to illustrate the following distribution of IQ scores: Class Interval 130-144 115-129 100-114 f 3 11 37 Class Interval 85-99 70-84 65-69 f 34 16 2 N = 103
In a group of 125 males and 80 females, what is the gender ratio (number of males per 100 females)?
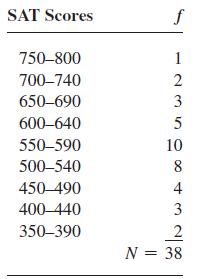
The distribution of Scholastic Assessment Test (SAT) scores for 38 high school seniors who graduated in the top third of their class is as follows:a. For each class interval, find the size, midpoint, upper and lower limits, the cumulative frequency, the percentage, and the cumulative percentage.b.
In a group of 15 black children and 20 white children, what is the ratio of blacks to whites?
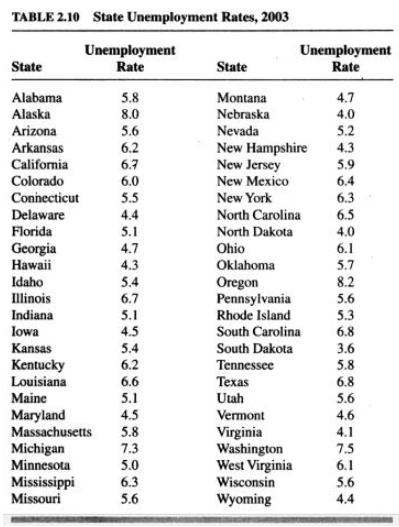
Using a blank map of the United States, show the unemployment rates from Table 2.10 with the following key: Table 2.10(a) Shade in states with unemployment rates of 6.0 and over;(b) Draw right diagonal lines in states with unemployment rates of 5.0 through 5.9; and(c) Leave blank the states
If 300 live births occur among 3,500 women of childbearing age, what is the birth rate (per 1,000 women of childbearing age)?
What is the rate of change for a population increase from 15,000 in 1960 to 25,000 in 2000?
What is the rate of change for a tax increase from $32 billion per year to $37 billion per year?
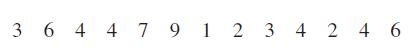
A researcher asked a group of patients with mental illnesses to describe their current levels of stress on a scale of 0 to 10 with 10 being the most stressed. The patients provided the following answers: 3 6 4 4 7 9 1 2 3 4 2 4 6
From the General Social Survey, find out the average number of hours per day of television that people watch. Find the mode, median, and mean for hours of television per day (TVHOURS). Hint: Open the STATISTICS option within the FREQUENCIES procedure to obtain the mode, median, and mean for
How often during the past year did people in the United States have sex? Use the General Social Survey to find the median and mode for peoples’ reports about sex during the pastyear (SEXFREQ). Should you calculate a mean for this variable? Why or why not?
How much money does an American family make in constant dollars (the constant refers to “year 2000” dollars)? Income is estimated using information from the General Social Survey and then converting it into constant dollars in year 2000 (CONINC). What is the level of measurement for this
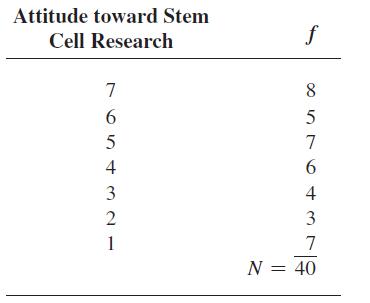
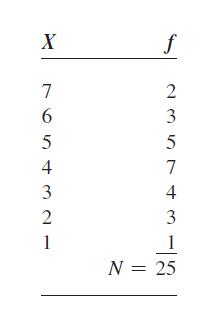
The simple frequency distribution below shows the scores from 40 people who were asked to rate on a scale from 1 to 7 their attitudes toward stem cell research (with 1 being the most favorable attitude toward stem cell research and 7 being the least favorable).Find (a) the mode, (b) the median, and
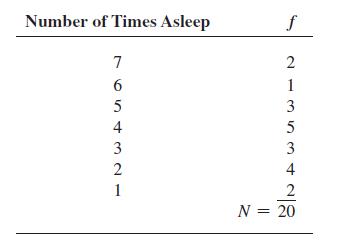
A team of psychologists studying narcolepsy (a sleep disorder characterized by sudden nodding off during the day) decided to follow 20 narcoleptic volunteers throughout the course of one day and record how many times they each fell asleep. The data they collected have been arranged in the following
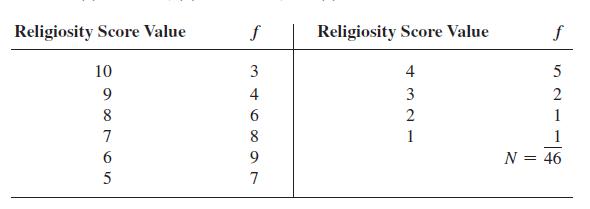
The scores on a religiosity scale (higher scores indicate greater commitment to religious expression) were obtained for 46 adults. For the following simple frequency distribution, calculate (a) the mode, (b) the median, and (c) the mean: Religiosity Score Value 10 9 8 7 6 5 f 3 689746 Religiosity
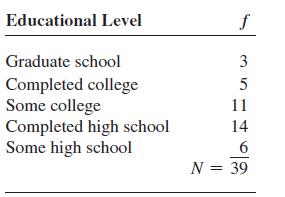
The following frequency distribution contains the educational levels attained by the 39 office personnel of a small company:Given the level at which educational level was measured (nominal, ordinal, or interval/ratio), calculate the measures of central tendency appropriate for describing the
Using information from the General Social Survey, examine the dispersion of the number of brothers and sisters of Americans (SIBS). Hint: Open the STATISTICS option within the FREQUENCIES procedure and check the range and standard deviation for selected variables. Remember to weight cases by
A measure of how scores scatter around the center of a distribution isa. Variance.b. Standard deviation.c. Range.d. All of the above
In Chapter 3, you were asked to find the mode, median, and mean for hours of television per day watched by Americans. Now, find the range, standard deviation, and variance for hours per day of television watched (TVHOURS).
Which of the following statements is most true about the relative size of measures of variability?a. The standard deviation is usually larger than the variance.b. The variance is usually larger than the standard deviation.c. The variance and the standard deviation are equal in size.d. The
The greater the variability around the mean of a distribution, the larger thea. Range.b. Inter-quartile range.c. Variance.d. All of the above
From the General Social Survey, which measures of central tendency and variability are most appropriate for attitudes toward spanking to discipline children (SPANKING)?
Which measures of central tendency and variability are most appropriate for an analysis of respondent’s income (RINCOM06)? Analyze the General Social Survey to calculate this information.
Analyze a variable of your choice where you find the most appropriate measures of central tendency and variability.
How many standard deviations tend to cover the entire range of scores in a distribution?a. 2 b. 4 c. 6 d. 8
The mean of the squared deviations from the mean is known as thea. Variance.b. Median.c. Normal range.d. Inter-quartile range.
A group of 12 students provided feedback to their professor on course evaluations about the quality of the course, as measured on a scale from 0 (poor) to 10 (excellent). The responses were as follows:Calculate the (a) range, (b) the variance, and (c) the standard deviation of this distribution. 8
A researcher is interested in the amount of time lost due to injuries that occur at work. She surveyed a group of workmen’s compensation beneficiaries, asking them how many weeks they were unable to work because of their injuries. The following times, in weeks, were given by 15
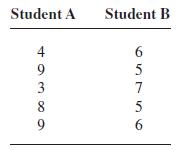
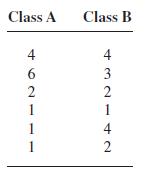
Two students in a math class compared their scores on a series of five quizzes: Considering the concepts of both central tendency and variability, find (a) which student tended to perform better on the quizzes and (b) which student tended to perform more consistently on the quizzes. Student
On a scale designed to measure attitude toward immigration, two college classes scored as follows:Compare the variability of attitudes toward immigration among the members of the two classes by calculating for each class (a) the range, (b) the inter-quartile range, and (c) the standard deviation.
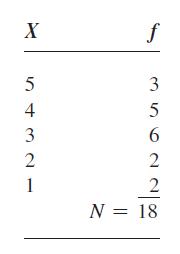
Find the standard deviation for the following frequency distribution of the hours of television watched on one Saturday night by a sample of 18 junior high boys: X 5 4 3 2 1 f 35 16228 N = 18
A researcher interested in the use of public parks asked residents of a neighborhood how often per month they typically visit a park in proximity to their homes. The residents provided the following answers in terms of visits per month:Calculate the (a) range, (b) the variance, and (c) the standard
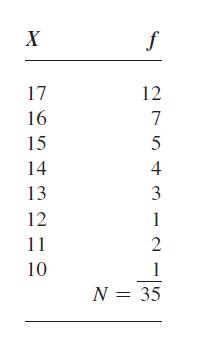
Find the variance and the standard deviation for the following frequency distribution of ages of 35 juvenile offenders tried and sentenced in adult criminal courts: X 17 165HSLID 2754312 14 13 12 11 f 10 1 N = 35
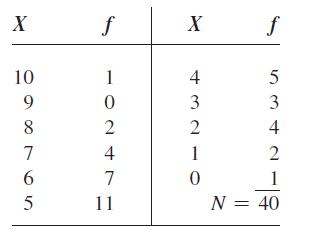
Find the variance and standard deviation for the following frequency distribution of hours studied during a particular week by the 40 students in a statistics course: X 10 9 8 7 6 5 f 1 0 2 4 7 11 X 4 3 2 1 0 f 53 4 2 N = 40
A simple graph used for visualizing distributions that describes the mean, the median, and the range of a distribution is known as aa. Line graph.b. Box plot.c. Pie graph.d. Histogram.
Find the variance and standard deviation for the following frequency distribution of attitudes toward capital punishment held by 25 college students (seven-point scale; higher score indicates more favorable attitude toward capital punishment): X 7 6 5 4 3 2 1 f 2357 2 3 4 3 1 N = 25
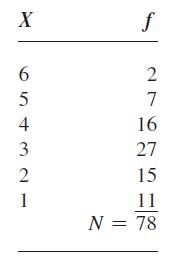
Find the (a) variance and (b) standard deviation for the following simple frequency distribution collected from 78 college students as to the number of their friends, from 1 to 6, who have been victims of domestic violence. X 654321 f 2 7 16 27 15 11 N = 78
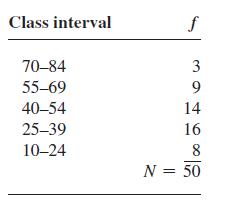
For the following grouped frequency distribution of occupational prestige scores for a group 50 workers, calculate the mean and standard deviation. Class interval 70-84 55-69 40-54 25-39 10-24 f 3 9 14 16 8 N = 50
Education is an important issue. Using the General Social Survey, find the mean and standard deviation for the highest year of school completed (EDUC).a. Using this mean and standard deviation, what percentage of Americans are expected to complete 16 or more years of education (16 or above)?b. What
The relative likelihood of occurrence of any given event is known as that event’sa. Standard deviation.b. Area under the normal curve.c. Probability.d. All of the above
Using the frequencies procedure (ANALYZE, DESCRIPTIVE STATISTICS, FREQUENCIES), request a histogram of television viewing data from the General Social Survey (TV HOURS) with the normal curve overlay (from the Charts button), as well as the mean and standard deviation (from the Statistics button).a.
Probability varies froma. Zero to infinity.b. Zero to 1.0.c. 1.0 to 100.0.d. -1.0 to +1.0.
Using the frequencies procedure (ANALYZE, DESCRIPTIVE STATISTICS, FREQUENCIES), request a histogram of the number of brothers and sisters (SIBS) from the General Social Survey with the normal curve overlay (from the Charts button), as well as the mean and standard deviation (from the Statistics
A criminal investigator is working to bring two separate and distinct serial killers to justice— one who preys on prostitutes and another who targets college students. From previous experience, the investigator is led to believe that he has a .50 chance of apprehending the prostitute slayer and a
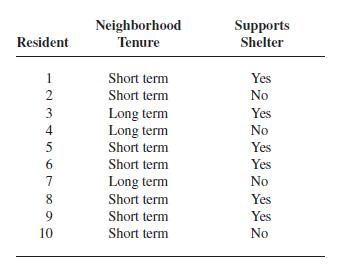
A group of residents were asked about their support for a homeless shelter being opened in their neighborhood. They were also asked about how long they had lived in the neighborhood, with short-term residency defined as less than three years and long-term as three years or more.What is the
z = .49 indicates that a particular raw score liesa. Below 49% of the scores in the distribution.b. Almost half of a standard deviation below the mean.c. Almost half of a standard deviation above the mean.d. Almost half of a standard deviation both below and above the mean.
With any set of scores that is normally distributed, what percentage of the total area fallsa. Between the mean and a score that lies one standard deviation below the mean?b. Between a score that lies one standard deviation below the mean and one standard deviation above the mean?c. Between the
Which of the following is not true of a normal curve?a. It is skewed.b. It is a probability distribution.c. Its total area contains 100% of the cases.d. The mode, median, and mean are identical.
A ________ indicates how far an individual raw score falls from the mean of a distribution; the ________ indicates how the scores in general scatter around the mean.a. Standard deviation; z scoreb. Z score; standard deviationc. Probability; z scored. Standard deviation; probability
The equation z = -1.33 indicates that a particular raw score liesa. 1.33 standard deviations below the mean.b. 1.33 percent below the mean.c. 1.33 percentile ranks below the mean.d. 1.33 z scores below the standard deviation.
Drawing one card at random from a standard deck of 52 cards, what is the probability of drawinga. The eight of diamonds?b. The eight of diamonds or the eight of hearts?c. An eight?d. A red card?e. A picture card (jack, queen, or king)?f. A card from six through nine, inclusive?g. An odd-numbered
Suppose that 31% of Democrats and 63% of Republicans support building more nuclear power plants in the United States. Now suppose that there are 40 Republicans and 35 Democratsin one room.a. What is the probability of randomly selecting a Republican from this room?b. What is the probability of
Research has shown that 6 out of 10 marriages end in divorce. What is the probability thata. A particular just-married couple stays married “until death do them part”?b. Two couples married in a double ceremony both get divorced?
Suppose that 2% of convicted felons are in fact innocent.a. If a person is convicted of a felony, what is the probability that he is guilty?b. If two people are convicted of felonies, what is the probability that both are guilty?c. If three people are convicted of felonies, what is the probability
Using the z scores calculated in Problem 28 and Table A, what is the percentage of SAT scores that fallsa. 500 or above?b. 400 or below?c. Between 500 and 650?d. 570 or above?e. Between 250 and 750?f. 380 or above?
A major automobile company claims that its new model has an average rating of 25 mpg (miles per gallon). Company officials concede that some cars vary based on a variety of factors, and that the mpg performances have a standard deviation of 4 mpg. You are employed by a consumer protection group
In an impoverished urban area, individual income is normally distributed with a mean of $21,000 and a standard deviation of $2,000. What percentage of incomes falla. Between $19,000 and $21,000?b. Between $19,000 and $23,000?c. Between $17,000 and $25,000?d. Above $23,000?e. Below $17,000?f.
For the income distribution listed in question 35, determine the z score for each of the following incomes:a. $12,500b. $22,600c. $19,850d. $6,050e. $32,000f. $21,050
Showing 1900 - 2000
of 1977
First
6
7
8
9
10
11
12
13
14
15
16
17
18
19
20
Step by Step Answers