New Semester
Started
Get
50% OFF
Study Help!
--h --m --s
Claim Now
Question Answers
Textbooks
Find textbooks, questions and answers
Oops, something went wrong!
Change your search query and then try again
S
Books
FREE
Study Help
Expert Questions
Accounting
General Management
Mathematics
Finance
Organizational Behaviour
Law
Physics
Operating System
Management Leadership
Sociology
Programming
Marketing
Database
Computer Network
Economics
Textbooks Solutions
Accounting
Managerial Accounting
Management Leadership
Cost Accounting
Statistics
Business Law
Corporate Finance
Finance
Economics
Auditing
Tutors
Online Tutors
Find a Tutor
Hire a Tutor
Become a Tutor
AI Tutor
AI Study Planner
NEW
Sell Books
Search
Search
Sign In
Register
study help
engineering
electrical engineering
Basic Engineering Circuit Analysis 9th Edition J. David Irwin - Solutions
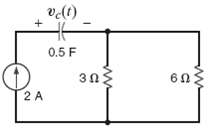
If vc (t = 2s) = 10V in the circuit in figure, find the energy stored in the capacitor and the power supplied by the source at t = 6s.
The current in an inductor changed from 0 to 200mA in 4 ms and induces a voltage of 100mV. What is the value of the inductor?
The current in a 100-mH inductor is i(t) = 2 sin 377t A. Find(a) The voltage across the inductor and(b) The expression for the energy sorted in the element.
If the current i(t) = 1.5t A flows through a 2-H inductor, find the energy stored at t = 2s.
Given the data in the previous problem, find the voltage across the inductor and the energy stored in it after 1 s.
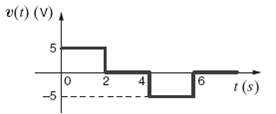
The voltage across a 2-H inductor is given by the waveform shown in figure. Find the waveform for the current in theinductor.
The voltage across a 4-H inductor is given by the waveform shown in figure. Find the waveform for the current in the inductor v(t) = 0, t
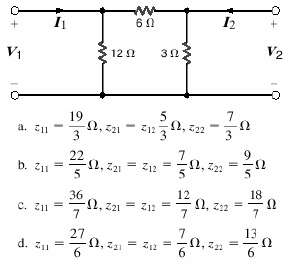
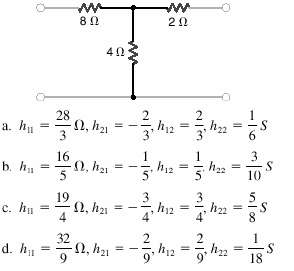
Find the Z parameters of the network shown infigure.
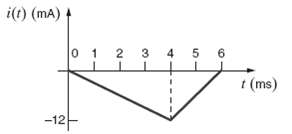
The current in a 10-mH inductor is shown in figure. Determine the waveform for the voltage across theinductor.
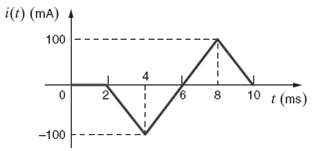
The current in a 50-mH inductor is given in figure. Sketch the inductorvoltage.
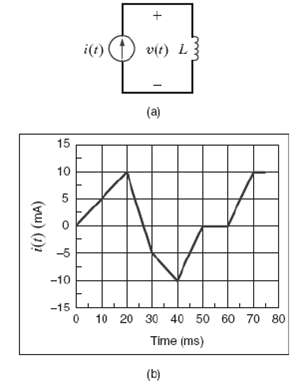
The current in a 50-mH inductor is shown in figure. Find the voltage across theinductor.
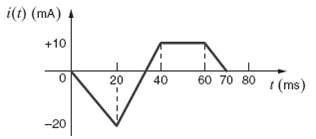
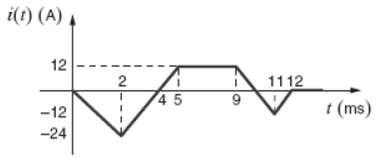
Draw the waveform for the voltage across a 24-mH inductor when the inductor current is given by the wave-form shown infigure.
The current in a 24-mH inductor is given by the waveform in figure. Find the waveform for the voltage across the inductor.
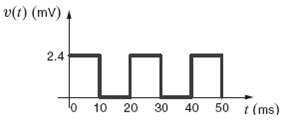
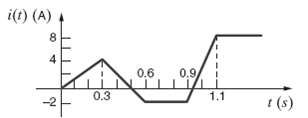
The current in a 4-mH inductor is given by the waveform in figure. Plot the voltage across the inductor.
Calculate the hybrid parameters of the network in figure.
Find the possible capacitance range of the following capacitors.(a) 0.0068μF with a tolerance of 10%.(b) 120pF with a tolerance of 20%.(c) 39μF with a tolerance of 20%.
Find the possible inductance rang of the following inductors.(a) 10mH with a tolerance of 10%.(b) 2.0nH with a tolerance of 5%.(c) 68μH with a tolerance of 10%.
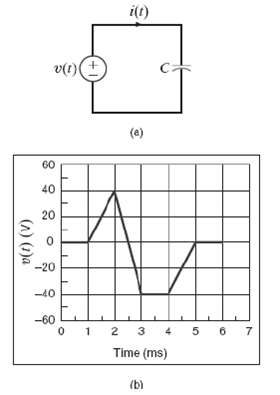
The capacitor in figure a is 51nF with a tolerance of 10%. Given the voltage waveform in figure b, graph the voltage i(t) for the minimum and maximum inductor values.
The inductor in figure a is 4.7?H with a tolerance of 20%. Given the current waveform in figure b, graph the voltage v(t) for the minimum and maximum inductor values.
If the total energy stored in the circuit in figure 80mJ, what is the value of L?
Find the value of C if the energy stored in the capacitor in figure equals the energy stored in the inductor.
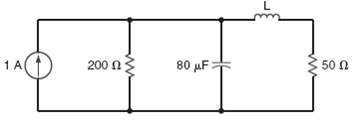
Given the network in figure, find the power dissipated in the 3-? resistor and the energy stored in the capacitor.
What values of capacitance can be obtained by interconnecting a 4-μF capacitor, a 6-μF capacitor, and a 12-μF capacitor.
Given four 2-μF capacitors, find the maximum value and minimum value that can be obtained by interconnecting the capacitors in series/parallel combinations.
Given a 1–, 3–, and 4–μF capacitor, can they be interconnected to obtain an equivalent 2-μF capacitor?
Determine the values of inductance that can be obtained by interconnecting a 4-mH inductor, a 6-mH inductor, and a 12-mH inductor.
Given four 4-mH inductors, determine the maximum and minimum values of inductance that can be obtained by interconnecting the inductors in series/parallel combinations.
Given 6-, 9-and 18-mH inductor, can they be interconnected to obtain an equivalent 12-mH inductor?
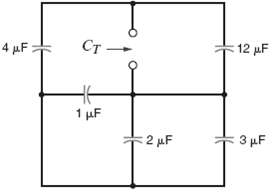
Find the total capacitance CT of the network in figure.
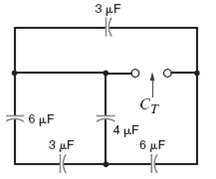
Find the total capacitance CT of the network in figure.
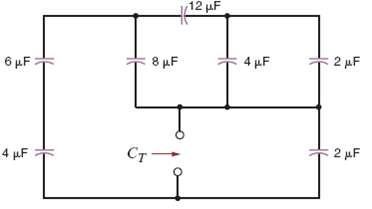
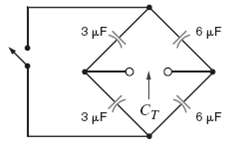
Find the total capacitance CT shown in the network in figure.
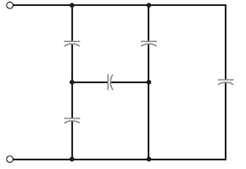
Compute the equivalent capacitance of the network in figure if all the capacitors are 4?F.
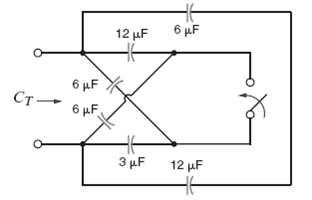
Find Ct in the network in figure if (a) The switch is open and (b) The switch isclosed.
In the network in figure find the capacitance CT if (a) Th switch is open and (b) The switch isclosed.
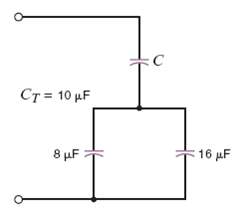
Select the value of C to produce the desired total capacitance of CT = 10?F in the circuit in figure..
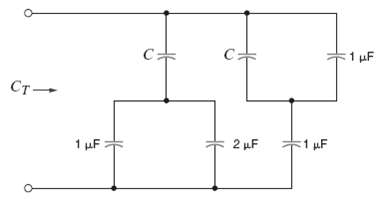
Select the value of C to produce the desired total capacitance of CT = 1?F in the circuit in figure.
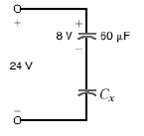
The two capacitors in figure were charged and then connected as shown. Determine the equivalent capacitance, the initial voltage at the terminals, and the total energy stored in thenetwork.
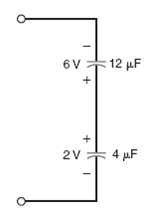
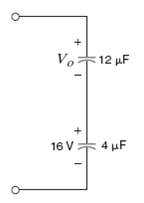
The two capacitors shown in figure have been connected for some time and have reached their present values, find Vo.
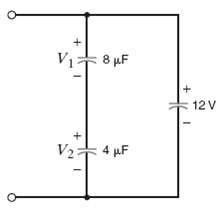
The three capacitors shown in figure have been connected for some time and have reached their present values, find V1 and V2.
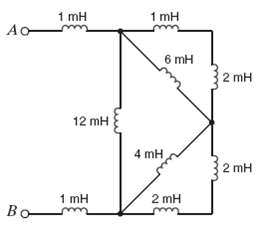
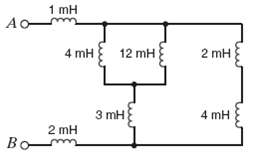
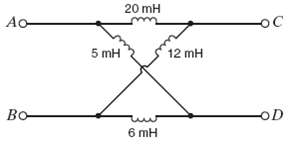
Determine the inductance at terminals A-B in the network in figure.
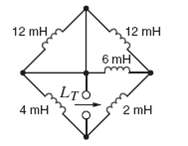
Determine the inductance at terminals A-B in the network in figure.
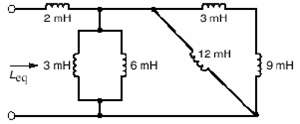
Find the total inductance at the terminals of the network in figure.
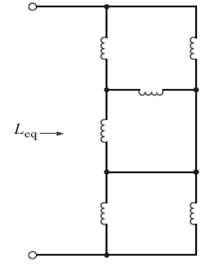
Compute the equivalent inductance of the network in figure if all inductors are 4mH.
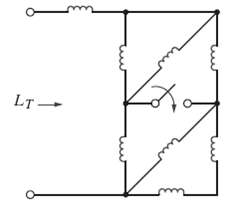
Find LT in the network in figure (a) With the switch open and (b) With the switch closed. All inductors are 12mH.
Given the network shown in figure find (a) The equivalent inductance at terminals A-B with terminals C-D short circuited, and (b) The equivalent inductance at terminals C-D with terminals A-B open circuited.
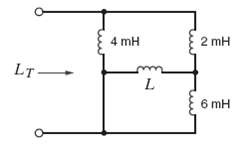
Find the value of L in the network in figure so that the total inductance LT will be 2mH.
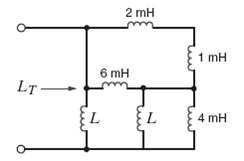
Find the value of L in the network in figure so that the value of LT will be 2mH.
A 20-mH inductor and a 12-mH inductor are connected in series with a 1-A current source. Find(a) The equivalent inductance and(b) The total energy stored.
For the network in figure, vs(t) = 120 cos 377t V. Find v0(t).
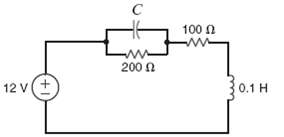
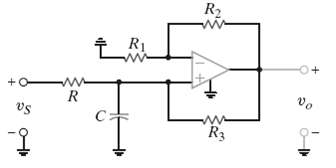
For the network in figure choose C such that
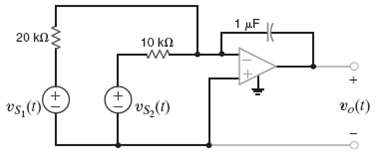
For the network in figure vs,(t) = 80 cos 377t V and vs(t) = 40 cos 377t V. find v0(t).
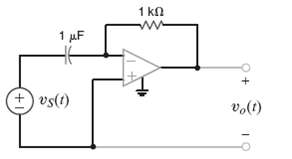
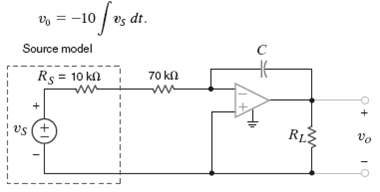
The circuit shown in figure is known as a ?Deboo? integrator.? (a) Express the output voltage in terms of the input voltage and circuit parameters. (b) How is the Deboo integrator?s performance different from that of a standard integrator? (c) What kind of application would justify the use of this
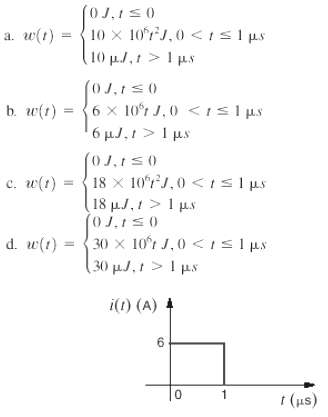
The current pulse shown in figure is applied to a 1-?F capacitor. What is the energy stored in the electric field of the capacitor?
The two capacitors shown in figure have been connected for some time and have reached their present values. Determine the unknown capacitor Cs. a. 20?F b. 30?F c. 10?F d. 90?F
What is the equivalent inductance of the network in figure? a. 9.5mH b. 2.5mH c. 6.5mH d. 3.5mH
Use the differential equation approach to find i (t) 0 for t > 0 in the circuit in figure and plot the response including the time interval just prior to opening the switch.
Use the differential equation approach to find i(t) for t > 0 in the circuit in figure and plot the response including the time interval just prior to opening the switch.
Use the step-by-step technique to find v (t) 0 for t > 0 in the circuit in figure.
Use the step-by-step method to find v (t) 0 for t > 0 in the network in figure.
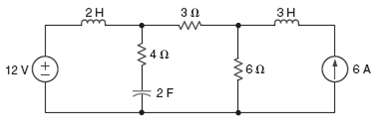
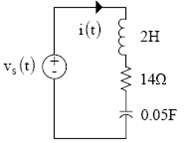
Given the network in figure, find (a) The differential equation that describes the current i(t) (b) The characteristic equation for the network (c) The network?s natural frequencies (d) The type of damping exhibited by the circuit (e) The general expression for i(t)
Find i (t) 0 for t > 0 in the circuit in figure and plot the response including the time interval just prior to closing theswitch.
Use the differential equation approach to find i(t) for t > 0 in the network in figure.
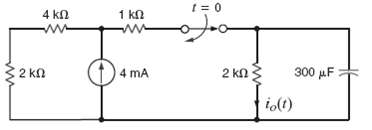
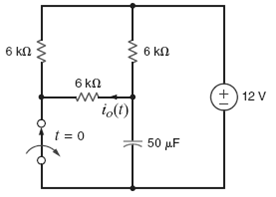
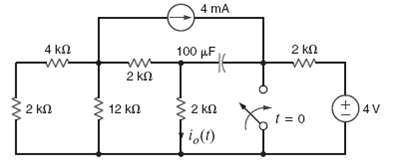
Use the differential equation approach to find i0(t) for t > 0 in the network in figure.
Use the differential equation approach to find v0(t) for t > 0 in the circuit in figure and plot the response including the time interval just prior to switch action.
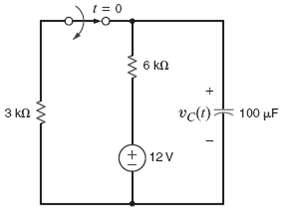
Use the differential equation approach to find vC(t) for t > 0 in the circuit in figure and plot the response including the time interval just prior to closing the switch.
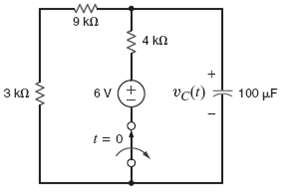
Use the differential equation approach to find vC(t) for t > 0 in the circuit in figure.
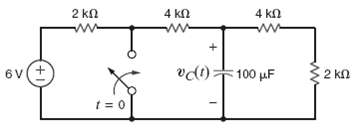
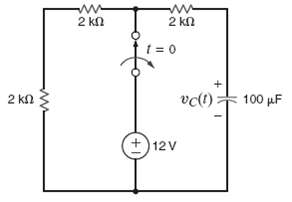
Use the differential equation approach to find vC(t) for t > 0 in the circuit in figure.
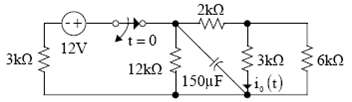
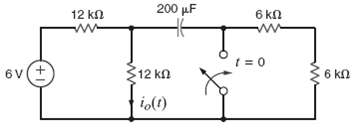
Use the differential equation approach to find io(t) for t > 0 in the circuit in figure and plot the response including the time interval just prior to closing the switch.
Use the differential equation approach to find v0(t) for t > 0 in the circuit in figure and plot the response including the time interval just prior to opening the switch.
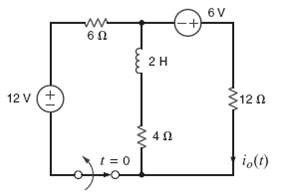
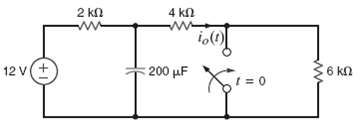
Use the differential equation approach to find i0(t) for t > 0 in the circuit in figure and plot the response including the time interval just prior to opening the switch.
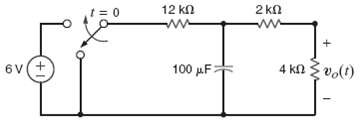
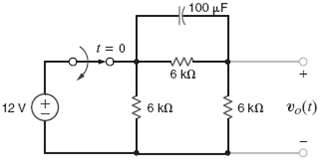
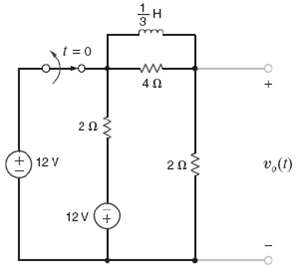
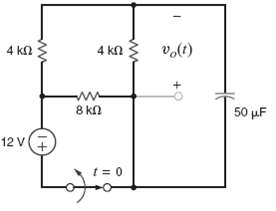
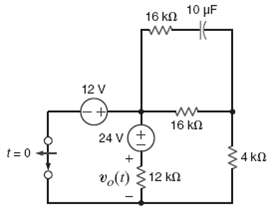
Use the differential equation approach to find v0(t) for t > 0 in the circuit in figure and plot the response including the time interval just prior to opening the switch.
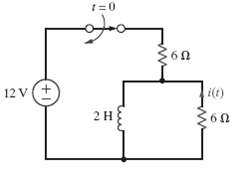
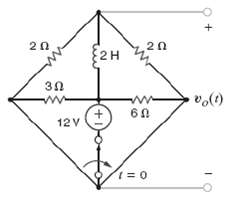
In the network in figure, find iv(t) for t > 0 using the differential equation approach.
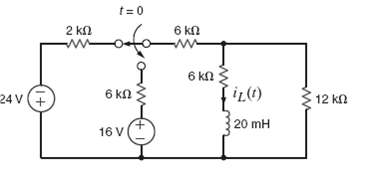
Use the differential equation approach to find iL(t) for t > 0 in the circuit in figure and plot the response including the time interval just prior to opening the switch.
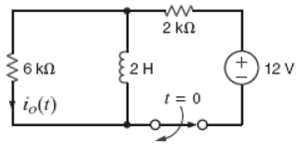
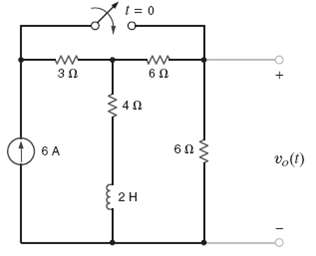
Use the differential equation approach to find i0(t) for t > 0 in the circuit in figure and plot the response including the time interval just prior to opening the switch.
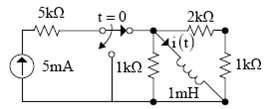
Use the differential equation approach to find i(t) for t > 0 in the circuit in figure and plot the response including the time interval just prior to opening the switch.
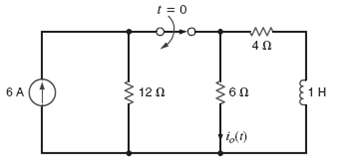
Use the step-by-step method to find io(t) for t > 0 in the circuit in figure.
Use the step-by-step technique to find io(t) for t > 0 in the network in figure.
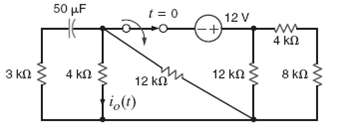
Find io(t) for t > 0 in the network in figure using the step-by-step method.
Use the step-by-step method to find io(t) for t > 0 in the circuit in figure.
Use the step-by-step method to find io(t) for t > 0 in the circuit in figure.
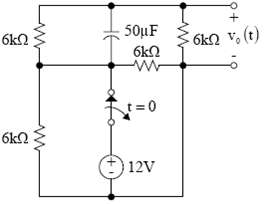
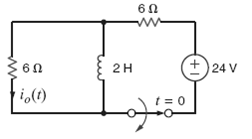
Find vo(t) for t > 0 in the network in figure using the step-by-step technique.
Use the step-by-step technique to find io(t) for t > 0 in the network in figure.
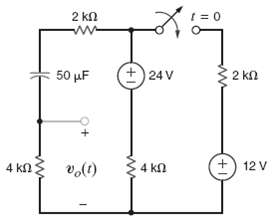
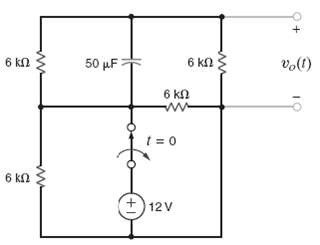
Use the step-by-step method to find vo(t) for t > 0 in the network in figure.
Use the step-by-step method to find vo(t) for t > 0 in the network in figure.
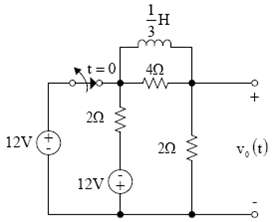
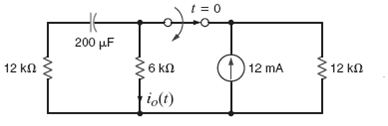
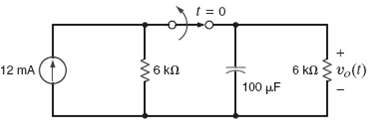
Find vo(t) for t > 0 in the circuit in figure using the step-by-step method.
Find vo(t) for t > 0 in the circuit in figure using the step-by-step method.
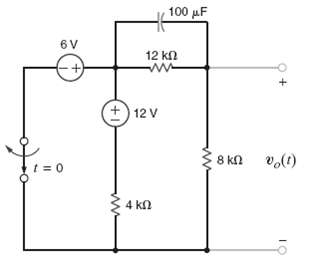
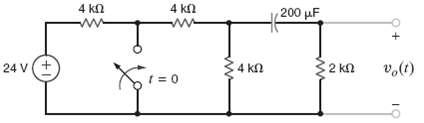
Find vo(t) for t > 0 in the network in figure using the step-by-step method.
Find vo(t) for t > 0 in the network in figure using the step-by-step method.
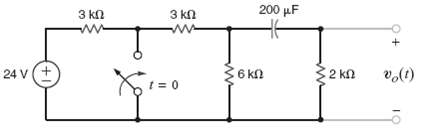
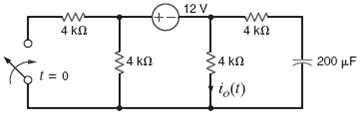
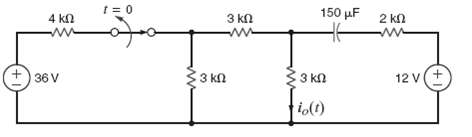
Use the step-by-step method to find io(t) for t > 0 in the circuit in figure.
Find vo(t) for t > 0 in the circuit in figure using the step-by-step.
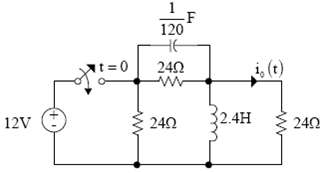
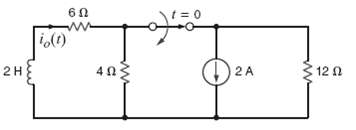
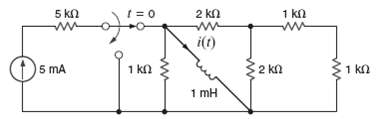
Use the step-by-step method to find io(t) for t > 0 in the network in figure.
Use the step-by-step method to find io(i) for t > 0 in the network in figure.
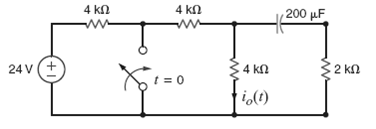
Find io(t) for t > 0 in the network in figure using the step-by-step method.
Use the step-by-step method to find vo(t) for t > 0 in the network in figure.
Use the step-by-step method to find io(i) for t > 0 in the network in figure.
Find vo(t) for t > 0 in the network in figure using the step-by-step technique.
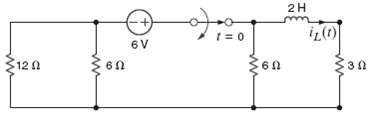
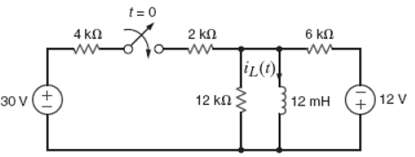
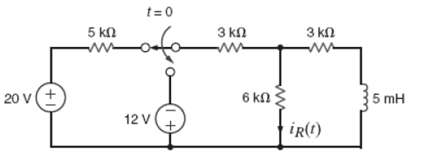
The switch in the circuit in figure is moved at t = 0. Find iL (t) for t > 0 using the step-by-step technique.
The switch in the circuit in figure is moved at t = 0. Find ig(t) for t > 0 using the step-by-step technique.
The switch in the circuit in figure is moved at t = 0. Find iL (t) for t > 0 using the step-by-step technique.
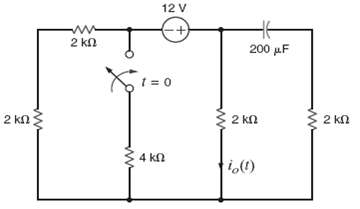
The switch in the circuit in figure is opened at t = 0. Find vo (t) for t > 0 using the step-by-step technique.
Showing 2100 - 2200
of 3459
First
15
16
17
18
19
20
21
22
23
24
25
26
27
28
29
Last
Step by Step Answers