New Semester
Started
Get
50% OFF
Study Help!
--h --m --s
Claim Now
Question Answers
Textbooks
Find textbooks, questions and answers
Oops, something went wrong!
Change your search query and then try again
S
Books
FREE
Study Help
Expert Questions
Accounting
General Management
Mathematics
Finance
Organizational Behaviour
Law
Physics
Operating System
Management Leadership
Sociology
Programming
Marketing
Database
Computer Network
Economics
Textbooks Solutions
Accounting
Managerial Accounting
Management Leadership
Cost Accounting
Statistics
Business Law
Corporate Finance
Finance
Economics
Auditing
Tutors
Online Tutors
Find a Tutor
Hire a Tutor
Become a Tutor
AI Tutor
AI Study Planner
NEW
Sell Books
Search
Search
Sign In
Register
study help
engineering
telecommunication engineering
Discrete Time Signal Processing 2nd Edition Alan V. Oppenheim, Rolan W. Schafer - Solutions
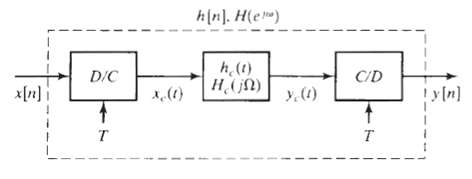
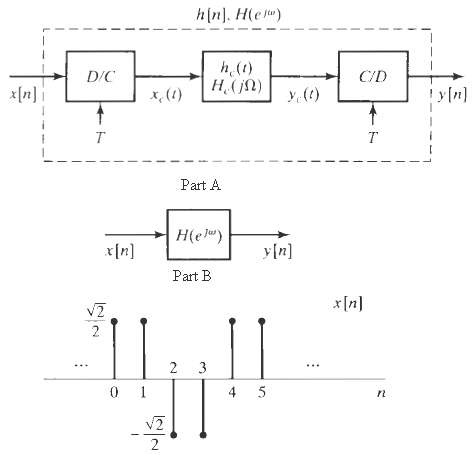
In the system shown in Figure,? Hc(t) =?(t ? T/2). (a) Suppose the input x[n] = sin(? n/2) and T = 10. Find y[n]. (b) Suppose you use the same x[n] as in part (a), but halve T to be 5. Find the resulting y[n]. (c) In general, how does the continuous-time LTI system hc(t) limit the range of the
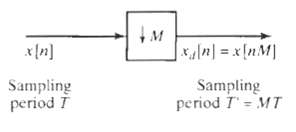
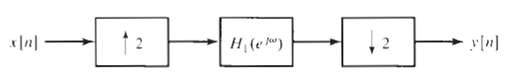
Which of the following signals can be down sampled by a factor of 2 using the system in Figure without any loss of information? (a) x[n] = ?[n ? n0], for n0 some unknown integer? (b) x[n] = cos(? n/4) (c) x[n] = cos(? n/4) + cos(3? n/4) (d) x[n] = sin(? n/3) / (? n/3)? (e) x[n] = (?1)n sin(? n/3) /
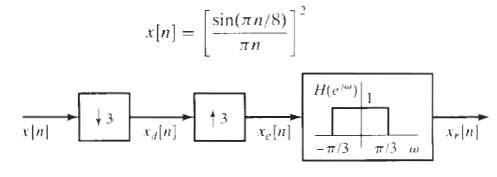
Consider the system shown in Figure. For each of the following input signals x[n], indicate whether the output xr[n] = x[n]. (a) x[n] = cos(? n/4) (b) x[n] = cos(? n/2) (c)
Consider the system in Figure. The input x[n] and corresponding output xd[n] are given for a specific choice of M/L in each of the following parts. Determine a choice for M/L based on the information given, and specify whether your choice is unique.(a) x[n] = sin (π n/3) / (π n/3). xd[n] = sin
Each of the following parts lists an input signal x[n] and the upsampling and downsampling rates L and M for the system in Figure. Determine the corresponding output xd[n].? (a) x[n] = sin(2? n/3) / ? n, L = 4, M =3 (b) x[n] = sin(3? n/4), L = 3, M = 5
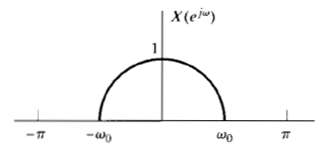
For the system shown in figure X(ej?), the Fourier transform of the input signal x[n], is shown in figure. For each of the following choices of L and M, specify the maximum possbile value of ?0 such such that Xd(ej?) = ? X(ejM?/I.) for some constant ? (a) M = 3, L = 2 (b) M = 5, L = 3 (c) M = 2,
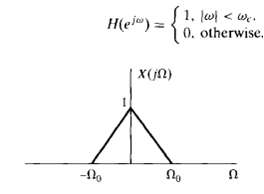
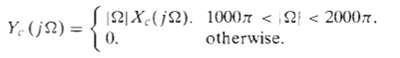
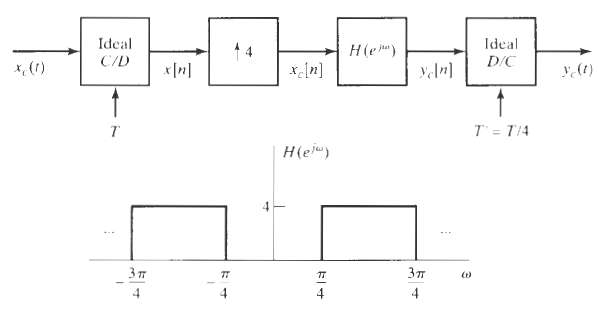
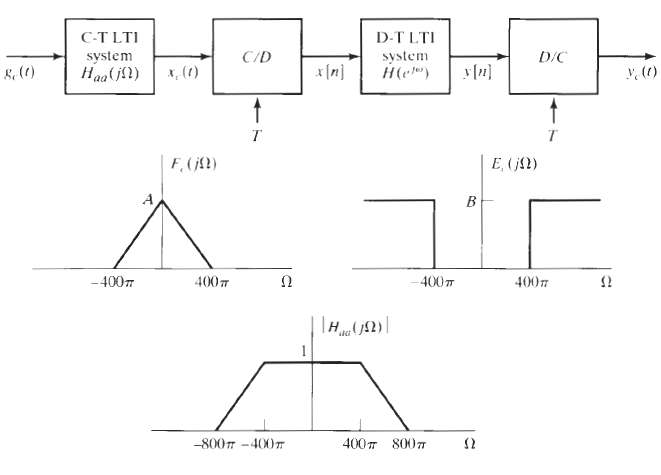
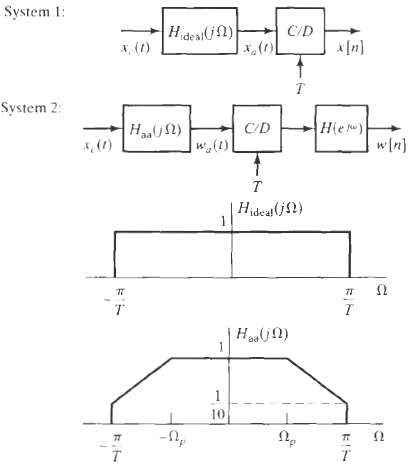
Consider the system in figure. The input signal xc(t) has the Fourier transform shown in figure with ?0 = 2? (1000) radians/second. The discrete-time system is an ideal lowpass filter with frequency response (a) What is the minimum sampling rate Fs = 1/T such that no aliasing occurs in sampling
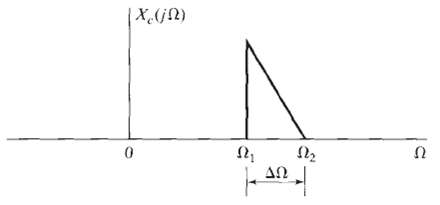
A complex-valued continuous-time signal xc(t) has the Fourier transform shown in figure, where (?2 ? ?1) = ??. This signal is sampled to produce the sequence x[n] = xc(nT). (a) Sketch the Fourier transform X(ej?) of the sequence x[n] for T = ? / ?2. (b) What is the lowest sampling frequency that
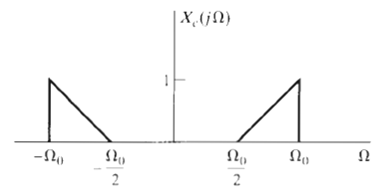
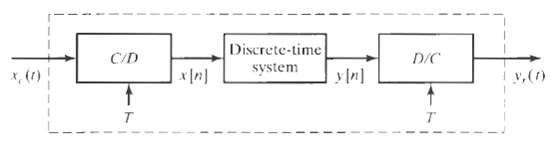
A continuous-time signal xc(t), with Fourier transform Xc (jΩ) shown in Figure, is sampled with sampling period T = 2π / Ω0 to form the sequence x[n] xc(nT).(a) Sketch the Fourier transform X(ejω) for |ω| < π.(b) The signal x[n] is to be transmitted across a digital channel. At the
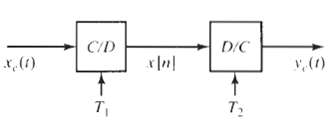
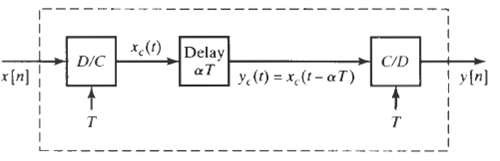
In Figure, assume that Xc(j?) = 0, |?| ? ? / T1. For the general case in which T1 ? T2?in the system, express yc(t) in terms of xc(t). Is the basic relationship different for T1 > T2 and T12?
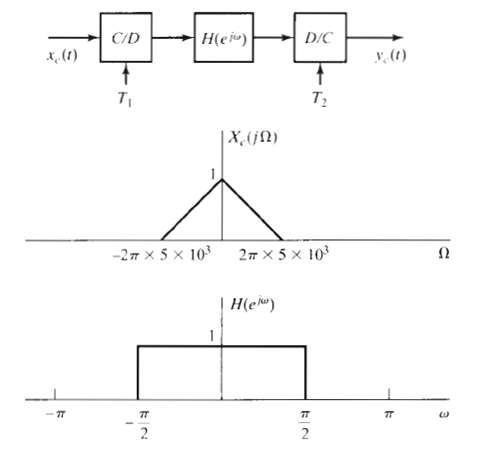
In the system of Figure, Xc(j?) and H(ej?) are as shown. Sketch and label the Fourier transform of yc(t) for each of the following cases: (a) 1/T1 = 1/T2 = 104? (b) 1/T1 = 1/T2 = 2 ? 104 (c) 1/T1 = 2 ? 104. 1/T2 = 2 ? 104? (d) 1/T1 = 104, 1/T2 = 2 ? 104
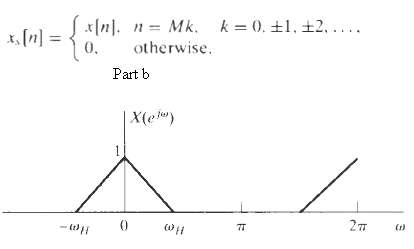
Consider the sequence x[n] Whose Fourier transform X(ej?) is shown in Figure,? and? xd[n] = xs[Mn] = x[Mn] (a) Sketch Xs(ej?) and Xd(?j?) for each of the following cases: (i) M = 3, ?H = ? / 2 (ii) M = 3, ?H = ? / 4 (b) What is the maximum value of ?H that will avoid aliasing when M = 3?
Using Parseval’s theorem, briefly explain why the amplitude of the Fourier transform changes during down sampling but not during upsampling.
(a) Is the system in Figure linear for a given choice of T? If so, provide a brief argument demonstrating that it satisfies linearity. If not, provide a counterexample. (b) Is the system in figure time invariant for a given choice of T? If so, provide a brief argument demonstrating that it
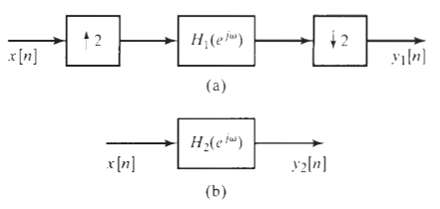
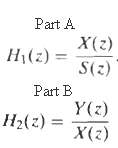
Consider the systems shown in Figure. Suppose that H1(ej?) is fixed and known. Find H2(ej?), the frequency response of an LTI system, such that y2[n] = y1[n] if the inputs to the systems are the same.
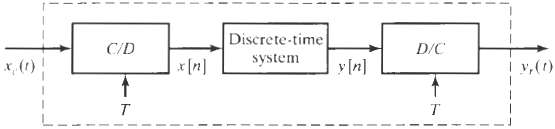
In the system of Figure, assume that the discrete-time system is linear and time invariant and that Xc(j?) = 0 for |?| ? 4000?. Determine the largest possible value for T and the corresponding frequency response H(ej?) for the discrete-time system such that
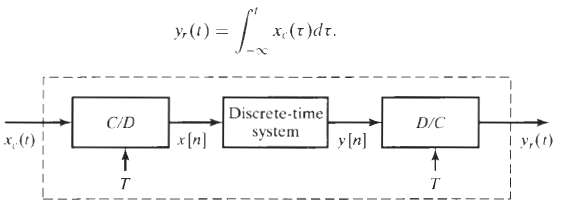
In the system of Figure, assume that Xc(j?) = 0 for |?| > ?/ T. Determine and plot the magnitude and phase of the frequency response of the discrete-time LTI system such that the output yr(t) is the running integral of the input, i.e.,
A bandlimited continuous-time signal is known to contain a 60-Hz component, which we want to remove by processing with the system of Figure, where T = 10?4 (a) What is the highest frequency that the continuous-time signal can contain if aliasing is to be avoided? (b) The discrete-time system to be
Consider the system in Figure with Xc(j?) = 0 for |?| ? 2? (100) and the discrete-time system a squarer, i.e., y[n] = x2[n]. What is the largest value of T such that yc(t) = x2c(t)?
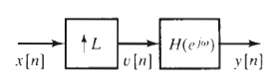
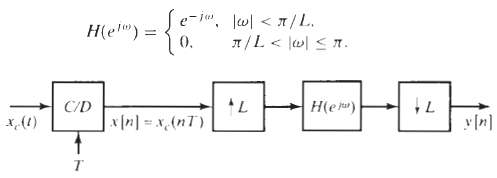
For the LTI system in Figure,? H(ej?) = e?j?/2. ? ? ? ? ? ? ?| ? | ????(half-sample delay). (a) Determine a choice for T and hc(t) in the system of Figure so that the system in Figure with H(ej?) as specified is equivalent to the system in Figure. (b) Determine and sketch y[n] when the input
(a) Is the system in Figure linear for a given choice of T? If so, provide a brief argument demonstrating that it satisfies linearity. If not, provide a counterexample. (b) Is the system in figure time invariant for a given choice of T? If so, provide a brief argument demonstrating that it
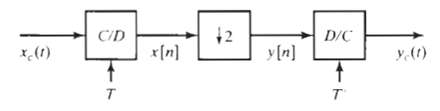
In Figure, x[n] = xc(nT) and y[n] = x[2n]. (a) Assume that xc(t) has a Fourier transform such that Xc(j?) = 0, |?| > 2? (100). What value of T is required so that? X(ej?) = 0, ? ? ? ??/2 (b) How should T? be chosen so that yc(t) = xc(t)?
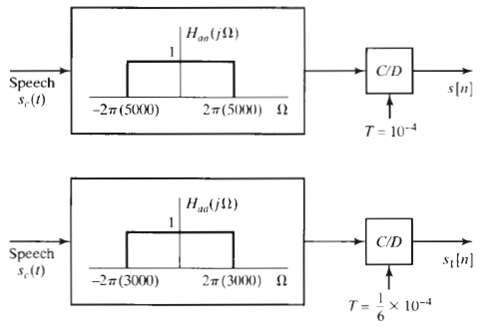
Suppose that you obtained a sequence s[n] by filtering a speech signal sc(t) with a continuous-time lowpass filter with a cutoff frequency of 5 kHz and then sampling the resulting output at a 10-kHz rate, as shown in Figure. Unfortunately, the speech signal sc(t) was destroyed once the sequence
Consider the system shown in Figure, where? Sketch yc(j?) if Xc(j?) is as shown in Figure
The system shown in Figure, approximately interpolates the sequence x[n] by a factor L. Suppose that the linear filter has impulse response h[n] such that h[n] = h[? n] and h[n] = 0 for |n| > (RL ? 1), where R and L are integers; i.e., the impulse response is symmetric and of length (2RL ? 1)
In the system of Figure,? Xc(j?) = 0,? ? ?? |?| ? ?/T. ?and? How is y[n] related to the input signal xc(t)?
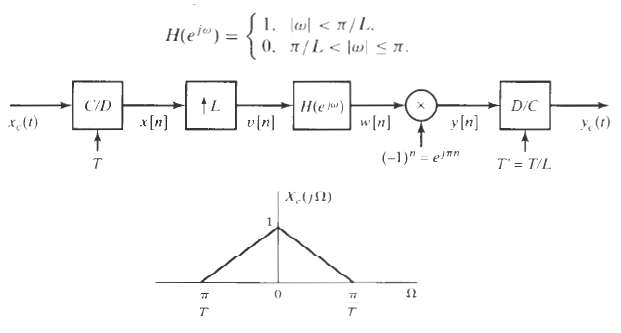
Consider the system shown in Figure. The input to this system is the bandlimited signal whose Fourier transform is shown in Figure with ?0?= ? / T. The discrete-time LTI system in Figure has the frequency response shown in Figure. (a) Sketch the Fourier transforms X(ej?), Xe(ej?), ye(e j?), and
Let xc(t) bee a real-valued continuous-time signal with highest frequency 2? (250) radians/second. Furthermore, let yc(t) = xc(t ? 1 /1000). (a) If x[n] = xc(n/500), is it theoretically possible to recover xc(t) from x[n]? Justify your answer. (b) If y[n] = yc(n/500), is it theoretically possible
Consider the system shown in Figure for discrete-time processing of the continuous-time input signal gc(t). The input signal gc(t) is of the form gc(t) = fc(t) + ec(t).where the Fourier transforms of fc(t) and ec(t) are shown in Figure. Since the input signal is not bandlimited, a continuous-time
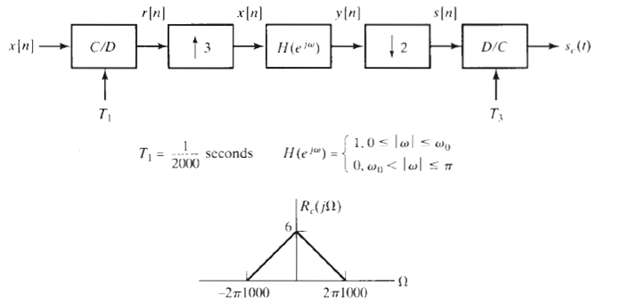
Consider the system given in Figure. You may assume that Rc(j?) is bandlimited: i.e., Rc(j?) = 0, |?| ? 2? (1000), as shown in the figure. (a) Sketch R(ej?) and X(ej?). (b) Choose nonzero values for ?0 and T2 such that? y[n] = ?rc(nT2) for some nonzero constant ?. (you do not have to determine the
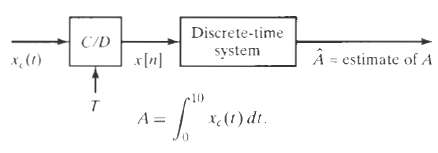
Assume that the continuous-time signal xc(t) in Figure is exactly bandlimited and exactly time limited so that xc(t) = 0 for t 10 seconds and? Xe(j?) = 0 for |?| ? 2? ? 104 While no continuous-time signal can be exactly bandlimited and time limited, the assumption that a signal satisfies both
Consider the system in Figure with H0(z), H1(z), and H2(z) as the system functions of LTI systems. Assume that x[n] is an arbitrary stable complex signal without any symmetry properties. (a) Let H0(z) = 1, H1?(z) = z?1, and H2(z) = z?2, Can you reconstruct x[n] from y0[n], y1[n], and y2[n]? If so,
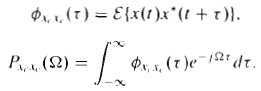
In many applications, discrete-time random signals arise through periodic sampling of continuous-time random signals. We are concerned in this problem with a derivation of the sampling theorem for random signals. Consider a continuous-time, stationary, random process defined by the random variables
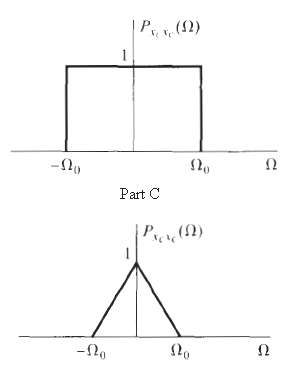
Consider a continuous-time random process xc(t) with a band limited power density spectrum Pxcxc?(?) as depicted in Figure. Suppose that we sample xc(t) to obtain the discrete-time random process x[n] = xc(nT). (a) What is the autocorrelation sequence of the discrete-time random process? (b) For
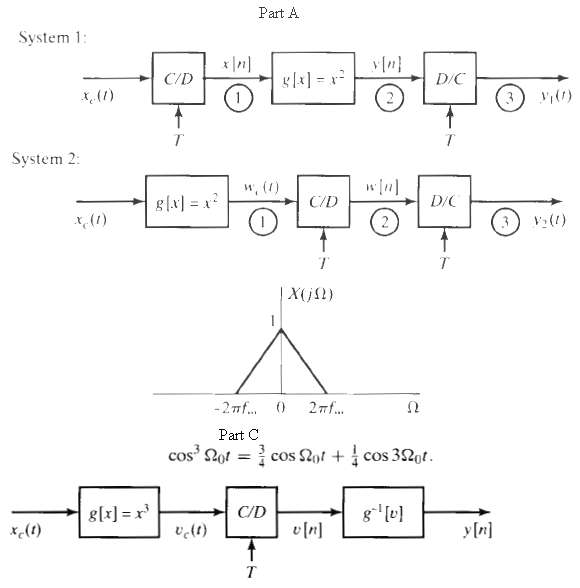
This problem explores the effect of interchanging the order of two operations on a signal, namely, sampling and performing a memoryless nonlinear operation. (a) Consider the two signal-processing systems in Figure, where the C/D and D/C converters are ideal. The mapping g[x] = x2 represents a
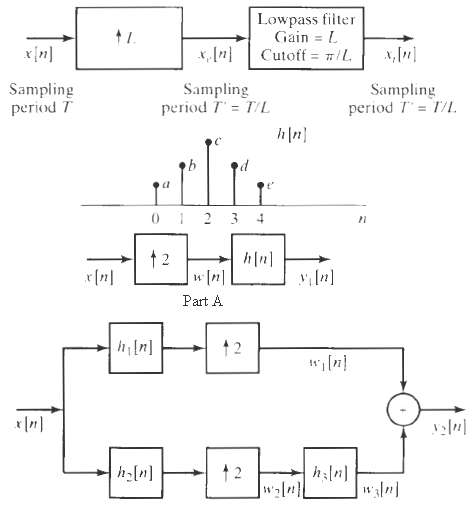
Figure depicts a system for interpolating a signal by a factor of L, where and the lowpass filter interpolates between the nonzero values of xe[n] to generate the upsampled or interpolated signal xi[n]. When the lowpass filter is ideal, the interpolation is referred to as baldlimited
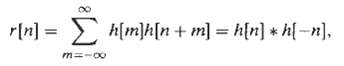
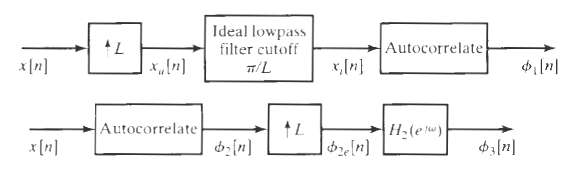
We wish to compute the autocorrelation function of an upsampled signal, as indicated in Figure. It is suggested that this can equivalently be accomplished with the system of Figure. Can H2(ej?) be chosen so that ?3[n] =??1[n]? If not, why not? If so, specify H2(e?j?).?
We are interested in upsampling a sequence by a factor of 2, using a system of the form of Figure. However, the lowpass filter in that figure is to be approximated by a five-point filter with impulse response h[n] indicated in Figure. In this system, the output y1[n] is obtained by direct
Consider a real-valued sequence x[n] for which X(ejω) = 0, π/3 ≤ |ω| ≤ π. One value of x[n] may have been corrupted, and we would like to approximately or exactly recover it. With x[n] denoting the corrupted signal, x[n] = x[n] for n ≠ n0,and
In Section 4.8.1, we considered the use of prefiltering to avoid aliasing. In practice, the antialiasing filter cannot be ideal. However, the nonideal characteristics can be at least partially compensated for with a discrete-time system applied to the sequence x[n] that is the output of the C/D
Suppose sc(t) is a speech signal with the continuous-time Fourier transform Sc(jΩ) shown in Figure. We obtain a discrete-time sequence sr[n] from the system shown in Figure, where H(ejω) is an ideal discrete-time lowpass filter with cutoff frequency ωc and a gain of unity throughout the
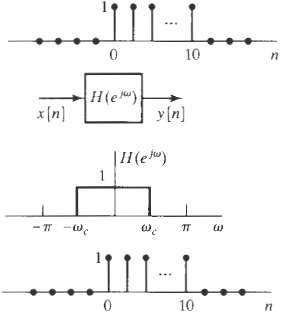
In the system shown in Figure, H(ej?) is an ideal lowpass filter. Determine whether for some choice of input x[n] and cutoff frequency ?c the output can be the pulse
Consider a stable linear time-invariant system with input x[n] and output y[n]. The input and output satisfy the difference equation, y[n – 1] – 10/3 y[n] + y[n + 1] = x[n].(a) Plot the poles and zeros in the z-plane.(b) Find the impulse response h[n]
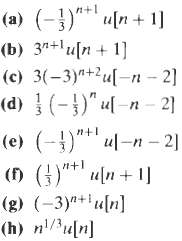
Consider a linear time-invariant discrete-time system for which the input x[n] and output y[n] are related by the second-order difference equation y[n ? 1] + 1/3 y[n ? 2] = x[n]. ?From the following list, choose two possible impulse responses for the system:
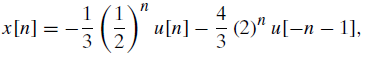
When the input to a linear time-invariant system is x[n] = (1/2)n u[n] + (2)n u[–n – 1],the output isy[n] = 6(1/2)n u[n] – 6 (3/4)n u[n].(a) Find the system function H(z) of the system. Plot the poles and zeros of H(z), and indicate the region of convergence.(b) Find the impulse response
Consider a system described by a linear constant-coefficient difference equation with initial-rest conditions. The step response of the system is given by y[n] = (1/3)n u[n] + (1/4)n u[n] + u[n].(a) Determine the difference equation.(b) Determine the impulse response of the system.(c)
The following information is known about a linear time-invariant system: (i) The system is causal.(ii) When the input is the z-transform of the output is,(a) Find the z-transform of x[n].(b) What are the possible choices for the region of convergence of Y(z)?(c) What ate the possible
When the input to a linear time-invariant system isx [n] = 5u[n], the output is y[n] = [2 (½)n + 3 (– ¾)n] u[n].(a) Find the system function H(z) of the system. Plot the poles and zeros of H(z), and indicate the region of convergence.(b) Find the impulse response of the system
A causal linear time-invariant system is described by the difference equation y[n] = 3/2 y[n – 1] + y[n – 2] + [n – 1].(a) Find the system function H(z) = Y(z) / X(z) for this system. Plot the poles and zeros of H(z), and indicate the region of convergence.(b) Find the impulse
Consider a linear time-invariant system with input x[n] and output y[n] for which y[n – 1] – 5/2 y[n] + y[n + 1] = x[n].The system may or may not be stable or causal. By considering the pole-zero pattern associated with the preceding difference equation, determine three possible choice for
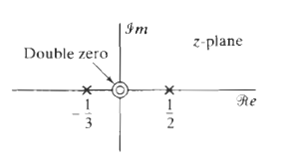
If the system function H(z) of a linear time-invariant system has a pole-zero diagram as shown in Figure and the system is causal, can the inverse system Hi(z), where H(z) Hi(z) = 1, be both causal and stable? Clearly justify your answer,
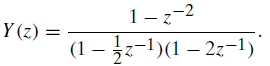
The system function of a linear time-invariant system has the pole-zero Plot shown in Figure. Specify whether each of the following statements is true, is false, or can not be determined from the information given.? (a) The system is stable. (b) The system is causal. (c) If the system is causal,
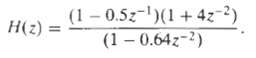
A discrete-time causal LTI system has the system function.(a) Is the system stable?(b) Find expressions for a minimum-phase system H1(z) and an all-pass system Hap(z) such that H(z) = H1(z) Hap(z).
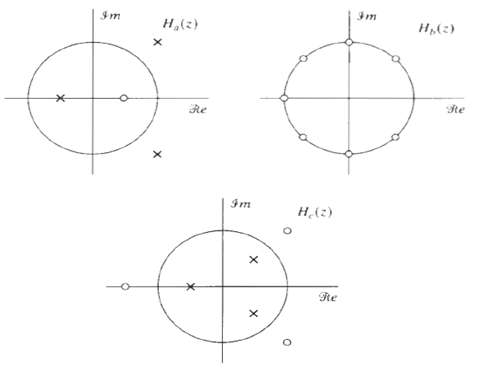
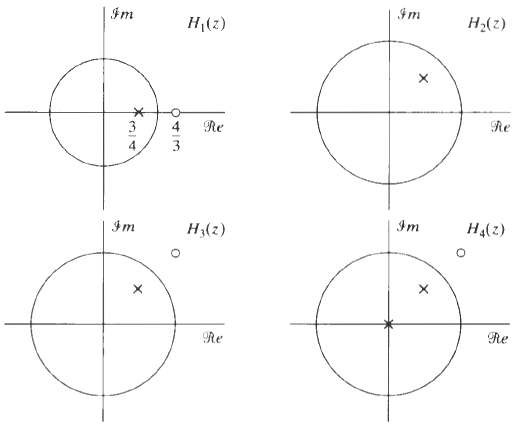
Figure shows the pole-zero plots for four different LTI systems. Based on these plots, state whether or not each system is an all-passsystem.
Determine the group delay for 0
Consider the class of discrete-time filters whose frequency response has the form? H(ej?) = |H(ej?)|e?jaw, ?where |H(ej?)| is a real and nonnegative function of ? and ? is a real constant. As discussed in Section 5.7.1, this class of filters is referred to as linear-phase filter. Consider also the
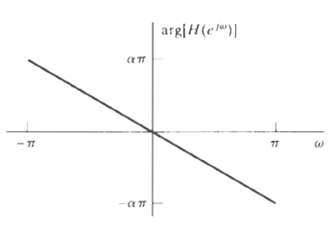
Figure plots the continuous-phase arg[H(ej?)] for the frequency response of a specific LTI system, where? arg[H(ej?)] = ??? for |?| ?Is the impulse response h[n] of this system a causal sequence? If the system is definitely causal, or if it is definitely not causal, give a proof. If the
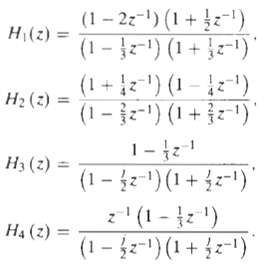
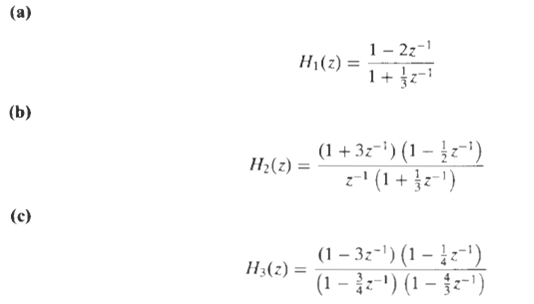
For each of the following system functions, state whether ar not it is a minimum-phase system. Justify youranswers:
For each of the following system functions Hk(z), specify a minimum-phase system function Hmin(z) such that the frequency-response magnitudes of the two systems are equal, i.e., |Hk(ejω)| = | Hmin(ejω) |.
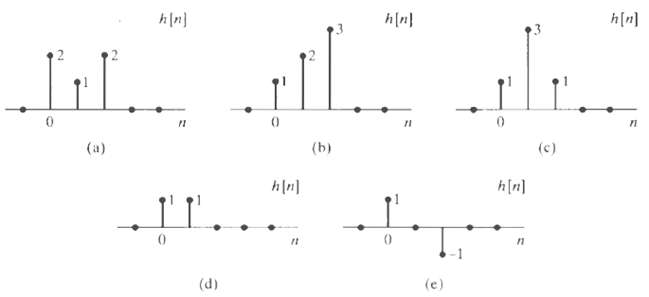
Figure shows the impulse responses for several different LTI systems. Find the group delay associated with each system.:
Figure shows just the zero locations for several different system functions. For each plot, state whether the system function could be a generalized linear-phase system implemented by a linear constant-coefficient difference equation with realcoefficients,
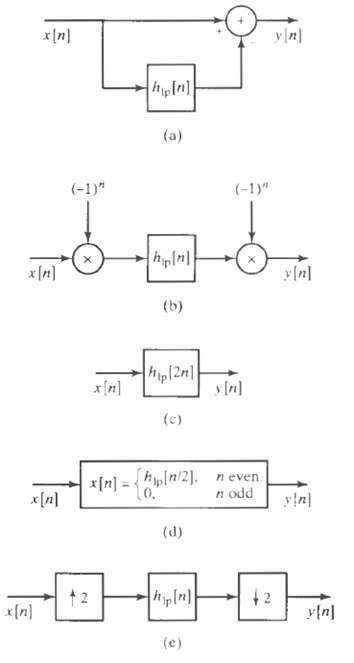
Let h1p[n] denote the impulse response of an ideal lowpass filter with unity passband gain and cutoff?frequency ?c = ?/4. Figure shows five systems, each of which is equivalent to an ideal LTI frequency-selective filter. For each system shown, sketch the equivalent frequency response, indicating
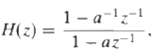
Consider a causal linear time-invariant system with system function where ? is real. (a) Write the difference equation that relates the input and the output of this system. (b) For what range of values of ? is the system stable? (c) For ? = ?, plot the pole-zero diagram and shade the region of
(a) For each of the four types of causal linear phase FIR filers discussed in Section 5.7.3, determine whether the associated symmetry imposes any constrain on the frequency response at ω = 0 and/or ω = π. (b) For each of the following types of desired filter, indicate which of the four FIR
Let x[n] be a causal, N-point sequence that is zero outside the range 0 ? n ? N ? 1. When x[n] is the input to the causal LTI system represented by the difference equation? y[n] ? ? y[n ? 2] = x[n ? 2] ? ? x[n], the output is y[n], also a causal, N-point sequence. (a) Show that the causal LTI
Is the following statement true or false? Statement: It is not possible for a noncausal system to have a positive constant group delay; i.e., grd[H(ejω)] = τ0 > 0.If the statement is true, give a brief argument justifying it. If the statement is false, provide a counterexample.
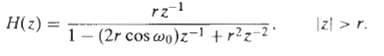
Consider the z-transform Assume first that ?0 ? 0. (a) Draw a labeled pole-zero diagram and determine h[n]. (b) Repeat part (a) when ?0 = 0. This is known as a critically damped system.
An LTI system with impulse response h1[n] is an ideal lowpass filter with cutoff frequency ωc = π/2. The frequency response of the system is H1(ejω). Suppose a new LTI system with impulse response h2[n] is obtained from h1[n] by h2[n] = (–1)n h1[n]Sketch the frequency response
The system function H(z) of a causal linear time-invariant system has the pole-zero configuration shown in Figure, It is also known that H(z) = 6 when z = 1. (a) Determine H(z).(b) Determine the impulse response h[n] of the system.(c) Determine the response of the system to the following input
The system function of a linear time-invariant system is given byIt is known that the system is not stable and that the impulse response is two sided.(a) Determine the impulse response h[n] of the system.(b) The impulse response found in Part (a) can be expressed as the sum of a causal impulse
A signal x[n] is processed by a linear time-invariant system H(z) and then downsampled by a factor of 2 to yield y[n], as shown in Figure. The pole-zero plot for H(z) is shown in Figure.(a) Determine and sketch h[n], the impulse response of the system (z).(b) A second system is shown in Figure, in
Consider a linear time-invariant system whose system function is (a) Suppose the system is known to be stable. Determine the output y[n] when the input x[n] is the unit step sequence. (b) Suppose the region of convergence of H(z) includes z = ?. Determine y[n] evaluated at n= 2 when x[n] is as
The Fourier transform of a stable linear time-invariant system is purely real and is shown in Figure. Determine whether this system has a stable inverse system.
A sequence x[n] is the output of a linear time-invariant system whose input is s[n]. This system is described by the difference equation? x[n] = s[n] ? e? 8? s[n ? 8],? where 0 (a) Find the system function, and Plot is poles and zeros in the z-plane. Indicate the region of convergence. (b) We wish
Consider a linear time-invariant system whose impulse response is h[n] = (1/2)n u[n] + (1/3)n u[n]. The input x[n] is zero for n < 0, but in general, may be non zero for 0 ≤ n ≤ ∞. We would like to compute the output y[n] for 0 ≤ n ≤ 109, and in particular, we want to compare
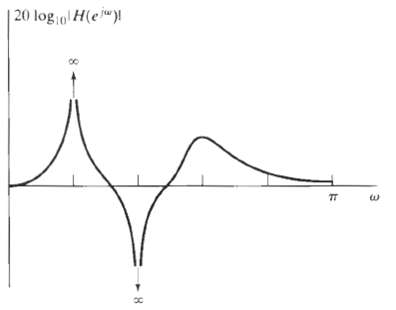
Consider a causal linear time-invariant system with system function H(z) and real impulse response. H(z) evaluated for z = ej? is shown in Figure. (a) Carefully sketch a pole-zero plot for H(z) showing all information about the pole and zero locations that can be inferred from the figure. (b) What
A causal linear time-invariant system has the system function(a) Write the difference equation that is satisfied by the input and the output of the system.(b) Plot the pole-zero diagram and indicate the region of convergence for the system function.(c) Sketch |H(ejω) |.(d) State whether the
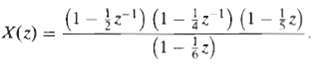
Consider a causal sequence x[n] with the z-transform. ?For what values of a is ?n?x[n] a real minimum-phase sequence?
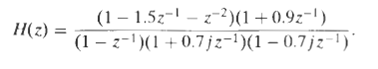
Consider the linear time-invariant system whose system function is ?H(z) = (1 ? 0.9ej0.6??z?1)(1 ? 0.9e?j0.6? z?1)(1 ? 1.25ej0.8??z?1)(1 ? 1.25e?j0.8? z?1). (a) Find all causal system function that result in the same frequency-response magnitude as H(z) and for which the impulse responses are real
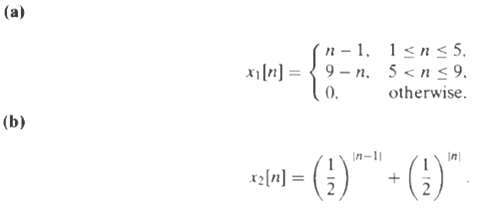
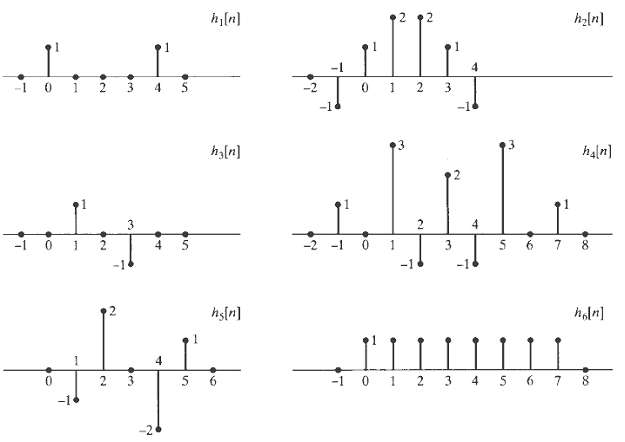
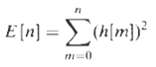
Shown in Figure are eight different finite-duration sequences. Each sequence is four points long. The magnitude of the Fourier transform is the same for all sequences. Which of the sequences has all the zeros of its z-transform inside the unit circle?
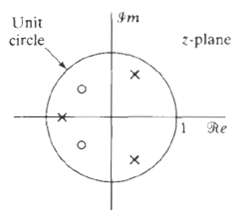
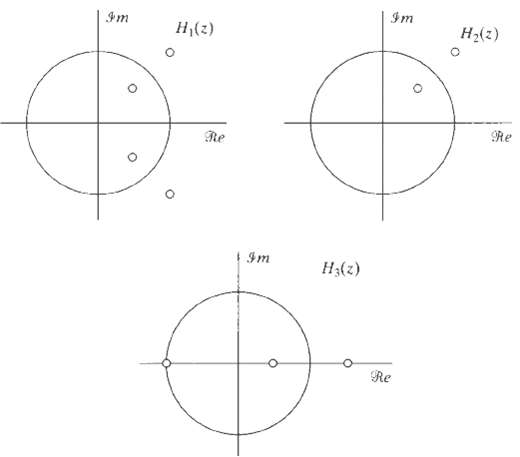
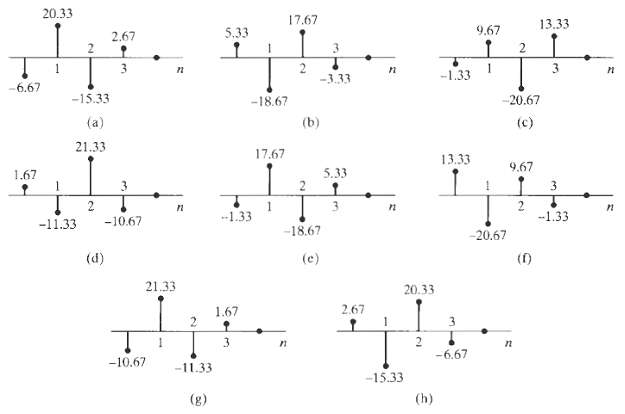
Each of the pole-zero plots in Figure, together with the specification of the region of convergence, describes a linear time-invariant system with system function H(z). In each case, determine whether any of the following statements are true. Justify your answer with a brief statement or a
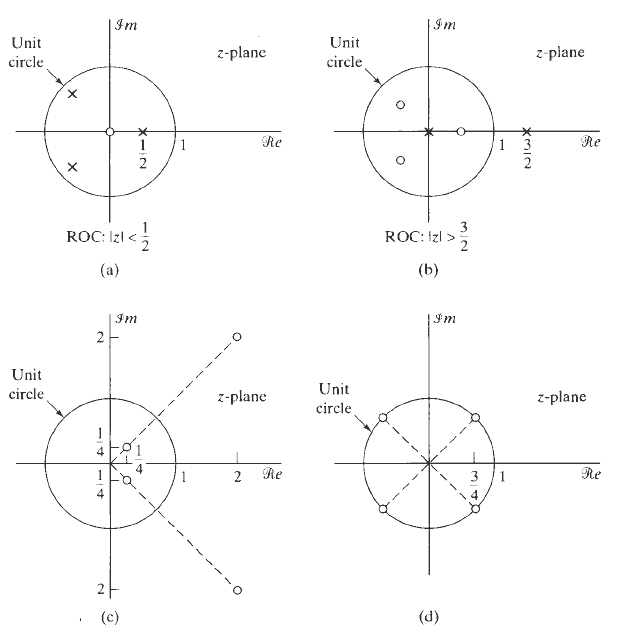
Figure shows two different interconnections of three systems. The impulse responses h1[n], h2[n], and h3[n], are as shown in Figure. Determine whether system A and/or system B is a generalized linear-phasesystem.
The overall system of Figure is a discrete-time linear time-invariant system with frequency response H(ej?) and impulse response h[n]. (a) H(ej?) can be expressed in the form? H(ej?) = A(ej?)ej?(?), with A(ej?) real. Determine and sketch A(ej?) and ?(?) for |?| (b) Sketch h[n] for the
Let h1p[n] denote the impulse response of an FIR generalized linear-phase lowpass filter. The impulse response hhp[n] of an FIR generalized linear-phase highpass filter can be obtained by the transformation hhp[n] = (–1)n h1p[n]. If we decide to design a highpass filter using this
A causal linear time-invariant discrete-time system has system function (a) Find expressions for a minimum-phase system H1(z) and all-pass system Hap(z) such that? H(z) = H1(z) Hap(z). (b) Find expressions for a different minimum-phase system H2(z) and a generalized linear-phase FIR system Hlin(z)
(a) A minimum-phase system has system function Hmin(z) is such that Hmin(z) Hap(z) = Hlin(z),where Hap(z) is an all-pass system function and Hlin(z) is a causal generalized linear-phase system. What does this information tell you about the poles and zeros of H min(z)?(b) A generalized
Consider an LTI system with input x[n] and output y[n]. When the input to the system is Determine the frequency response H(ejω) and the impulse response h[n] for the LTI system.
Figure shows the pole-zero plots for three different causal LTI systems with real impulse responses. Indicate which of the following properties apply to each of the systems pictured: stable, IIR, FIR, minimum phase, all-pass, generalized linear phase, positive group delay at all ?.
A causal linear time-invariant discrete-time system has system function and impulse response h1[n]. (a) Is S1 causal? Explain. (b) Let g[n] = h1[n] * h2[n]. Specify an h2[n] such that g[n] has at least nine nonzero samples and g[n] can be considered the impulse response of a causal LTI system with
The LTI systems H1(ej?) H2(ej?) are generalized linear-phase systems. Which, if any, of the following systems also must be generalized linear-phase systems
This problem concerns a discrete-time filter with a real-valued impulse response h[n]. Determine whether the following statement is true or false: Statement: If the group delay of the filter is a constant for 0 < ω < π, then the impulse response must have the property that
The system function HII(z) represents a type II FIR generalized linear-phase system with impulse response hII[n]. This system is cascaded with an LTI system whose system function is (1 – z–1) to produce a third system with system function H(z) and impulse response h[n]. Prove that the overall
In this problem, you will consider three different LTI systems. All three are causal and have real impulse responses. You will be given additional information about each system. Using this information, state as much as possible about the poles and zeros of each system function and about the length
The following three things are known about a signal x[n] with z-transform X(z):(i) x[n] is real valued and minimum phase,(ii) x[n] is zero outside the interval 0 ≤ n ≤ 4,(iii) X(z) has a zero at z = ½ ejπ/4 and a zero at z = ½ ej3π/4. Based on this information, answer the following
Let S1 be a causal and stable LTI system with impulse response h1[n] and frequency response H1(ejω). The input x[n] and output y[n] for S1 are related by the difference equation y[n] – y[n – 1] + ¼ y[n – 2] = x[n].(a) If an LTI system S2 has a frequency response given by H2(ejω) =
The following three things are known about a signal x[n] with z-transform X(z):(i) x[n] is real valued and minimum phase,(ii) x[n] is zero outside the interval 0 ≤ n ≤ 4,(iii) X(z) has a zero at z = ½ ejπ/4 and a zero at z = ½ ej3π/4. Based on this information, answer the following
In this problem, we demonstrate that, for a rational z-transform, a factor of the form (z – z0) and a factor of the form z/(z – z*0) contribute the same phase.(a) Let H(z) = z – 1/α, where α is real and 0 < α < 1. Sketch the poles and zeros of the system, including an indication of
Prove the validity of the following two statements:(a) The convolution of two minimum-phase sequences is also a minimum-phase sequence.(b) The sum of two minimum-phase sequences is not necessarily a minimum-phase sequence. Specifically, give an example of both a minimum-phase and a non
A sequence is defined by the relationship ?where h[n] is a minimum-phase sequence and? r[n] = 4/3(?)n u[n] + 4/3 2n u[? n ? 1], (a) Find R(z) and sketch the pole-zero diagram.? (b) Determine the minimum-phase sequence h[n] to within a scale factor of ? 1. Also, determine the z-transform H(z) of
Let hmin[n] denote a minimum-phase sequence with z-transform Hmin(z). If h[n] is a causal non-minimum-phase sequence whose Fourier transform magnitude is equal to |Hmin(ej?)|, Show that? |h[0]| min[0]|. ?(Use the initial-value theorem together with Eq. (5.103).)
Showing 500 - 600
of 1744
1
2
3
4
5
6
7
8
9
10
11
12
13
14
15
Last
Step by Step Answers
![Interpolator Decimator Lowpass filter Gain = 1 Cutoff = 1!M ä,(1)] Lowpass filter Gain = L. Cutoff = niL | x,
] x;(n}](https://dsd5zvtm8ll6.cloudfront.net/si.question.images/images/question_images/1549/9/6/6/9635c629e73cb1e01550013890836.jpg)
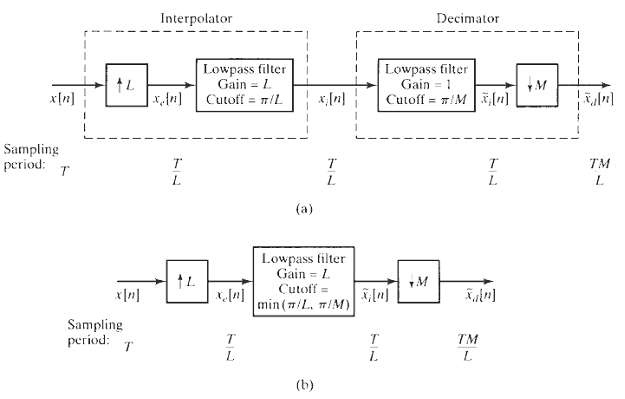


![Lowpass filter Gain = L x{n] *, [n} x, [1] Cutoff = #/L Sampling period T' = T/L Sampling period T Sampling period T' =](https://dsd5zvtm8ll6.cloudfront.net/si.question.images/images/question_images/1549/9/7/5/7735c62c0dd2d1531550022698612.jpg)
![| S,(jN) -2п . 4000 2т 4000 0(гаd/s) | sy[n] Не) s[n] м [4]](https://dsd5zvtm8ll6.cloudfront.net/si.question.images/images/question_images/1549/9/7/6/2425c62c2b2953fb1550023169301.jpg)
![24 y[n] = w[2n] H(z) w [n] x[n] Im Unit Mth-order pole at z = 0, M2 2 and M is an integer circle z-plane Re 2 24 G(2) x[](https://dsd5zvtm8ll6.cloudfront.net/si.question.images/images/question_images/1550/1/3/0/7985c651e6e0d8381550130796770.jpg)

![x[n] = 5 the corresponding output is sin(0.4n) лп + 10 cos(0.57n). sin[0.3л (n - 10)1 л (п — 10) y[n] = 10](https://dsd5zvtm8ll6.cloudfront.net/si.question.images/images/question_images/1550/1/3/3/1545c6527a2370b71550133153742.jpg)