New Semester
Started
Get
50% OFF
Study Help!
--h --m --s
Claim Now
Question Answers
Textbooks
Find textbooks, questions and answers
Oops, something went wrong!
Change your search query and then try again
S
Books
FREE
Study Help
Expert Questions
Accounting
General Management
Mathematics
Finance
Organizational Behaviour
Law
Physics
Operating System
Management Leadership
Sociology
Programming
Marketing
Database
Computer Network
Economics
Textbooks Solutions
Accounting
Managerial Accounting
Management Leadership
Cost Accounting
Statistics
Business Law
Corporate Finance
Finance
Economics
Auditing
Tutors
Online Tutors
Find a Tutor
Hire a Tutor
Become a Tutor
AI Tutor
AI Study Planner
NEW
Sell Books
Search
Search
Sign In
Register
study help
engineering
telecommunication engineering
Communication Systems 4th Edition Simon Haykin - Solutions
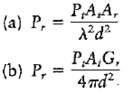
Equation (8.14) is one formulation of the Friis free-space equation. Show that this equation can also be formulated in the following equivalent forms: where Pt is the transmitted power, At is the effective area of the transmitting antenna, ? is the carrier wavelength, d is the distance of the
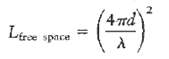
From the mathematical definition of the free-space loss we see that it is dependent on the carrier wavelength A or frequency f. How can this dependence on wavelength or frequency be justified in physicalterms?
In a satellite communication system, the carrier frequency used on the uplink is always higher than the carrier frequency used on the downlink. Justify the rationale for this choice.
A continuous-wave (CW) beacon transmitter is located on a satellite in geostationary orbit. The beacon’s 12 GHz output is monitored by an earth station positioned 40,000 km from the satellite. The satellite transmitting antenna is a 1m dish with an aperture efficiency of 70 percent, and the earth
Consider a 75-Ω resistor maintained at “room temperature” of 290K. Assuming a bandwidth of 1 MHz, calculate the following;(a) The root-mean-square (RMS) value of the voltage appearing across the terminals of this resistor due to thermal noise.(b) The maximum available noise power delivered to
In this problem, we revisit Example 8.1 based on the receiver configuration of Figure. Suppose that a lossy waveguide is inserted between the receiving antenna and the low-noise amplifier. The waveguide loss is 1 dB, and its physical temperature is 290K. Recalculate the effective noise temperature
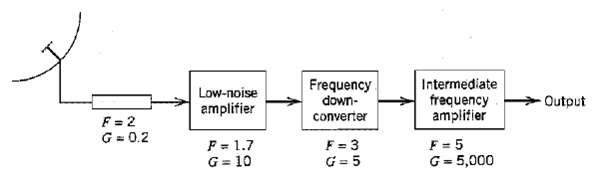
Consider the receiver of Figure which consists of a ios.sy waveguide, low-noise RF amplifier, frequency down-converter mixer), and IF amplifier. The figure includes the noise figures and power gains of these four components. The antenna temperature is 50K. (a) Calculate the equivalent noise
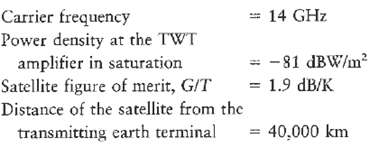
In this problem we address the uplink power budget of the digital satellite communication system considered in Example 8.2. The parameters of the link are as follows: Carrier frequency? ? ? ? ? ? ? ? ? ? ? ? ? ? ? ? ? ? ? ? ? ? ? ? ? ? ? ? ? ? ? ? ? ? ? ? ? ? ? ? ? ? ? ? ?= 14 GHz Power density at
The downlink C/N0 ratio in a direct broadcast satellite (DBS) system is estimated to be 85dB-Hz. The specifications of the link are:Satellite ELRP
Both wireless communications and satellite communications rely on radio propagation for their operations. Summarize(a) The similarities of these two multiuser communication systems, and(b) The major differences that distinguish them from each other.
In wireless communication systems, the carrier frequency on the uplink reverse link) smaller than the carrier frequency on the downlink (forward link), justify the rationale for this choice.
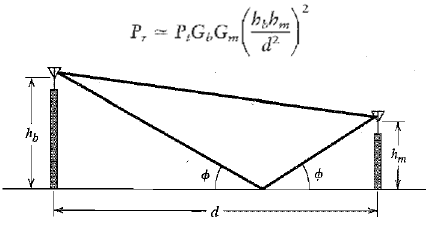
Figure depicts the direct (line-of-sight) and indirect (reflected) paths of a radio link operating over a plane earth. The heights of the transmitting antenna at the base station and the receiving antenna of a mobile unit are hb and hm respectively. Assume the following:The reflection coefficient
The two-path model defined by the impulse response h(t) = a1 δ(t – τ1) + a2 exp(–jθ) δ(t – τ2) is frequently used in the analytic treatment of wireless communication systems. The model parameters are the delay times τ1 and τ2 the uniformly distributed phase 8, and the real coefficients
In the RAKE receiver illustrated in Figure each correlator is synchronized by inserting the right delay into the received signal.(a) Show that, in theory, the same result is obtained by inserting the right delay into the reference signal (i.e., pseudo-noise sequence).(b) In practice, the preferred
Consider the array signal processor of Figure where there are only two users (N = 2) and the array consists of two elements (M = 2). Construct the subspace W for this problem. Hence, using a signal-space diagram, illustrate the computation of the weight characterizing the array signal processor.
In this problem we derive the complex LMS algorithm. Referring to figure and starting with the instantaneous cost function where e[n] is the error signal and M is the number of antenna elements, do the following:(a) Determine the derivative of the cost function) with respect to the kth elemental
A practical limitation of an adaptive antenna array using the LMS algorithm is the dynamic range over which the array can operate. This limitation is due to the fact that the speed of response of the weights in the [MS algorithm is proportional to the average signal power at the array input.(a)
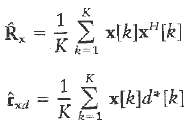
In this problem we derive the direct matrix inversion algorithm for adjusting the weights of an adaptive antenna array. To do so, we revisit the derivation of the Wiener filter presented. (a) Show that Rxw = rxd where Rx is an estimate of the correlation matrix of the input vector x[k] and rxd is
Let p denote the probability of some event. Plot the amount of information gained by the occurrence of this for 0 < p < 1.
A source emits one of four possible symbols during each signaling interval. The symbols occur with the probabilities: P0 = 0.4, P1 = 0.3, P2 = 0.2, P3 = 0.1 find the amount of information gained by observing the source emitting each of these symbols.
A source emits one of four symbols s0, s1, s2, and s3 with probabilities 1/3, 1/6, 1/4, and 1/4, respectively. The successive symbols emitted by the source are statistically independent. Calculate the entropy ol the source.
Let X represent the outcome of a single roll of a fair die. What is the entropy of X?
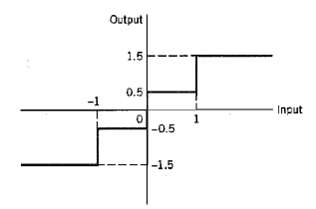
The sample function of a Gaussian process of zero mean and unit variance is uniformly sampled and then applied to a uniform quantizer having the input-output amplitude characteristic shown in Figure. Calculate the entropy of the quantizer output.
Consider a discrete memory less source with source alphabet L {s0, s1,. . . , sk–1) and source statistics (p0, p1, ... pk–1,) The nth extension of this source is another discrete memory less source with source alphabet Ln’ = {σ0, σ1, .., σM – 1), where M = Kn. Let P(σi) denote the
Consider a discrete memory less source with source alphabet L = {s0, s1, s2,) and source statistics [0.7, 0.15, 0.15].(a) Calculate the entropy of the source.(b) Calculate the entropy of the second-order extension of the source.
It may come as a surprise, but the number of bits needed to store text is much less than that required to store its spoken equivalent. Can you explain the reason for it?
Consider a discrete memory less source whose alphabet consists of K equiprobable symbols.(a) Explain why the use of a fixed-length code for the representation of such a source is about as efficient as any code can be.(b) What conditions have to be satisfied by K and the code-word length for the
Consider the four codes listed below:(a) Two of these four codes are prefix codes. Identify them, and construct their individual decision trees.(b) Apply the Kraft—McMillan inequality to codes 1, II, Ill, and IV. Discuss your results in light of those obtained in part (a).
Consider a sequence of letters of the English alphabet with their probabilities of occurrence as given here:Letter a i l m
A discrete memory less source has an alphabet of seven symbols whose probabilities of occurrence are as described here:Symbol s0 s1 s2 s3
Consider a discrete memory less source with alphabet (s0, s1, s2,) and statistics {0.7, 0.15, 0.15) for its output.(a) Apply the Huffman algorithm to this source. Hence, show that the average code word length of the l-Iuffm.an code equals 1.3 bits/symbol.(b) Let the source be extended to order two.
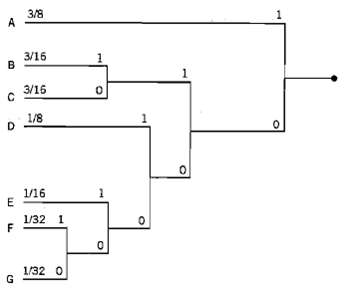
Figure shows a Huffman tree. What is the code word for each of the symbols A, B, C, D, E, F, and C represented by this Huffman tree? What are their individual codeword lengths?
A computer executes four instructions that are designated by the code words (00, 01, 10, 11). Assuming that the instructions are used independently with probabilities (1/2, 1/8, 1/8, 1/4), calculate the percentage by which the number of bits used for the instructions may be reduced by the use of an
Consider the following binary sequence it 10 1001100010110 100Use the Lempel—Ziv algorithm to encode this sequence. Assume that the binary symbols 0 and 1 are already in the codebook.
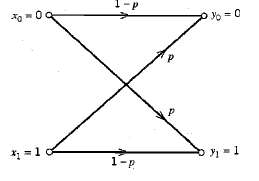
Consider the transition probability diagram of a binary symmetric channel shown in figure. The input binary symbols 0 and 1 occur with equal probability. Find the probabilities of the binary symbols 0 and 1 appearing at the channel output.
Repeat the calculation in Problem, assuming that the input binary symbols 0 and 1 occur with probabilities 1/4 and 3/4, respectively.
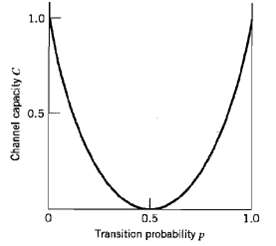
Consider a binary symmetric channel characterized by the transition probability p. Plot the mutual information of the channel as a function of p1, the a priori probability of symbol 1 at the channel input; do your calculations for the transition probability p = 0, 0.1, 0.2, 0.3, 0.5.
Figure depicts the variation of the channel capacity of a binary Symmetric channel with the transition probability p. Use the re-suits of problem to explain this variation.
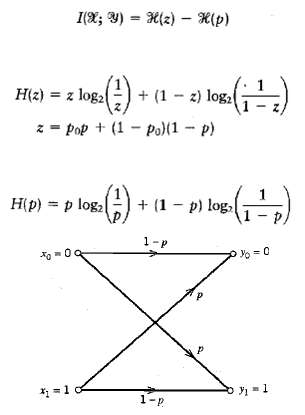
Consider the binary symmetric channel described in Figure. Let Po denote the prob. ability of sending binary symbol x0 = 0, and let p1 = 1 ? P0 denote the probability of sending binary symbol x1 = 1, Let p denote the transition probability of the channel (a) Show that the mutual information between
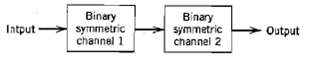
Two binary symmetric channels are connected in cascade, as shown in figure. Find the overall channel capacity of the cascaded connection, assuming that both channels have the same transition probability diagram shown in figure.
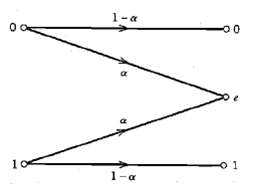
The binary erasure channel has two inputs and three outputs as described in figure. The inputs are labeled 0 and 1, and the outputs are labeled 0, 1, and e. A traction a of the incoming bits are erased by the channel. Find the capacity of the channel.
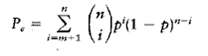
Consider a digital communication system that uses a repetition code for the channel encoding/decoding. In particular, each transmission is repeated times, where n = 2m + 1 is an odd integer. The decoder operates as follows, if in a block of n received hits, the number of 0s exceeds the number of
Let X1, X2, . . , Xn denote the elements of a Gaussian vector X. The Z are independent with mean ?i and variance ?2i, i = 1, 2,. . . , n. Show that the differential entropy of the vector X equals what does h(X) reduce to if the variances are equal?
A continuous random variable X is constrained to a peak magnitude M that is ? M (a) Show that the differential entropy of X is maximum when it is uniformly distributed, as shown by (b) Show that the maximum differential entropy of X is log2 2M.
Prove the properties given in Equations 979) to (9.81) for the mutual information I(X; Y).
Consider the continuous random variable Y defined by Y = X + N where X and N are statistically independent. Show that the conditional differential entropy of Y, given X equals h(Y|X) = h(N) where h(N) is the differential entropy of N.
A voice-grade channel of the telephone network has a bandwidth of 3.4 kHz.(a) Calculate the information capacity of the telephone channel for a signal-to-noise ratio of 30dB.(b) Calculate the minimum signal-to-noise ratio required to support information transmission through the telephone channel at
Alphanumeric data are entered into a computer from a remote terminal through a grade telephone channel. The channel has a bandwidth of 3.4 kHz and output signal noise ratio of 20 dB. The terminal has a total of 128 symbols. Assume that the Symbols are equiprobable and the successive transmissions
A black-and-white television picture may be viewed as consisting of approximately 3 x 10⁵ elements, each of which may occupy one of 10 distinct brightness levels with equal probability. Assume that (1) the rate of transmission is 30 picture frames per second, and (2) the signal-to-noise ratio is 30
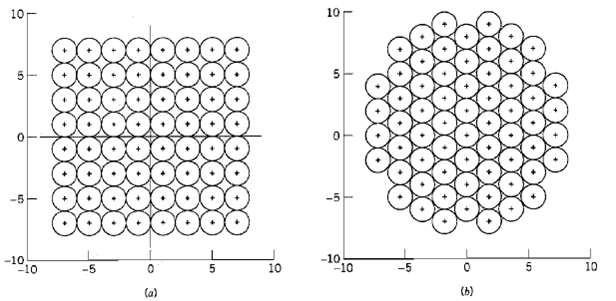
In this problem, we continue with Example 9.9. Suppose that the tightly packed constellation of Figure b is scaled upward so that the transmitted signal energy per symbol is maintained at the same average value as that consumed by the 64-QAM square constellation of Figure a. Construct the new
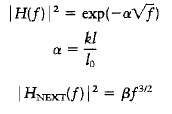
The squared magnitude response of a twisted-pair channel can be modeled as |H(f)|2 = exp(-a?f), the constant a is defined by where k is a constant depending on wire gauge, l is a reference line length, and Jig the actual length of the twisted pair under study. The squared magnitude response of the
Equation (9.138) for the signal-to-noise ratio (SNR) of a vector quantizer includes the SNR formula of Equation (3.33) for standard pulse-code modulation as a special case for which k = 1. Justify the validity of this inclusion.
All practical data compression and data transmission schemes lie between two limits set by the rate distortion function and the channel capacity theorem. Both of these theorems involve the notion of mutual information, but in different ways. Elaborate on the issues raised by these two statements.
In this problem, we revisit Example 9.12, which deals with coded binary antipodal signaling over an additive white Gaussian noise (AWGN) channel. Starting with Equation (9.112) and the underlying theory, develop a software package for computing the mini mum Eb/N0 required for a given bit error
Suppose that nonlinear devices are available for which the output current i o and input voltage v i are related by i o = a1vi + a3 v3i, where a= and a3 are constant. Explain how these devices may b used to provide:(a) A product modulator and(b) An amplitude modulator.
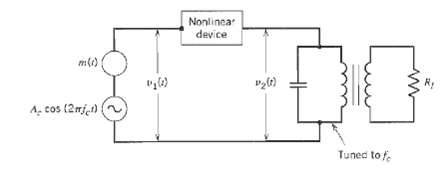
Figure shows the circuit diagram of a square-law modulator. The signal applied to the non linear devices is relatively weak, such that it can be represented by a square law: v2 (t) = a1v1 (t) + a2v21 (t), where a1 and a2 are constant, and v1 (t) is the input voltage and v2 (t) is the output
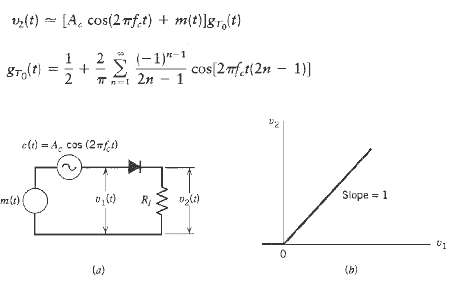
Figure a show the circuit diagram of a switching modulator. Assume that the carrier wave c (t) applied to the diode is large in amplitude, so that the diode acts like an ideal switch: it presents zero impedance when forward biased (i.e. c (t) > 0). We may thus approximate the transfer
Consider the AM signal s (t) = Ac [1 + μ cos (2πƒmt)] cos (2πƒct) produced by a sinusoidal modulating signal of frequency ƒm. Assume that the modulation factor μ = 2, and the carrier frequency ƒc is much greater than ƒm. The AM signal s (t) is applied to an ideal envelope
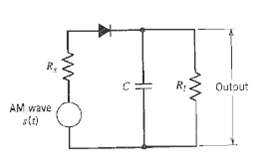
Figure shows the circuit diagram of an envelope detector. It consists simply of a diode and resistor-capacitor (RC) filter. On a positive half-cycle of the input signal, the diode is forward-biased and the capacitor C charges up rapidly to the peak value of the input signal. When the input signal
Consider a square-law detector; using a nonlinear device whose transfer characteristics is defined by v2 (t) = a1v1 (t) + a2v21 (t), where a1 and a2 are constant, v1 (t) is the input, and v2 (t) is the output. The input consists of the AM wave.(a) Evaluate the output v2 (t).(b) Find the conditions
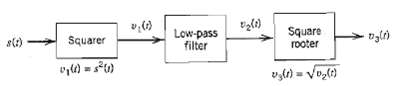
The AM signal s (t) = Ac [1 + ka m (t)] cos (2??ct) is applied to the system in Figure. Assuming that | ka m (t) | ? W and that the carrier frequency ?c > 2W show that m (t) can be obtained from the square-rooter output v3 (t).
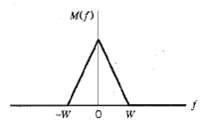
Consider a message signal m (t) with the spectrum shown in Figure. The message bandwidth W = 1 kHz. This signal is applied to a product modulator, together with a carrier wave Ac cos (2??ct), producing the DSB-SC modulator signal s (t). The modulated signal is next applied to a coherent detector.
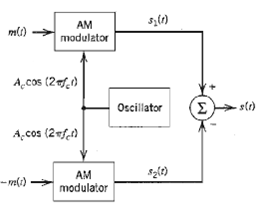
Figure shown the circuit diagram of a balanced modulator, the input applied to the top AM modulator is m (t), where as that applied to the lower AM modulator is – m (t); these two modulators have the same amplitude sensitivity. Show that the output s (t) of the balanced modulator consists of a
A DSB-SC modulated signal is demodulated by applying it to a coherent detector.(a) Evaluate the effect of a frequency error Δƒ in the local carrier frequency of the detector, measured with respect to the carrier frequency of the incoming DSB-SC signal.(b) For the case of a sinusoidal modulating
Consider the DSB-SC signal s (t) = Ac cos (2πƒct) m (t), where Ac cos (2πƒct) is the carrier wave and m (t) is the message signal. This modulated signal is applied to a square-law device characterized by y (t) = s2 (t). The output y (t) is next applied to a narrowband filter with a pass-band
Consider the quadrature-carrier multiplex system of Figure. The multiplexed signal s (t) produced at the transmitter output in Figure a is applied to a communication channel of frequency response H (ƒ). The output of this channel is, in turn, applied to the receiver input in Figure b. Prove that
Suppose that in the receiver of the quadrature-carrier multiplex system of Figure b, the local carrier available for demodulation has a phase error Φ with respect to the carrier source used in the transmitter and receiver, show that this phase error will cause cross-talk to arise between the two
A particular version of AM stereo uses quadrature multiplexing. Specifica.lly, the carrier Ac cos (2πƒct) is used to modulate the sum signal m= (t) = V0 + ml (t) + mr (t), where V0 is a DC offset included for the purpose of transmitting the carrier component, ml (t) is the left-hand audio signal,
Using the message signal m (t) = 1/1 + t2, determine and sketch the modulated waves for the following methods of modulation:(a) Amplitude modulation with 50 percent modulation.(b) Double sideband-suppressed carrier modulation.(c) Single sideband modulation with only the upper sideband
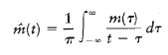
The Hilbert transform of a Fourier transformable signal m (t), denoted by m (t), is defined by below, in the frequency domain, we have M (?) = -j sgn (?) M (?), where m (t) ? M (?), m (t) ? M (?), and sgn (?) is the signum function. Using the definition of the Hilbert transform, show that a
The local oscillator used for the demodulation of an SSB signal s (t) has a frequency error Δƒ measured with respect to the carrier frequency ƒc used to generate s (t). Otherwise, there is perfect synchronism between this oscillator in the receiver and the oscillator supplying the carrier wave
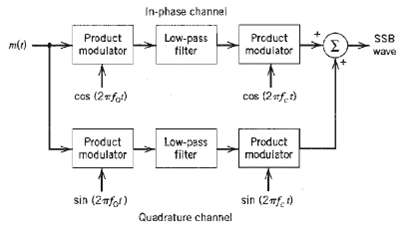
Figure shows the block diagram of Weaver?s method for generating SSB modulated waves. The message (modulating) signal m (t) is limited to the band ?a | ? | ?b. The auxiliary carrier applied to the first pair of product modulators has a frequency ?0, which lies at the center of this band, as shown
The spectrum of a voice signal m (t) is zero outside the interval ƒa < | ƒ | < ƒb. To ensure communication privacy, this signal is applied to a scramble that consists of the following cascade of components: product modulator, high pass filter, second product modulator, and low-pass filter.
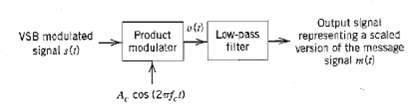
In this problem we derive Equation that defines the frequency response HQ (?) of the filter that operates on the message signal m (t) to produce m` (t) for VSB modulation. The signal m` (t), except for a scaling factor, constitutes the quadrature components of s (t), to do the derivation, we apply
The single-tone modulating signal m (t) = Am cos (2πƒmt), is used to generate the VSB signal, where a is a constant, less than unity, representing the attenuation of the upper side frequency.(a) Find the quadrature component of the VSB signal s (t).(b) The VSB signals, plus the carrier Ac cos
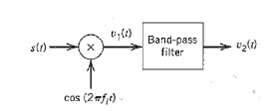
In this program we study the idea of mixing in a super heterodyne receiver. To be specific, consider the block diagram of the mixer shown in Figure that consists of a product modulator with a local oscillator of variable frequency ?b followed by a band-pass filter. The input signal is an AM wave of
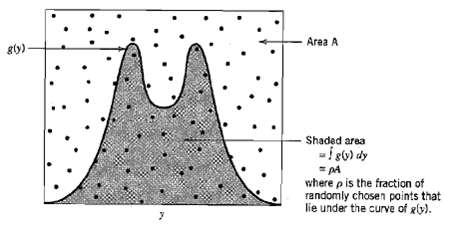
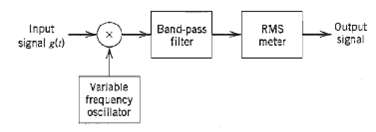
Figure shows the block diagram of a beterodyne spectrum analyzer. It consists of a variable-frequency oscillator, multiplier, band-pass filter, and root mean square (RMS) meter. The oscillator has amplitude A and square over the range ?0 to ?0 + W, where ?0 is the mid-band frequency of the filter
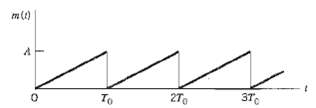
Sketch the PM and FM waves produced by the saw tooth wave shown inFigure.
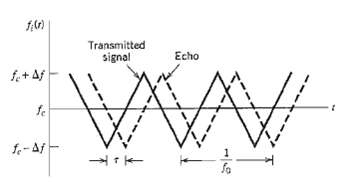
In frequency-modulated radar, the instantaneous frequency of the transmitted carrier is varied as in Figure, which is obtained by using a triangular modulating signal. The instantaneous frequency of the received echo signal is shown dashed in Figure, where ? is the round-trip delay time. The
The instantaneous frequency of a sine wave is equal to ƒc –Δƒ for | t | < T/2, and ƒc for | t | < T/2. Determine the spectrum of this frequency-modulated wave.
Single-sideband modulation may be viewed as a hybrid form of amplitude modulation and frequency modulation. Evaluate the envelope and instantaneous frequency of an SSB wave for the following two cases:(a) When only the upper sideband is transmitted.(b) When only the lower sideband is transmitted.
Consider a narrow b and FM signal approximately defined by s (t) = Ac cos (2??ct) ? ?Ac sin (2??ct) sin (2??mt) (a) Determine the envelope of this modulated signal. What is the ratio of the maximum to the minimum value of this envelope? Plot this ratio versus ?, assuming that ? is restricted to the
The sinusoidal modulating wave m (t) = Am cos (2πƒmt) is applied to a phase modulator with phase sensitivity kp. The unmodulated carrier wave has frequency ƒc and amplitude Ac.(a) Determine the spectrum of the resulting phase-modulated signal, assuming that the maximum phase deviation βp = k p,
Suppose that the phase-modulated signal of Problem has an arbitrary value for the maximum phase deviation βp. This modulated signal is applied to an ideal band-pass filter with mid-band frequency ƒc and a pass-band extending from ƒc – 1.5ƒm to ƒc + 1.5ƒm. Determine the envelope, phase, and
A carrier wave is frequency-modulated using a sinusoidal signal of frequency ƒm and amplitude Am.(a) Determine the values of the modulation index β for which the carrier component of the FM signal is reduced to zero. For this calculation you may use the values of J0 (β) given in Table.(b) In a
An FM signal with modulation index β = 1 is transmitted an ideal band-pass filter with mid-band frequency ƒc and bandwidth 5ƒm, where ƒc is the carrier frequency and ƒm is the frequency of the sinusoidal modulating wave. Determine the magnitude spectrum of the filter output.
A carrier wave of frequency 100 MHz is frequency-modulated by a sinusoidal wave of amplitude 20 volts and frequency 100 kHz. The frequency sensitivity of the modulator is 2.3 kHz per volt.(a) Determine the approximate bandwidth of the FM signal, using Carson’s rule.(b) Determine the bandwidth by
Consider a wideband PM signal produced by a sinusoidal modulating wave Am cos (2πƒmt), using a modulator with a phase sensitivity equal to k p radius per volt.(a) Show that if the maximum phase deviation of the PM signal is large compared with one radian, the bandwidth of the PM signal varies
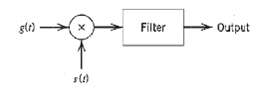
Figure shows the block diagram of a real-time spectrum analyzer working on the principle of frequency modulation. The given signal g (t) and a frequency-modulated signal s (t) are applied to a multiplier and the output g (t) s (t) is fed into a filter of impulse response b (t). The s (t) is linear
An Fm signal with a frequency deviation of 10 kHz at a modulation frequency of 5 kHz is applied to two frequency multiplier connected is cascade. The first multiplier doubles the frequency and the second multiplier triples the frequency. Determine the frequency deviation and the modulation index of
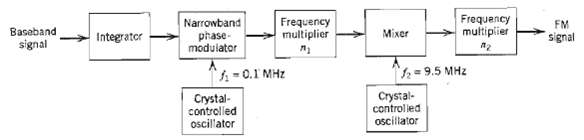
Figure shows the block diagram of a wideband frequency modulator using the indirect method. This modulator is used to transmit audio signals containing frequencies in the range of 100 Hz to 15 kHz by a crystal-controlled oscillator. A second crystal-controlled oscillator supplies a sinusoidal wave
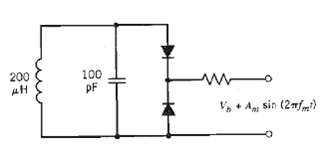
Figure shows the frequency-determining network of a voltage-controlled oscillator. Frequency modulation is provided is produced by applying the modulating signal Am sin (2??mt) plus a bias Vb to a pair of varactor diodes connected across the parallel combination of a 200-?H inductor and 100-pF
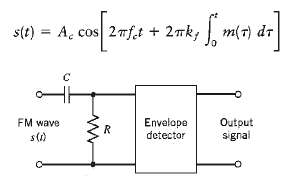
The Fm signal is applied to the system shown in Figure consisting of a high-pass RC filter and an envelope detector. Assume that (a) The resistance R is small compared with the reactance of the capacitor C for all significant frequency components of s (t), and (b) The envelope detector does not
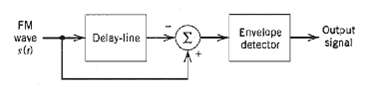
Consider the frequency demodulation scheme in Figure in which the incoming FM signal s (t) is passed through a delay line that produces a phase-shift of ?/2 radians at the carrier frequency ?c. The delay-line output is subtracted from the incoming FM signal, and the resulting composite signal is
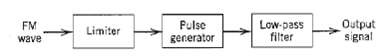
Figure shows the block diagram of a zero-crossing detector for demodulating an FM signal, its consist of a limiter, a pulse generator for producing a short pulse at each zero-crossing of the input, and a low-pass filter for extracting the modulating wave. (a) Show that the instantaneous frequency
Suppose that the received signal is an FM system contains some residual amplitude modulation of positive amplitude a (t), as shown by s (t) = a (t) cos [2??ct + ? (t)], where ?c is the carrier frequency. The phase ? (t) is related to the modulating signal m (t) by, where k? is a constant. Assume
(a) Let the modulated wave s (t) in Problem 2.42 be applied to a hard limiter, whose output z (t) is defined by below, show that the limiter output may be expressed in the form of a Fourier series as follows:(b) Suppose that the limiter output is applied to a band-pass filter with a pass-band
(a) Consider an FM signal if carrier frequency ƒc, which is produced by a modulating signal m (t). Assume that ƒc is large enough to justify treating this FM signal as a narrowband signal. Find an approximate expression for its Hilbert transform.(b) For the special case of a sinusoidal modulating
The single sideband version of angle modulation is defined by s (t) = exp [-Φ (t)] cos (2πƒct + Φ (t)], where Φ (t) is the Hilbert transform of the phase function Φ (t), and ƒc is the carrier frequency.(a) Show that the spectrum of the modulated signal s (t) contains no frequency components
Evaluate the autocorrelation functions and cross-correlation functions of the in-phase and quadrature components of the narrowband noise at the coherent detector input for(a) The DSB-SC system,(b) An SSB system using the lower sideband, and(c) An SSB system using the upper sideband.
Showing 100 - 200
of 1744
1
2
3
4
5
6
7
8
9
10
11
12
13
14
15
Last
Step by Step Answers
![|e[n]|2 Awr[n] = -µÎJ[k]](https://dsd5zvtm8ll6.cloudfront.net/si.question.images/images/question_images/1549/2/7/8/2175c581c098a73f1549325015555.jpg)
![z(t) = sgn[s(t)] s(t) style=](https://dsd5zvtm8ll6.cloudfront.net/si.question.images/images/question_images/1549/0/9/0/9075c55405b237491549090907733.jpg)

