New Semester
Started
Get
50% OFF
Study Help!
--h --m --s
Claim Now
Question Answers
Textbooks
Find textbooks, questions and answers
Oops, something went wrong!
Change your search query and then try again
S
Books
FREE
Study Help
Expert Questions
Accounting
General Management
Mathematics
Finance
Organizational Behaviour
Law
Physics
Operating System
Management Leadership
Sociology
Programming
Marketing
Database
Computer Network
Economics
Textbooks Solutions
Accounting
Managerial Accounting
Management Leadership
Cost Accounting
Statistics
Business Law
Corporate Finance
Finance
Economics
Auditing
Tutors
Online Tutors
Find a Tutor
Hire a Tutor
Become a Tutor
AI Tutor
AI Study Planner
NEW
Sell Books
Search
Search
Sign In
Register
study help
engineering
telecommunication engineering
Digital Signal Processing 3rd Edition Jonh G. Proakis, Dimitris G.Manolakis - Solutions
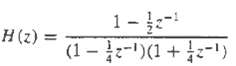
Consider the system (a) Draw all possible realizations of the system. (b) Suppose that we implement the filter with fixed-point sign-and-magnitude fractional arithmetic using (b + 1) bits (one bit is used for the sign). Each resulting product is rounded into b bits. Determine the variance of the
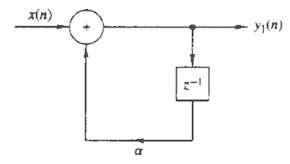
The first-order filter shown in figure is implemented in four-bit (including sign) fixed-point two?s-complement fractional arithmetic. Products are rounded to four-bit representation. Using the input x(n) = 0.10?(n), determine: (a) The first five outputs if a = 0.5. Does the filter go into a limit
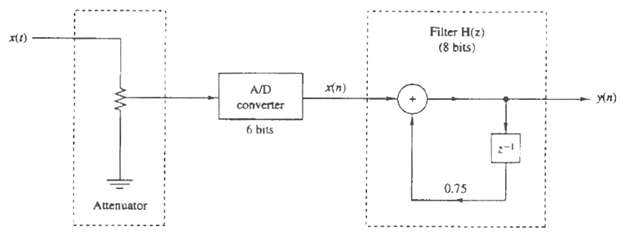
The digital system shown in figure uses a six-bit (including sign) fixed-point two?s-complement A/D converter with rounding, and the filter H(z) id implemented using eight-bit (including sign) fixed-point two?s-complement fractional arithmetic with rounding. The input x(t) is zero-mean uniformly
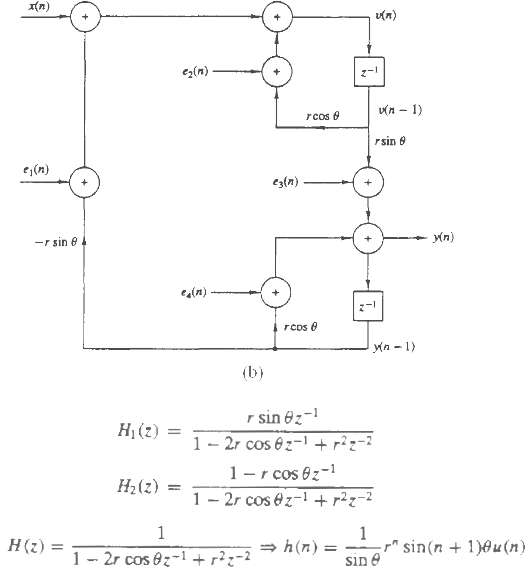
Shown in Figure is the coupled-form implementation of a two-pole filter with poles at x = re?j0. There are four real multiplications per output point. Let ei(n), i = 1, 2, 3, 4 represent the round-off noise in fixed-point implementation of the filter. Assume that the noise sources are zero-mean
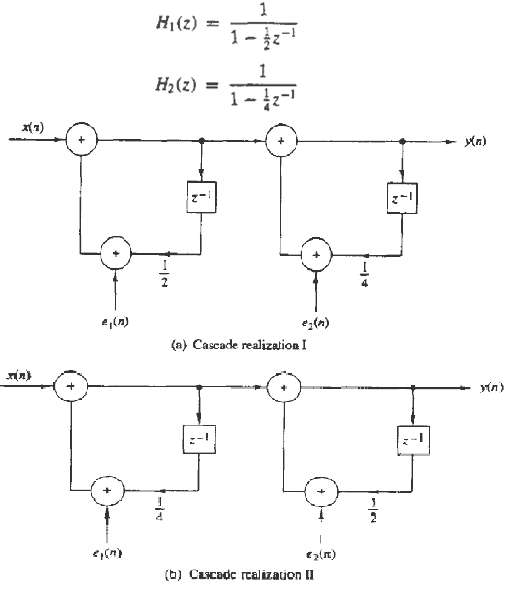
Determine the variance of the round-off noise at the output of the two cascade realization of the filter shown if figure with system function H(z) =H1(z)H2(z)
Quantization effects in direct-form FIR filters consider a direct-form realization of an FIR filter of length M. Suppose that the multiplication of each coefficient with the corresponding signal sample is performed in fixed-point arithmetic with b bits and each product is rounded to b bits.
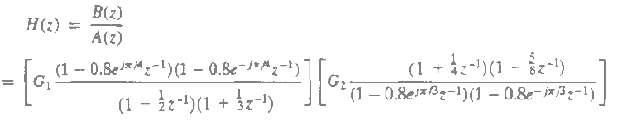
Consider the system specified by the system function(a) Choose G1 and G2 so that the gain of each second-order section at ? = 0 is equal to 1.(b) Sketch the direct form 1, direct firm2 and cascade realizations of the system.(c) Write a program that implements the direct form 1 and direct form 2,
Consider the system given in problem 7.55 with G1 = G2 = 1.(a) Determine a lattice realization for the systemH(z) = B(z)(b) Determine a lattice realization for the systemH(z) = 1/A(z)
Consider the system given in Problem 7.55.(a) Determine the parallel-form structure and write a program for its implementation.(b) Sketch a parallel structure using second-order coupled-form state-space sections.(c) Write a program for the implementation of the structure in part (b).(d) Verify the
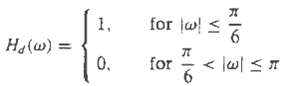
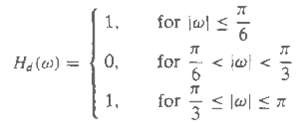
Design an FIR linear phase, digital filer approximating the ideal frequency response(a) Determine the coefficients of a 25-tap filter based on the window method with a rectangular window.(b) Determine and plot the magnitude and phase response of the filter.(c) Repeat parts (a) and (b) using the
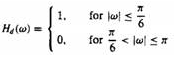
Repeat Problem 8.1 for a bandstop filter having the ideal response
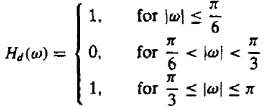
Redesign the filter of Problem 8.1 using the Hanning and Blackman windows.Design an FIR linear phase, digital filter approximating the ideal frequency response (a) Determine the coefficients of a 25-tap filter based on the window method with a rectangular window.(b) Determine and plot the
Redesign the filter of Problem 8.2 using the Hanning and Blackman windows.Problem 8.2Repeat Problem 8.1 for a bandstop filter having the ideal responseProblem 8.1Design an FIR linear phase, digital filter approximating the ideal frequency response (a) Determine the coefficients of a 25-tap
Determine the unit sample response {h(n)} of a linear-phase FIR filter of length M = 4 for which the frequency response at ω = 0 and ω = π/2 is specified as Hr(0) = 1 Hr(π/2) = ½
Determine the coefficients {H(n)} of a linear-phase FIR filter of length M = 15 which has a symmetric unit sample response and a frequency and a frequency response that satisfies thecondition
Repeat the filter design problem in Problem 8.6 with the frequency responsespecifications
The ideal analog differentiator is described byYa(t) = dxa(t)/dtWhere xa(t) is the input and ya(t) the output signal.(a) Determine its frequency response by exciting the system with the input xa(t) = ej2πF1.(b) Sketch the magnitude and phase response of an ideal analog differentiator band-limited
Use the window method with a Hamming window to design a 21-tap differentiator as shown in figure. Compute and plot the magnitude and phase response of the resultingfilter.
Use the matched-z transformation to converter the analog filter with system function H(s) = s + 0.1/(s + 0.1)2 + 9into a digital IIR filter. Select T = 0.1 and compare the location of the zeros in H(z) with the location of the zeros obtained by applying the impulse invariance method in the
Converter the analog bandpass filter designed in example 8.4.1 into a digital filter by means of the bilinear transformation. Thereby derive the digital filter characteristic obtained in Example 8.4.2 by the alternative approach and verify that the bilinear transformation applied to analog filter
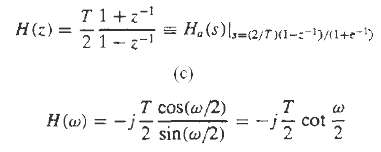
An ideal analog integrator is described by the system function Ha(s) = 1/s. A digital integrator with system function H(z) can obtained by use of the bilinear transformation. That is, (a) Write the difference equation for the digital integrator relating the input x(n) to the output y(n). (b)
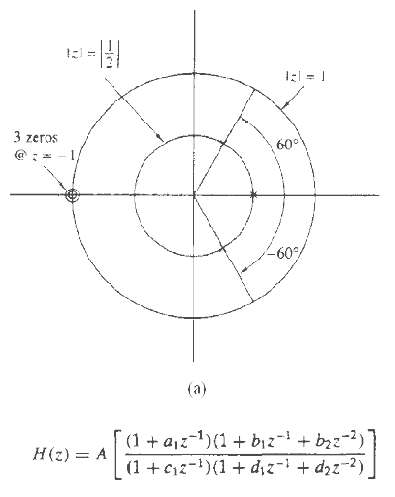
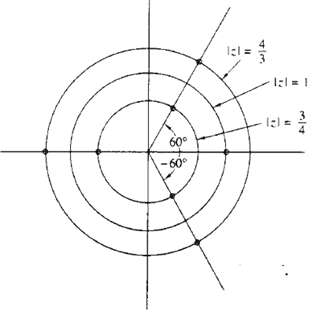
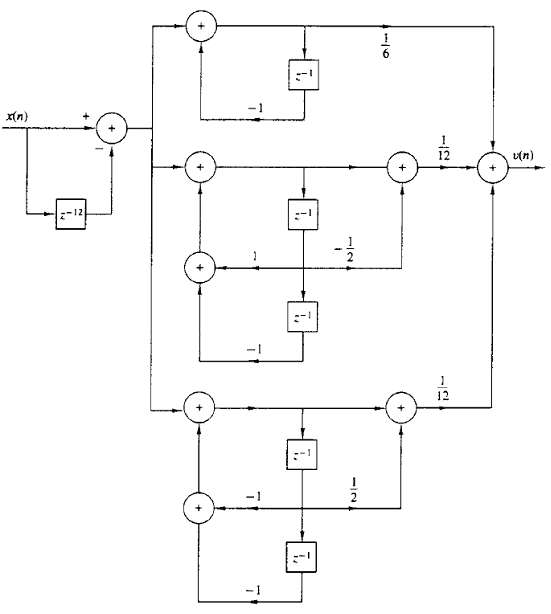
A z-plane pole-zero plot for a certain digital filter is shown in figure. The filter has unity gain at dc.(a) Determine the system function in the form, given numerical values for the parameters A, a1, b1, b2, c1, d1, and d2.(b) Draw block diagrams showing numerical values for path gains in the
Consider the pole-zero plot shown in figure(a) Does it represent an FIR filter?(b) Is it a linear-phase system?(c) Give a direct form realization that exploits all symmetries to minimize the number of multiplications. Show all pathgains.
A digital low-pass filter is required to meet the following specifications: Passband ripple: ≤ 1 dB Passband edge: 4 kHz Stopband attenuation: ≥ 40 dB Stopband edge: 6 kHz Sample rate: 24 kHz The filter is to be designed by performing a bilinear transformation on an analog system
An IIR digital low-pass filter is required to meet the following specifications: Passband ripple (or peak-to-peak ripple): ≤ 0.5 dB Passband edge: 1.2 kHz Stopband attention: ≥ 40 dB Stopband edge: 2.0 kHz Sample rate: 8.0 kHz Use the design formulas in the book to
Determine the system function H(z) of the lowest-order Chebyshev digital filter that meets the following specifications: (a) 1-dB ripple in the Passband 0 ≤ |ω| ≤ 0.3π. (b) At least 60 dB attention in the Stopband 0.35π ≤ |ω| ≤ π. Use the
Determine the system function H(z) of the lowest-order Chebyshev digital filter that meets the following specifications: (a) ½-dB ripple in the Passband 0 ≤ |ω| ≤ 0.24π. (b) At least 50-dB attenuation in the Stopband 0.35π ≤ |ω| ≤ π. Use the
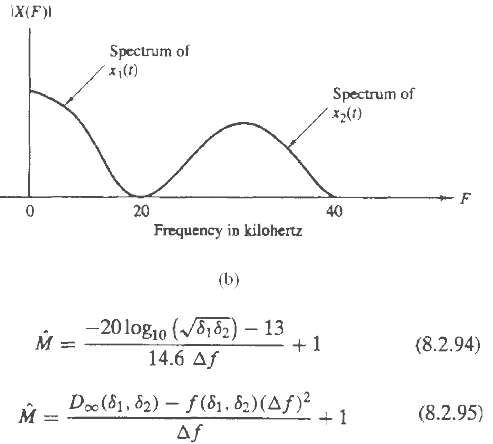
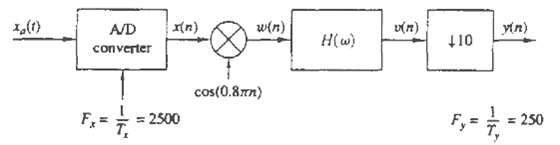
An analog signal x(t) consists of the sum of two components x1(t) and x2(t). The spectral characteristics of x(t) are shown in figure. The signal x(t) is bandlimited to 40 kHz and it is sampled at a rate of 100 kHz to yield the sequence x(n). It is desire to suppress the signal x2(t) by passing the
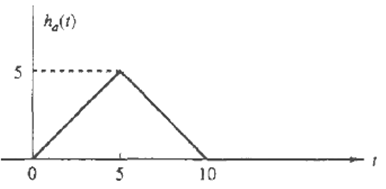
The impulse response of an analog filter is shown in figure.(a) Let h(n) = ha(nT), where T = 1, be the impulse response of a discrete-time filter. Determine the system function H(z) and the frequency response H(w) for this FIR filter.(b) Sketch (roughly) |H(ω)| and compare this frequency response
In this problem you will be comparing some of the characteristics of analog and digital implementations of the single-pole low-pass analog system (a) What is the gain at dc? At what radian frequency is the analog frequency response 3 dB down the from its dc value? At what frequency is the analog
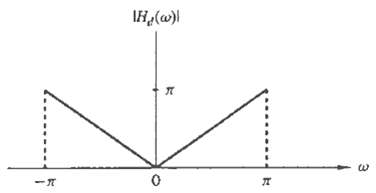
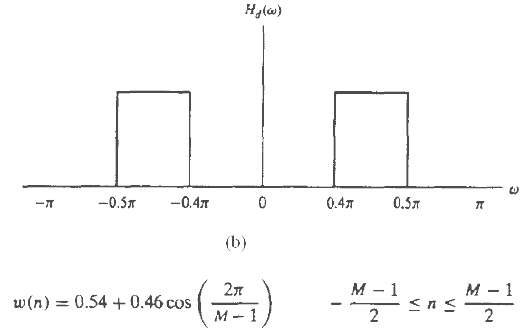
We wish to design a FIR bandpass filter having a duration M = 201. Hd(?) represents the ideal characteristic of the noncausal bandpass filter as shown in figure.(a) Determine the unit sample (impulse) response hd(n) corresponding to Hd(?).(b) Explain how you would use the Hamming window to design a
We wish to design a digital bandpass filter from a second-order analog lowpass Butterworth filter prototype using the bilinear transformation. The specifications on the digital filter are shown in figure. The cutoff frequencies (measured at the half power points) for the digital filter should lie
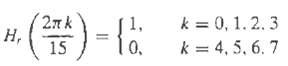
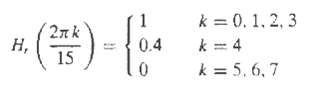
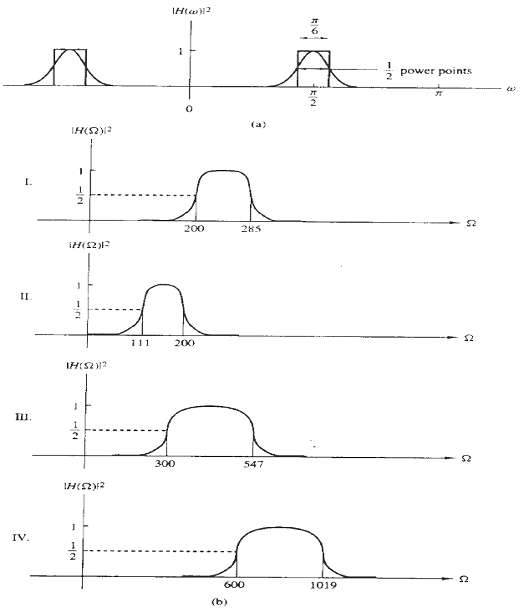
Figure shows a digital filter designed using the frequency sampling method.(a) Sketch a z-plane pole-zero plot for this filter.(b) Is the filter lowpass, highpass, or bandpass?(c) Determine the magnitude response |H(?)| at the frequencies ?k = ?k/6 for k = 0, 1, 2, 3, 4, 5, 6.
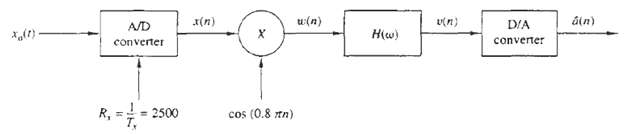
An analog signal of the form xa(t) = a(t) cos2000?t is bandlimited to the range 900 ? F ? 1100 Hz. It is used as an input to the system shown in figure.(a) Determine and sketch the spectra for the signals x(n) and ?(n).(b) Use a Hamming window if length M = 31 to design a lowpass linear phase FIR
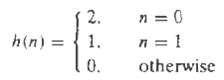
Determine the least-squares FIR inverse of length 3 to the system with impulse response Also, determine the minimum squared error ?min.
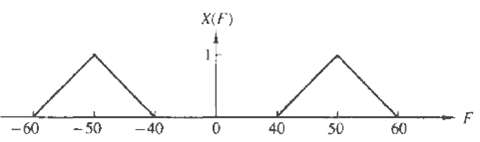
Consider the sampling of the bandpass signal whose spectrum is illustrated is figure. Determine the minimum sampling rate Fs to avoidaliasing.
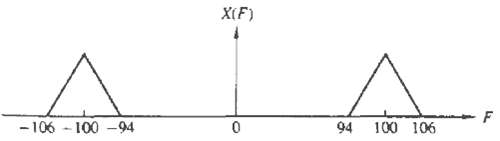
Consider the sampling of the bandpass signal whose spectrum is illustrated in figure. Determine the minimum sampling rate Fs to avoidaliasing.
Prove that x1(t) is generally a complex-valued signal and give the condition under which it is real. Assume that x(t) is real-valued bandpass signal.
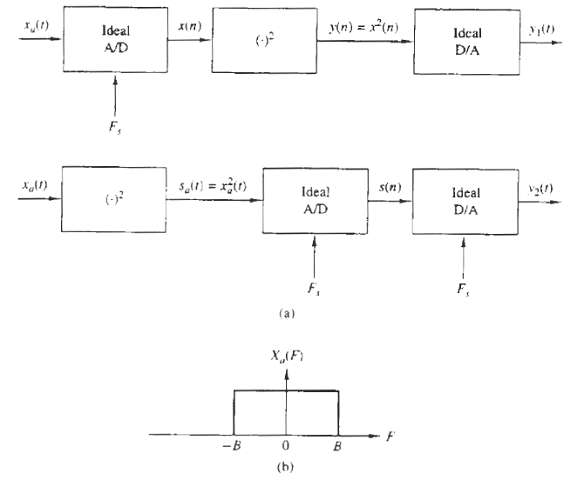
Consider the two systems shown in figure(a) Sketch the spectra of the various signals if xa(t) has the Fourier transform shown in figure(b) and Fs = 2B. How are y1(t) and y2(t) related to xa(t)?(b) Determine y1(t) and y2(t) if xa(t) = cos2?F0t, F0 = 20 Hz, and Fs = 50 Hz or Fs = 30 Hz.
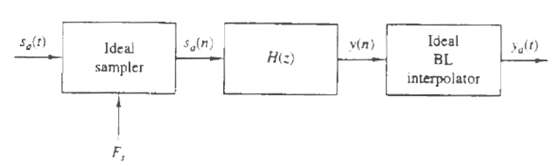
A continuous-time signal xa(t) with bandwidth B and its echo xa(t ? ? ) arrive simultaneously at a TV receiver. The received analog signal?sa(t) = xa(t) + axa(t ? ?) |a| s and H(z) so that ya(t) = xa(t) [i.e., remove the ?ghost? xa(t ? ?) from the receive signal]?
A bandlimited continuous-time signal xa(t) is sampled at a sampling frequency Fs ≥ 2B. Determine the energy Ed of the resulting discrete-time signal x(n) as a function of the energy of the analog signal, Ea, and the sampling period T = 1/Fs.
Let x(n) be a zero-mean stationary process with variance σx2 and auto correlation γx(l).(a) Show that the variance σ2d of the first-order prediction error d(n) = x(n) – ax(n – 1) is given σ2d = σ2x [1 + a2 – 2apx(1)] where px(1) = γx(1)/γx(0) is the normalized autocorrelation
Consider a DM coder with input x(n) = A cos(2πnF/Fs). What is the condition for avoiding slope overload? Illustrate this condition graphically.
Let xa(t) be a bandlimited signal with fixed bandwidth B and variance σ2x. (a) Show that the signal-to-quantization noise ratio. SQNR = 10log10(σ2x/σ2x). Increase by 3 dB each time we double the sampling frequency Fs. Assume that the quantization noise model discussed in section 9.2.3 is
Consider the first-order SDM model shown in figure(a) Show that the quantization noise power in the signal hand {-B, B} is given by:(b) Using a two-term Taylor series expansion of the sine function and assuming that Fs >> B, showthat:
Consider the second-order SDM model shown in figure. (a) Determine the signal and noise system functions Hs(z) and Hn(z), respectively. (b) Plot the magnitude response for the noise system function and compare it with the one for the first-order SDM. Can you explain the 6-dB difference from these
Figure illustrates the basic idea for a lookup table based sinusoidal signal generator. The samples of the signal x(n) = cos(2?/N n) n = 0, 1 . . . N ? 1 are stored in memory. A digital sinusoidal signal is generated by stepping through the table and wrapping around at the end when the angle
Consider the first-order SDM model shown in figure(a) Show that the quantization noise power in the signal hand {-B, B} is given by:(b) Using a two-term Taylor series expansion of the sine function and assuming that Fs >> B, showthat:
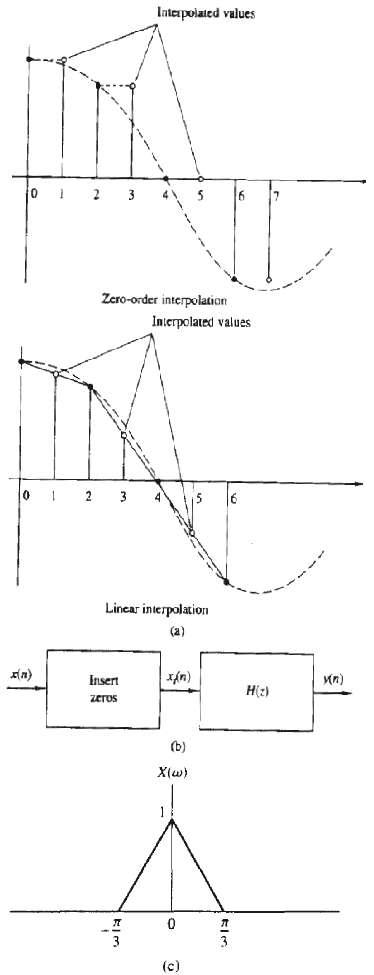
(a) Determine the signal sequences y(n) generated using zero-order interpolation and linear interpolation and then compute the total harmonic distortion (THD) in each case for N = 32, 64, 128. (b) Repeat part (a) assuming that all sample values are quantized to 8 bits. (c) Show that the
Let xa(t) be a time-limited signal: that is, xa(t) = 0 for |t| > ?, with Fourier transform Xa(F). The function Xa(F) is sampled with sampling interval ?f = 1/Ts. (a) Show that the function can be expressed as a Fourier series with coefficients ck = 1/TsXa(k?F) (b) Show that Xa(F) can be
An analog signal xa(t) is bandlimited to the range 900 ? F ? 1100 Hz. It is used as an input to the system shown in figure. In this system, H(?) is an ideal lowpass filter with cutoff frequency Fc = 125Hz. (a) Determine and sketch the spectra for the signals x(n), ?(n), v(n), and y(n). (b) Show
Consider the signal x(n) = anu(n), |a| < 1. (a) Determine the spectrum X(ω). (b) The signal x(n) is applied to a decimator that reduces the rate by a factor of 2. Determine the output spectrum. (c) Show that the spectrum is part (b) is simply the Fourier transform of x(2n).
The sequence x(n) is obtained by sampling an analog signal with period T. From this signal a new signal is derived having the sampling period T/2 by use of a linear interpolation method described by equation(a) Show that this linear interpolation scheme can be realized by basic digital signal
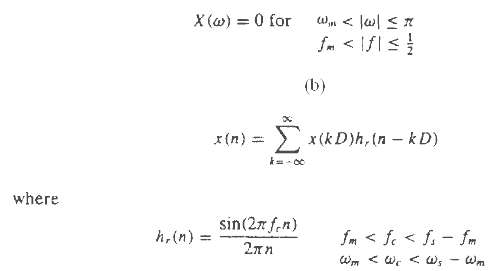
Consider a signal x(n) with Fourier transform(a) Show that the signal x(n) can be recovered from its samples x(mD) if the sampling frequency ?x = 2?/D ? 2?m(fs = 1/D ? 2fm).(b) Show that x(n) can be reconstructed using the formula(c) Show that the bandlimited interpolation in part (b) can be
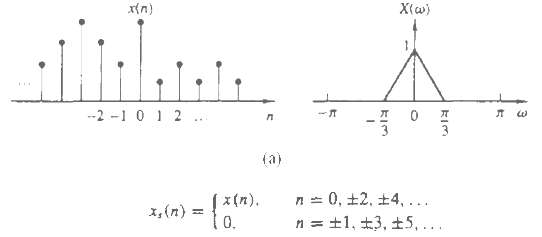
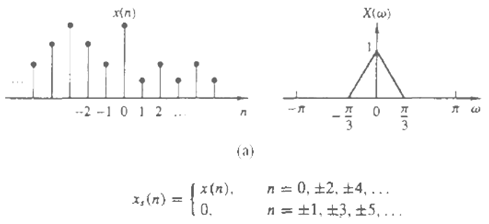
In this problem we illustrate the concepts of sampling and decimation for discretetime signals. To this end consider a signal x(n) with Fourier transform X(ω) as in Figure.(a) Sampling x(n) with a sampling period D = 2 results to the signal. Compute and sketch the signal xs(n) and its Fourier
Design a decimator that downsamples an input signal x(n) by a factor D = 5. Use the Remez algorithm to determine the coefficients of the FIR filter that has 0.1-dB ripple in the passband {0 ≤ ω ≤ π/5} and is down by at least 30 dB in the stopband. Also determine the
Design an interpolator that increase the input sampling rate by a factor of I = 2. Use the Remez algorithm to determine the coefficients of the FIR filter that has a 0.1 – dB ripple in the passband (0 ≤ ω ≤ π/2) and is down by at least 30 dB in the stopband. Also, determine
Design a sample-rate converter that reduces the sampling rate by a factor 2/5. Use the Remez algorithm to determine the coefficients of the FIR filter that has a 0.1-dB ripple in the passband and is down by at least 30 dB in the stopband. Specify the sets of time-variant coefficients g(n, m) and
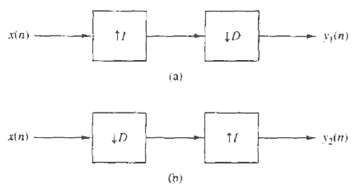
Consider the two different ways of cascading a decimator with an interpolator shown in figure.(a) If D = I, show that the outputs of the two configurations are different. Hence, in general, the two systems are not identical.(b) Show that the two systems are identical if and only if D = I are
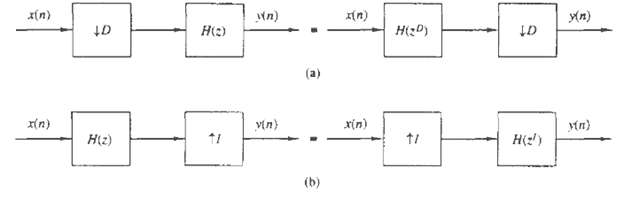
Prove the equivalence of the two decimator and interpolator configuration shown in figure. These equivalent relations are called the ??nobleidentities??.
Consider an arbitrary digital filter with transfer function? (a) Perform a two-component polyphase decomposition of H(z) by grouping the even-numbered samples h0(n) = h(2n) and the odd-numbered samples h1(n) = h(2n +1). Thus show that H(z) can be expressed as: H(z) = H0(z2) + z?1H1(z2) and
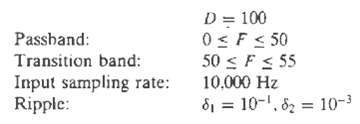
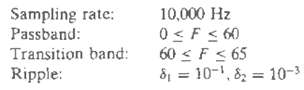
Design a two-stage decimator for the following specifications
Design a linear phase FIR filter that satisfies the following specification based on a single-stage and a two-stage multiratestructure.
Prove that the half-band filter that satisfies (10.9.43) is always odd and the even coefficients arezero.
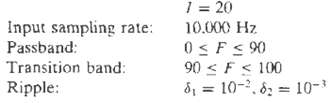
Design one-stage and two-stage interpolators to meet the followingspecification:
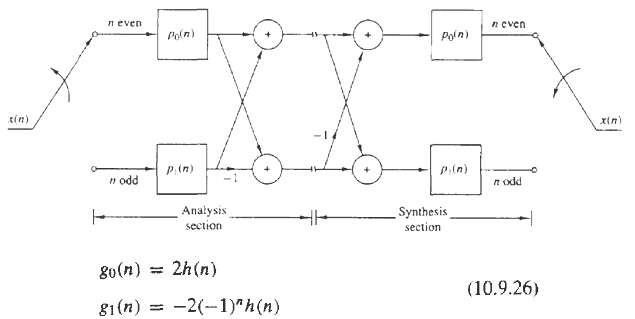
By using the (10.9.26) derive the equations corresponding to the structure for the polyphase synthesis section shown infigure.
Show that the transpose of an L-stage interpolator for increasing the sampling rate by an integer factor I is equivalent to an L-stage decimator that decreases the sampling rate by a factor D = I
Sketch the polyphase filter structure for achieving a time advance of (k/I)Ts in a sequence x(n).
Prove the following expression for an interpolator of order I.(a) The impulse response h(n) can be expressedas
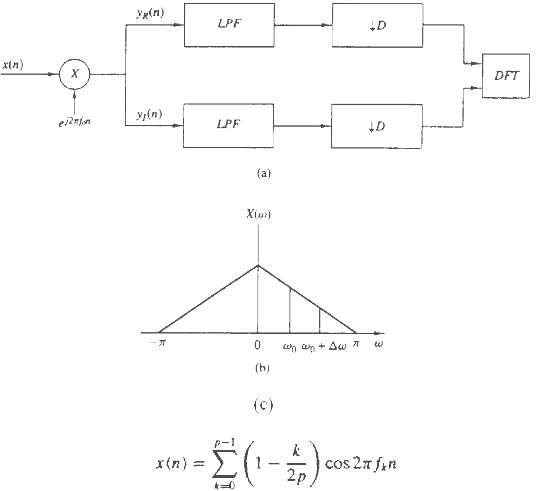
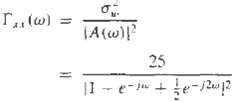
Zoom-frequency analysis consider the system in figure(a) (a) Sketch the spectrum of the signal y(n) = yR(n) + jyl(n) if the input signal x(n) has the spectrum shown in figure(b). (b) Suppose that we are interested in the analysis of the frequencies in the band f0 ? f ? f0 + ?f,?where f0 = ?/6 and
The power density spectrum of an AR process {x(n)} is given as where ?2R is the variance of the input sequence.(a) Determine the difference equation for generating the AR process when the excitation is white noise.(b) Determine the system function for the whitening filter.
An ARMA process has an autocorrelation {?xx(m)} whose z-transform is given as(a) Determine the filter H(z) for generated {x(n)} from a white noise input sequence. Is H(z) unique? Explain.(b) Determine a stable linear whitening filter for the sequence {x(n)}.
Consider the ARMA process generated by the difference equation x(n) = 1.6x(n – 1) – 0.63x(n – 2) + ω(n) + 0.9ω(n – 1) (a) Determine the system function of the whitening filter and its poles and zeros. (b) Determine the power density spectrum of {x(n)}.
Determine the lattice coefficients corresponding to the FIR filter with system functionH(z) = A3(z) = 1 + 12/24z – 1 + 5/8z – 2 + 1/3z – 3
Determine the reflection coefficients {Km} of the lattice filter corresponding to the FIR filter described by the system functionH(z) = A2(z) = 1 + 2z – 1 + 1/3z – 2
(a) Determine the zeros and sketch the zero patterns for the FIR lattice filter with reflection coefficientsK1 = ½ K2 = - 1/3 K3 = 1(b) Repeat part (a) but with K3 = - 1.(c) You should have found that the zeros lie on the unit circle. Can this result be generalized? How?
Determine the impulse response of the FIR filter that is described by the lattice coefficients K1 = 0.6, K2 = 0.3, K3 = 0.5, and K4 = 0.9.
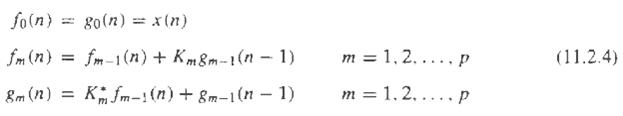
In section 11.2.4 we indicated that the noise-whitening filter Ap(z) for a causal AR(p) process is a forward linear prediction-error filter of order p. Show that the backward linear prediction-error filter of order p is the noise-whitening filter of the corresponding anticausal AR(p) process.
Use the orthogonality principle to determine the normal equations and the resulting minimum MSE for a forward predictor of order p that predicts m samples (m > 1) into the future (m-step forward predictor). Sketch the prediction error filter.
Repeat Problem 11.9 for an m-step backward predictor.
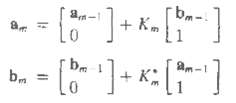
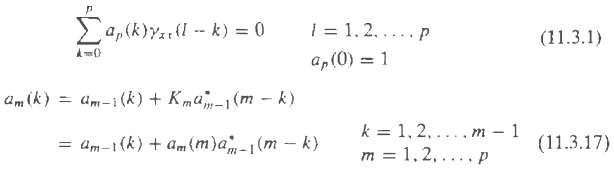
Determine a Levinson-Durbin recursive algorithm for solving for the coefficients of a backward prediction-error filter. Use the result to show that coefficients of the forward and backward predictors can be expressed recursively as
The Levinson-Durbin algorithm described in section 11.3.1 solved the linear equations ?mam?= ? ?m where the right-hand side of this equation has elements of the autocorrelation sequence that are also elements of the matrix ?. Let us consider the more general problem of solving the linear
Use the generalized Levinson-Durbin algorithm to solve the normal equations recursively for the m-step forward and backward predictors.
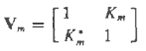
Show that the transformationIn the Schur algorithm satisfy the special propertyVmJVtm = (1 - |Km|2)JWhereThus Vm is called a J –rotation matrix. Its role is to rotate or hyperbolate the row of Gm to lie along the first coordinate direction (Kailath, 1985)
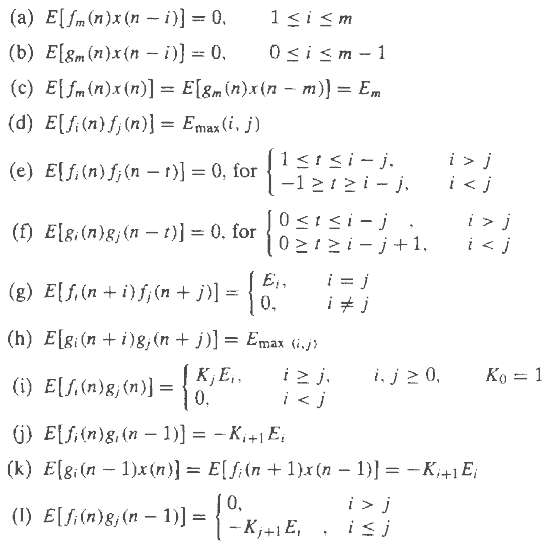
Prove the additional properties (a) through (l) of the prediction- error filters given in section11.4
Extend the additional properties (a) through (l) of the prediction error filters given in section 11.4 to complex-valued signals.
Determine the reflection coefficients k3 in terms of the autocorrelations {γxx(m)} from the Schur algorithm and compare your result with the expression for K3 obtained from the Levinson-Durbin algorithm.
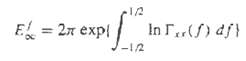
Consider a infinite-length (p = ?) one-step forward predictor for a stationary random process {x(n)} with a power density spectrum of ?xx(f). Show that the mean-square error of the prediction-error filter can be expressed as
Determine the output of an infinite-length (p = ∞) m-step forward predictor and the resulting mean-square error when the input signal is a first-order autoregressive process of the form x(n) = ax(n – 1) + ω(n)
An AR(3) process {x(n)} is characterized by the autocorrelation sequence γxx(0) = 1, γxx(1) = ½, γxx(2) = 1/8, and γxx(3) = 1/64. (a) Use the Schur algorithm to determine the three reflection coefficients K1, K2, and K3. (b) Sketch the lattice filter for synthesizing
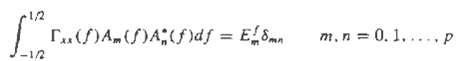
The purpose of this problem is to show that the polynomials {Am(z)}, which are the system functions of the forward prediction-error filters of order m, m = 0, 1, . . . . , p, can be interpreted as orthogonal in the unit circle. Toward this end, suppose that ?xx(f) is the power spectral density of a
Determine the system function of all-pole filter described by the lattice coefficients K1 = 0.6, K2 = 0.3, K3 = 0.5, and K4 = 0.9
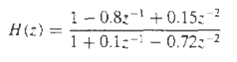
Determine the parameters and sketch the lattice-ladder filter structure for the system with system function
Consider a signal x(n) = s(n) + ω(n), where s(n) is an AR(1) process that satisfies the difference equations(n) = 0.8s(n – 1) + v(n)where {v(n)} is a white noise sequence with variance σ2u = 0.49 and {ω(n)} are uncorrelated.(a) Determine the autocorrelation sequences {γss(m)} and
Determine he optimum causal IIR Wiener filter for the signal given in Problem 11.24 and the corresponding MMSE∞.
Determine the system function for the noncausal IIR Wiener filter for the signal given in Problem 11.24 and the corresponding MMSEn0.
Determine the optimum FIR Wiener filter of length M = 3 for the signal in Example and the corresponding MMDE3, Compare MMSE3 with MMSE2 and comment on the difference.
An AR(2) process is defined by the difference equationx(n) = x(n – 1) – 0.6x(n – 2) + ω(n)Where {ω(n)} is a white noise process with variance σ2ω . Use the Yule-Walker equations to solve for the values of the autocorrelation γxx(0), γxx(1), and γxx(2).
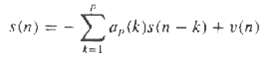
An observed random process {x(n)} consists of the sum of an AR(p) process of the form And a white noise process {?(n)} with variance ?2?. The random process {v(n)} is also white with variance ?2v. The sequences {v(n)} and {?(n)} are uncorrelated.Show that the observed process {x(n) = s(n) + ?(n)}
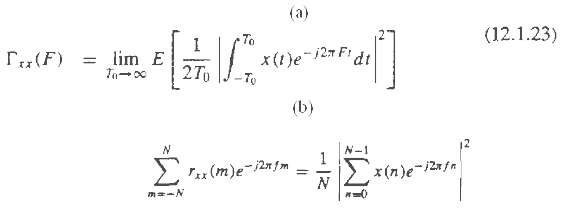
(a) By expanding (12.1.23), taking the expected value, and finally taking the limit as T0 ? ?, show that the right-hand side to ?xx(F).(b) Prove that
Showing 1200 - 1300
of 1744
First
4
5
6
7
8
9
10
11
12
13
14
15
16
17
18
Step by Step Answers