New Semester
Started
Get
50% OFF
Study Help!
--h --m --s
Claim Now
Question Answers
Textbooks
Find textbooks, questions and answers
Oops, something went wrong!
Change your search query and then try again
S
Books
FREE
Study Help
Expert Questions
Accounting
General Management
Mathematics
Finance
Organizational Behaviour
Law
Physics
Operating System
Management Leadership
Sociology
Programming
Marketing
Database
Computer Network
Economics
Textbooks Solutions
Accounting
Managerial Accounting
Management Leadership
Cost Accounting
Statistics
Business Law
Corporate Finance
Finance
Economics
Auditing
Tutors
Online Tutors
Find a Tutor
Hire a Tutor
Become a Tutor
AI Tutor
AI Study Planner
NEW
Sell Books
Search
Search
Sign In
Register
study help
business
marketing strategy planning
Statistics For The Behavioral Sciences 5th Edition Susan A. Nolan, Thomas Heinzen - Solutions
What is counterbalancing?
What are order effects?
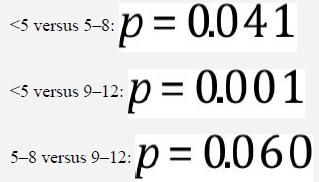
Use the same data from the previous exercise in this exercise.a. Explain why it is necessary to conduct a post hoc test such as a Tukey HSD test when an ANOVA is statistically significant.b. Conduct a Tukey HSD test. Show all calculations.c. Explain why we cannot assume that two groups have the
Irwin and colleagues (2004) conducted research on adherence to an exercise regimen. We give an overview of the study in exercise 12.38. Here are the data:<5 sessions: 155, 120, 1305–8 sessions: 199, 160, 1849–12 sessions: 230, 214, 195, 209a. What is the independent variable in this study?
For each of the following situations, state whether the distribution of interest is the z distribution, a t distribution, or an F distribution. Explain your answer.a. A student reads in her Introduction to Psychology textbook that the mean IQ is 100. She asks 10 friends what their IQ scores are
Irwin and colleagues (2004) conducted a study on adherence to an exercise program. Participants were asked to attend a monthly group education program to help them change their exercise behavior. Attendance was taken and participants were divided into three categories: those who attended fewer than
Why would a researcher use a Bonferroni test when conducting several separate statistical analyses?
Explain what statisticians mean when they say that a Bonferroni post hoc comparison is more conservative than a Tukey HSD test.
What are the necessary steps for performing a Bonferroni post hoc comparison?
What is omega squared?
What is the difference between a within-groups (repeated-measures) ANOVA and a between-groups ANOVA?
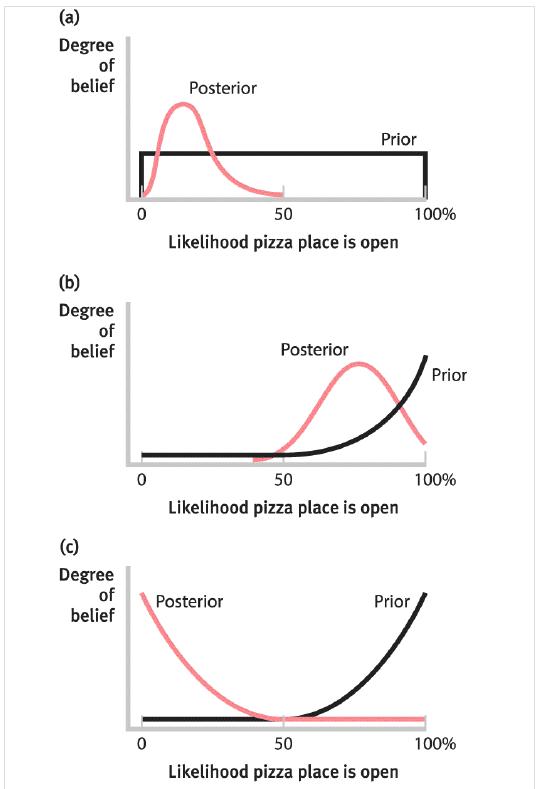
The pizza place example that was introduced in the chapter, and in Figure 11-9, suggests an interaction between the strength of our prior beliefs and the amount of data that we have in determining how much we change our beliefs—that is, how different the posterior distribution is from the prior.
How can we calculate an effect size for the independent-samples t test we conducted in Exercise 11.38?Exercise 11.38?Researchers at Stanford University examined brain activity in women and men during exposure to humorous cartoons (Azim, Mobbs, Jo, Menon, & Reiss, 2005). Using functional
Calculate a 95% confidence interval for the independent-samples t test you conducted on the gender and humor data in the previous exercise.Previous exercise.Researchers at Stanford University examined brain activity in women and men during exposure to humorous cartoons (Azim, Mobbs, Jo, Menon,
Researchers at Stanford University examined brain activity in women and men during exposure to humorous cartoons (Azim, Mobbs, Jo, Menon, & Reiss, 2005). Using functional magnetic resonance imaging (fMRI), researchers observed more activity in the reward centers of women’s brains than men’s
Does watching award-winning fiction on television help us to understand other people? Psychologists Jessica Black and Jennifer Barnes (2015) tested whether people who watched award-winning fictional television shows like Mad Men and The West Wing performed better on a test of theory of mind than
Do you turn off the light when you leave the room? South Korean researchers wondered how they could increase the number of people who do (Ahn, Kim, & Aggarwal, 2013). They compared two poster campaigns. In one, an image of a light bulb was anthropomorphized by giving it eyes, nose, and a mouth,
Compare and contrast the characteristics of the prior and posterior distributions of the Bayesian statistical approach.
How does the Bayesian approach to statistics differ from the traditional approach?
What is pooled variance?
What are independent events?
When is it appropriate to use an independent-samples t test?
The following is an excerpt from the abstract (brief opening summary) from a published research study that examined a reported bias against conservatives in American academia (Fosse, Gross, & Ma, 2011).The American professoriate contains a disproportionate number of people with liberal
We introduced confounding variables (or confounds) in Chapter 1. Explain why order effects might be an example of a confound.
Why might order effects lead a researcher to use a between-groups design rather than a within groups design?
Identify and explain the technique for countering order effects using a within-groups research design.
What are order effects?
How is a paired-samples t-test different from a single-sample t-test?
Psychologist Patricia Greenfield (2017) points out that failures to replicate do not necessarily indicate that the initial findings were wrong. She explains: “Data on the connection between social change and behavioral change point to a new role for ‘replication’: not to show that results can
Market researchers collected information on smartphone data usage for Uber drivers. They wondered if Uber drivers use a higher amount of smartphone data compared to all other taxi drivers. A total of 31 Uber drivers reported their monthly data usage. Using an alpha level of 0.10, identify the
If an effort to replicate a study fails, what are two things that the failure could indicate about the original study?
What is replication and why is it important for behavioral science research?
Bem (2011) reports nine experiments in which he presents evidence for extrasensory perception (ESP). For example, in Experiment 1, participants were shown two “curtains” side by side on a computer screen and told that there was a picture behind one curtain and nothing behind the second curtain.
If a researcher fails to reject the null hypothesis, how would knowing information about the sample size and the expected effect size help to interpret the researcher’s failure to reject the null hypothesis?
Ohio State University researchers conducted a meta-analysis of 53 studies totaling almost 8500 participants (Lull & Bushman, 2015). Their goal was to determine whether advertising that included sex or violence helped to sell products. The researchers reported that “memory for brands and ads
Below is an excerpt of an abstract from a published meta-analysis by Lindberg, Hyde, Petersen, and Linn (2010). Use this excerpt to describe what is done in each of the four steps of meta-analysis.In this article, we use meta-analysis to analyze gender differences in recent studies of mathematics
Ego depletion refers to the idea that we have a limited amount of self-control, which can be depleted. Exerting self-control in one situation will make it harder to exert self-control on later tasks. For example, maybe you’re eating a healthy diet and successfully avoided the holiday cookies at
In a study of the effects of testing on enhancing memory, Akan and colleagues (2018) performed an a priori power analysis to determine the sample size they would need to detect a small to medium-sized effect (d = 0.40) with 80% power and an alpha level of .05. Their analysis indicated that they
In the previous exercise, you calculated an effect size for data for 63 international students at the University of Melbourne. Imagine that you had a sample of 300 students. How would the effect size change? Explain why it would or would not change.
In the two previous exercises, we considered the IELTS listening module, during which the population of all IELTS takers in a year had a mean score of 6.00 with a standard deviation of 1.30 (2013). A sample of 63 international students at the University of Melbourne had mean IELTS listening scores
Using the IELTS listening data presented in the previous exercise, practice evaluating data using confidence intervals.a. Compute the 80% confidence interval.b. How do the conclusion and the confidence interval change as we move from 95% confidence to 80% confidence?c. Why don’t we talk about
The International English Language Testing System (IELTS) has six modules, one of which assesses listening skills. IELTS researchers reported that a recent mean for everyone who completed this module in one year was 6.00 and the standard deviation was 1.30 (2013). A sample of 63 international
International students who wish to study at Englishspeaking universities in Canada or the United States are required to take a test, such as the Test of English as a Foreign Language (TOEFL) or the International English Language Testing System (IELTS), if English is not their first language. In a
What is the best way to avoid the negative consequences of an underpowered study?
What are the potential negative consequences of an underpowered study?
How does a file drawer analysis make the findings from a meta-analysis more persuasive?
Why is it important for a researcher who is conducting a meta-analysis to find not only published studies but also unpublished studies?
In 2010, a group of researchers published the finding that power posing—adopting a wide stance with one’s hands on one’s hips—improved self-reported feelings of power and increased testosterone levels in a sample of 42 participants (Carney, Cuddy, & Yap, 2010). Subsequent attempts to
Brian Nosek and other researchers at the Center for Open Science gave the exact same set of data on football players (soccer players in the United States and Canada) to 29 different teams of researchers (Silberzahn et al., 2018). The researchers were all asked whether referees are more likely to
Imagine that an international team of medical researchers hypothesized that a new drug might cure a lifethreatening disease. They test their hypothesis by recruiting 50 participants; half receive the drug, while the other half serve as a control group. At the end of the multi-year study, the
For each of the following examples, state the null hypothesis and the research hypothesis, in both words and symbolic notation:a. Musician David Teie worked with animal researchers to develop music specifically for cats—music that a typical cat might find relaxing (Stanford, 2015). Imagine that
For each of the following examples, identify whether the research has expressed a directional or a nondirectional hypothesis:a. Musician David Teie worked with animal researchers to develop music specifically for cats—music that a typical cat might find relaxing (Stanford, 2015). Imagine that you
Another teacher decides to average the heights of all 15-year-old male students in his classes throughout the day. By the end of the day, he has measured the heights of 57 boys and calculated an average of 68.1 inches (172.97 centimeters; remember, for this population μ = 67 inches and σ =
Elena, a 15-year-old girl, is 58 inches (147.32 centimeters) tall. The Centers for Disease Control and Prevention (CDC) indicates that the average height for girls at this age is 63.80 inches, with a standard deviation of 2.66 inches.a. Calculate Elena’s z score.b. What percentage of girls are
For each of the following alpha levels, what percentage of the data will be in each critical region for a two-tailed test?a. 0.05b. 0.10c. 0.01
What is p-hacking and what are some examples of research behaviors that would constitute p hacking?
What is HARKing and why can it be harmful?
What is the difference between a one-tailed hypothesis test and a twotailed hypothesis test in terms of critical regions?
What is a percentile?
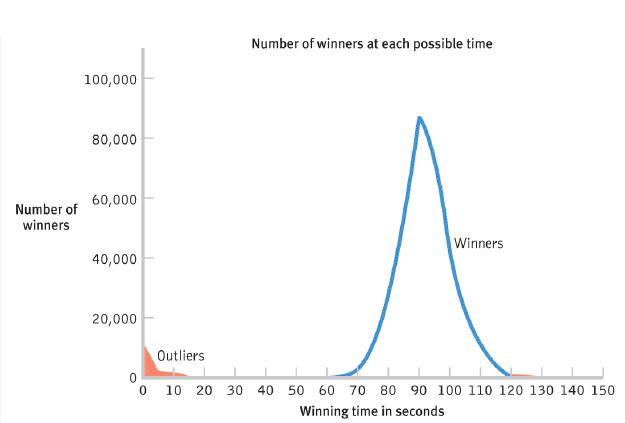
Researchers used the normal curve to investigate cheating among online gamers playing a car racing game (Christensen et al., 2013). The graph shows the winning times for one version of the game. a. Referring to Chapter 3, what kind of graph is this and why? Imagine that the curve represents
FiveThirtyEight is a popular blog that uses statistics in creative ways to better understand politics, sports, science and health, economics, and culture. In one article (Hickey, 2015), the author uses z scores to standardize book reviews from www.goodreads.com (which uses a 1 to 5 scale) and movie
According to a news article, “Friends call Constable [Gary] Collins Rain Man or Yoda or simply The Oracle. But to Scotland Yard, London’s metropolitan police force, he is known as a ‘super recognizer’” (Bennhold, 2015). Prosopagnosia, also known as face blindness, is a disorder in which
A cardiologist in Munster, Indiana, has been accused of conducting unnecessary heart surgeries (Cresswell, 2015). Investigators found that the rates for one heart procedure were in the top 10% in the country for the city where this doctor worked. Lawyers countered that there were older and sicker
See the description of the MMPI-2 in the previous exercise. The mean T score is always 50, and the standard deviation is always 10. Imagine that you administer the MMPI-2 to 50 respondents who do not use Instagram or any other social media; you wonder whether their scores on the social introversion
The Test of English as a Foreign Language (TOEFL), with scores ranging from 0 to 120, has traditionally been the most commonly used exam of reading comprehension, vocabulary, writing, and grammar for English-language learners in the United States. The International English Language Testing System
Ethical researchers are increasingly using the Internet to modernize their research and conduct it in a more ethical way. In one study, not yet peer-reviewed, Yale researchers found that increased exposure to fake news headlines led to increased perceptions that these headlines were accurate
Short-run proportions are often quite different from long-run probabilities.a. In your own words, explain why we would expect proportions to fluctuate in the short run, but why long-run probabilities are more predictable.b. What is the expected long-run probability of heads if a person flips a coin
The Gizmodo blog Throb, a Web site focused on the science of sex, released its own sex education survey (Kelly, 2015). The journalist who developed the survey wrote: “I hope that with enough of your answers, we can start to build a picture of what sexed actually looks like in [the United States].
Researcher Zoran Popovic' has developed a video game called Mozak (Serbo-Croatian for “brain”) for the Allen Institute for Brain Science that enlists players— research participants, actually—to trace lines over images of neurons (Wingfield, 2017). The goal: to create three-dimensional
What are the ways the term independent is used by statisticians?
What are some of the pros and cons of crowdsourced data?
What is crowdsourcing in research?
What is generalizability?
Researchers reported that the race of the teaching assistants (TAs) for a class had an effect on student outcome (Lusher, Campbell, & Carrell, 2015). They reported that “Asian students receive a 2.3% of a standard deviation increase in course grade when the racial composition of the TAs is
David Laude was a chemistry professor at the University of Texas at Austin (and a former underprepared college student) who developed an intervention that led underprepared students to perform at the same average level as others (Tough, 2014). He started this program because he observed a bimodal
For each of the following situations, state whether the mean or median would be a statistic or a parameter. Explain your answer.a. According to Canadian census data, the median family income in British Columbia was $66,970, lower than the national median of $69,860.b. The stadiums of teams in the
Every year, the National Survey of Student Engagement (NSSE) asks U.S. university students how many 20-page papers they had been assigned. Here are the percentages, for 1 year, of students who said they had been assigned between 5 and 10 twenty-page papers for a sample of 19 universities.a.
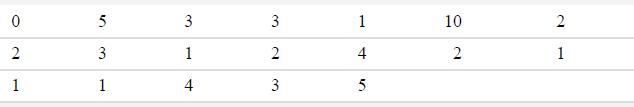
Calculate the interquartile range for the following set of data: 2 5 1 3 3 4 3 6 7 1 4 3 7 2 2 8 3 3 12 1 2.
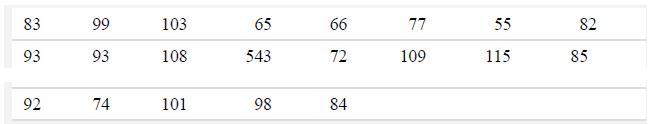
Calculate the range and the interquartile range for the following set of data. Explain why they are so different. 83 99 103 65 66 77 55 82 93 93 108 543 72 109 115 85 92 74 101 98 84
At what percentile is the third quartile?
At what percentile is the first quartile?
Using your knowledge of how to calculate the median, describe how to calculate the first and third quartiles of your data.
What is an outlier?
For each of the following studies, list(i) The independent variable or variables and how they were operationalized, (ii) The dependent variable or variables and how they were operationalized, (iii) The ideal type of graph that would depict these data.a. For your favorite story, is it
Social science researchers are increasingly using word clouds to convey their results. A research team from the Netherlands asked 66 older adults to generate a list of what they perceive to be important to their well-being (Douma, Steverink, Hutter, & Meijering, 2015). Based on these lists, the
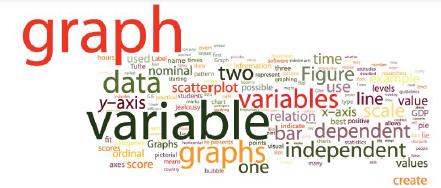
The Web site Wordle lets you create your own word clouds (wordle.net/create). (There are a number of other online tools to create word clouds, including TagCrowd and WordItOut.) Here’s a word cloud we made with the main text from this chapter. In your own words, explain why 10 or so of the most
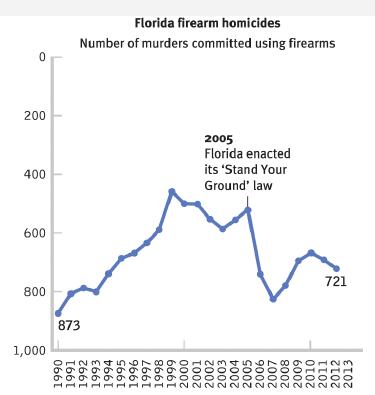
In this chapter, we learned about graphs that include statistical lies and graphs designed to be unclear. Think about the problems in the graph shown here.a. What is the primary flaw in the presentation of these data?b. How would you redesign this graph? Be specific and cite at least three ways in
Find an article in the popular media (newspaper, magazine, Web site) that includes a graph in addition to the text.a. Briefly summarize the main point of the article and graph.b. What are the independent and dependent variables depicted in the graph? What kinds of variables are they? If nominal,
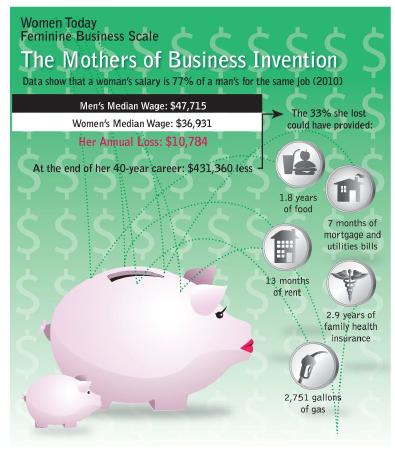
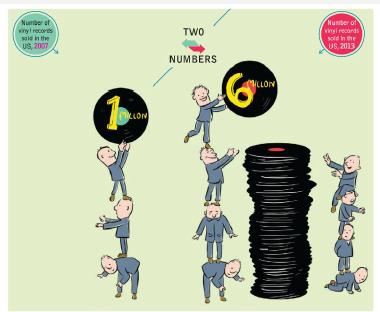
What advice would you give to the creator of the following graph? Consider the basic guidelines for a clear graph, for avoiding chartjunk, and regarding the ways to mislead through statistics. Give three pieces of advice. Be specific—don’t just say that there is chartjunk; say exactly what you
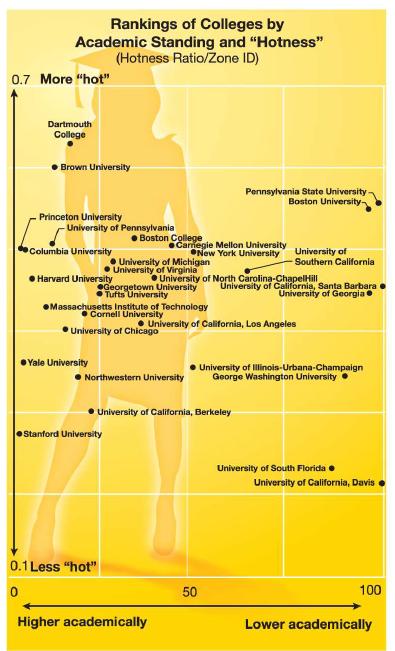
Buzzfeed.com published a multivariable graph that purported to rank colleges by academics and “hotness.” The data from this graph are represented to the right.a. What kind of graph is this? Explain.b. List the variables that are included in this graph.c. List at least three ways in which this
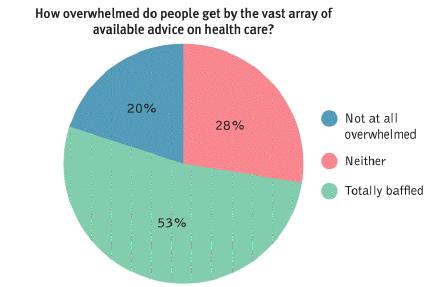
The company that makes Fitbit, the wristband that tracks exercise and sleep, commissioned a report that included the pie chart shown here (2013).a. Explain why a bar graph would be more suitable for these data than a pie chart.b. What statistical lie appears to be present in these
The American Psychological Association (2015) gathered data from almost 1000 psychology doctoral programs in the United States. If a school offered, say, four different psychology doctorates, each would be counted separately. The table below includes overall acceptance rates for each of 10
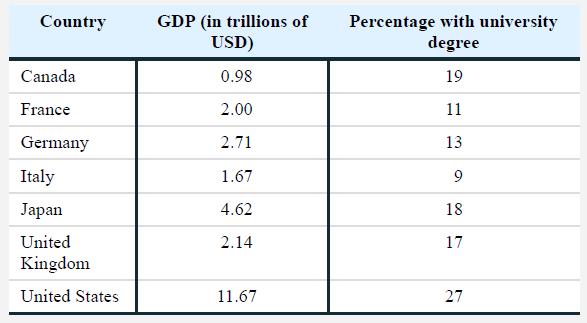
The Group of Seven (G7) consists of many of the major world economic powers. It meets annually to discuss pressing world problems. Here are one year’s data for gross domestic product (GDP) and a measure of education. The measure of education is the percentage of the population between the ages of
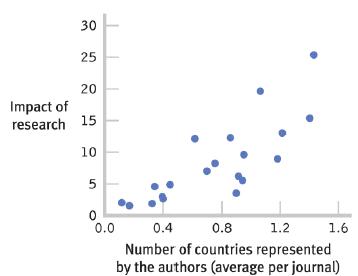
Does research from international teams make a bigger splash? Researchers explored whether research conducted by multinational research teams had a bigger impact than research from teams with less international representation (Hsiehchen, Espinoza, & Hsieh, 2015). The graph here shows the
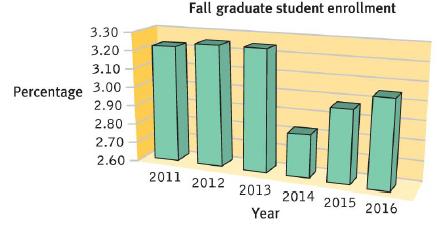
The following figure presents the enrollment of graduate students at a university, across six fall terms, as a percentage of the total student population.DescriptionThe x-axis represents the year and the y-axis represents percentage.Data from the graph are summarized as follows. All data are
Alumni giving rates, calculated as the total dollars donated per year from 2010 to 2020, represent which kind of variable—nominal, ordinal, or scale? What would be an appropriate graph to depict these data?
What information does a violin plot depict?
Why is it important to show variability on a graph, rather than just presenting a bar graph?
Under what circumstances would the x-axis and y-axis not start at 0?
Why is it important to identify the independent variable and the dependent variable before creating a visual display?
Showing 3300 - 3400
of 4319
First
27
28
29
30
31
32
33
34
35
36
37
38
39
40
41
Last
Step by Step Answers