New Semester
Started
Get
50% OFF
Study Help!
--h --m --s
Claim Now
Question Answers
Textbooks
Find textbooks, questions and answers
Oops, something went wrong!
Change your search query and then try again
S
Books
FREE
Study Help
Expert Questions
Accounting
General Management
Mathematics
Finance
Organizational Behaviour
Law
Physics
Operating System
Management Leadership
Sociology
Programming
Marketing
Database
Computer Network
Economics
Textbooks Solutions
Accounting
Managerial Accounting
Management Leadership
Cost Accounting
Statistics
Business Law
Corporate Finance
Finance
Economics
Auditing
Tutors
Online Tutors
Find a Tutor
Hire a Tutor
Become a Tutor
AI Tutor
AI Study Planner
NEW
Sell Books
Search
Search
Sign In
Register
study help
mathematics
calculus early transcendentals 9th
Calculus Early Transcendentals 9th Edition James Stewart, Daniel K. Clegg, Saleem Watson, Lothar Redlin - Solutions
Use the formula in the indicated entry of the Table of Integrals on Reference Pages 6 –10 to evaluate the integral. 7/2 cos 5x cos 2x dx; entry 80
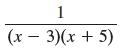
Write out the form of the partial fraction decomposition of the function. Do not determine the numerical values of the coefficients.a.b. 1 (x – 3)(x + 5)
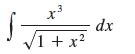
(a) Determine an appropriate trigonometric substitution.(b) Apply the substitution to transform the integral into a trigonometric integral. Do not evaluate the integral. dx 1 +x2
Explain why each of the following integrals is improper.a.b.c.∫10 tan πx dxd. "4 4dx лх -3
Graph the given functions on a common screen. How are these graphs related?y = 2x, y = ex, y = 5x, y = 20x
Graph the given functions on a common screen. How are these graphs related?y = ex, y = e-x, y = 8x, y = 8-x
Determine whether the equation or table defines y as a function of ϰ.3ϰ − 5y = 7
Make a rough sketch by hand of the graph of the function. Use the graphs given in Figures 3 and 15 and, if necessary, the transformations of Section 1.3.h(ϰ) = 2(1/2)ϰ – 3
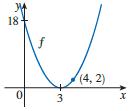
Find a formula for the quadratic function whose graph is shown. 18 f (4, 2) 3
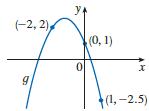
Find a formula for the quadratic function whose graph is shown. (-2, 2) (0, 1) (1,-2.5)
Make a rough sketch by hand of the graph of the function. Use the graphs given in Figures 3 and 15 and, if necessary, the transformations of Section 1.3.y = 1 – 1/2 e–ϰ
Find a formula for a cubic function f if f (1) = 6 and f (–1) = f (0) = f (2) = 0.
Graph the function by hand, not by plotting points, but by starting with the graph of one of the standard functions given in Table 1.2.3, and then applying the appropriate transformations.y = -√x - 1
Graph the function by hand, not by plotting points, but by starting with the graph of one of the standard functions given in Table 1.2.3, and then applying the appropriate transformations.y = 2 - 2 cos x
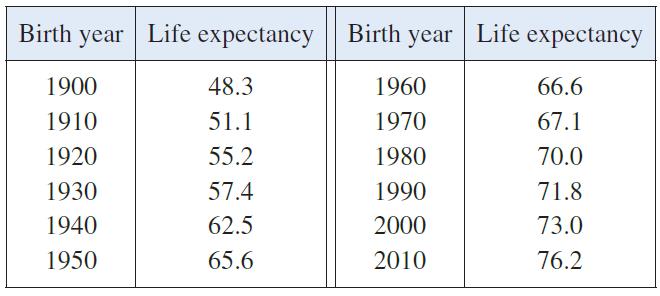
Life expectancy has improved dramatically in recent decades. The table gives the life expectancy at birth (in years) of males born in the United States. Use a scatter plot to choose an appropriate type of model. Use your model to predict the life span of a male born in the year 2030. Birth year
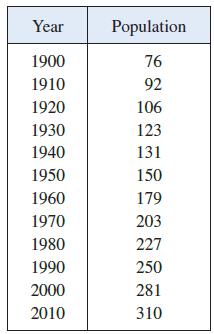
The table gives the population of the United States, in millions, for the years 1900 –2010. Use a graphing calculator (or computer) with exponential regression capability to model the US population since 1900. Use the model to estimate the population in 1925 and to predict the population in the
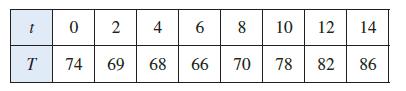
Temperature readings T (in °F) were recorded every two hours from midnight to 2:00 pm in Atlanta on a day in June. The time t was measured in hours from midnight.(a) Use the readings to sketch a rough graph of T as a function of t.(b) Use your graph to estimate the temperature at 9:00 am. 8 10 12
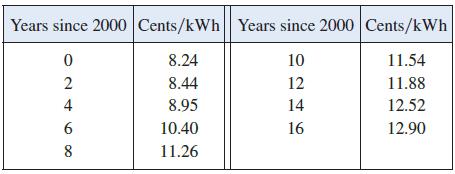
The table shows average US retail residential prices of electricity from 2000 to 2016, measured in cents per kilowatt hour.(a) Make a scatter plot. Is a linear model appropriate? (b) Find and graph the regression line.(c) Use your linear model from part (b) to estimate the average retail price
Find (a) f + t,(b) f - t,(c) fg, and(d) f/g and state their domains. f(x) = /25 – x, g(x): = Vx + 1 %3!
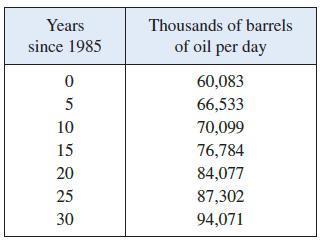
The table shows world average daily oil consumption from 1985 to 2015, measured in thousands of barrels per day.(a) Make a scatter plot and decide whether a linear model is appropriate.(b) Find and graph the regression line.(c) Use the linear model to estimate the oil consumption in 2002 and 2017.
Graph several members of the family of functionswhere a > 0. How does the graph change as a increases? f(x) = (ea +ela)
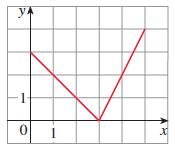
Find a formula for the function whose graph is the given curve.The line segment joining the points (1, -3) and (5, 7)
Solve each equation for x. Give both an exact value and a decimal approximation, correct to three decimal places.(a) ln(ln ϰ) = 0(b) 60/1 + e–ϰ = 4
Find a formula for the function whose graph is the given curve.The line segment joining the points (-5, 10) and (7, -10)
Find a formula for the function whose graph is the given curve.The top half of the circle ϰ2 + (y - 2)2 − 4
Find a formula for the function whose graph is the given curve. 1
(a) What are the values of eln 300 and ln(e300)?(b) Use your calculator to evaluate eln 300 and ln(e300). What do you notice? Can you explain why the calculator has trouble?
Graph the function f (ϰ) = √ϰ3 + ϰ2 + ϰ + 1 and explain why it is one-to-one. Then use a computer algebra system to find an explicit expression for f–1(ϰ). (Your CAS will produce three possible expressions. Explain why two of them are irrelevant in this context.)
(a) If g(ϰ) − ϰ6 + ϰ4, ϰ > 0, use a computer algebra system to find an expression for g–1(ϰ).(b) Use the expression in part (a) to graph y = g(ϰ), y = ϰ, and y = g–1(ϰ) on the same screen.
The National Ignition Facility at the Lawrence Livermore National Laboratory maintains the world’s largest laser facility. The lasers, which are used to start a nuclear fusion reaction, are powered by a capacitor bank that stores a total of about 400 megajoules of energy. When the lasers are
Find the exact value of each expression.(a) cos–1(–1)(b) sin–1(0.5)
Find the exact value of each expression.(a) tan–1 √3(b) arctan(–1)
Find the exact value of each expression.(a) csc–1 √2(b) arcsin 1
Find the exact value of each expression.(a) sin–1(–1/√2 )(b) cos–1(√3 /2)
Find the exact value of each expression.(a) cot–1(–√3 )(b) sec–1 2
Find the exact value of each expression.(a) arcsin(sin(5π/4))(b) cos(2 sin–1 ( 5/13))
Prove that cos(sin–1 ϰ) = √1 – ϰ2 .
Determine whether f is even, odd, or neither. You may wish to use a graphing calculator or computer to check your answer visually.f(ϰ) = x|x|
Determine whether f is even, odd, or neither. You may wish to use a graphing calculator or computer to check your answer visually.f(ϰ) = 1 + 3ϰ2 -x4
Determine whether f is even, odd, or neither. You may wish to use a graphing calculator or computer to check your answer visually.f(ϰ) = 1 + 3ϰ3 -x5
If f and t are both even functions, is f + t even? If f and t are both odd functions, is f + t odd? What if f is even and t is odd? Justify your answers.
If f and t are both even functions, is the product ft even? If f and t are both odd functions, is ft odd? What if f is even and t is odd? Justify your answers.
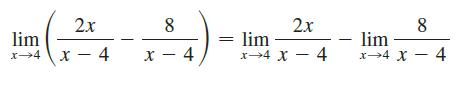
Determine whether the statement is true or false. If it is true, explain why. If it is false, explain why or give an example that disproves the statement. 2x 8. lim x - 4 2x = lim x4 x - 4 8 lim x→4 x – 4 x - 4 x→4 |
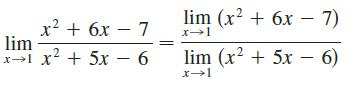
Determine whether the statement is true or false. If it is true, explain why. If it is false, explain why or give an example that disproves the statement. lim (x? + 6x – 7) x2 + 6x – 7 lim x>1 x? + 5x – 6 lim (x2 + 5x – 6)
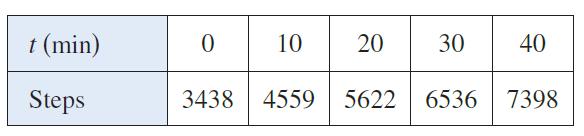
A student bought a smartwatch that tracks the number of steps she walks throughout the day. The table shows the number of steps recorded t minutes after 3:00 pm on the first day she wore the watch.(a) Find the slopes of the secant lines corresponding to the given intervals of t. What do these
Find the limit. lim cos (x + 3x)
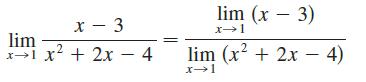
Determine whether the statement is true or false. If it is true, explain why. If it is false, explain why or give an example that disproves the statement. lim (x – 3) x - 3 lim x1 x + 2x - 4 .2 x1 4 + 2x - 4)
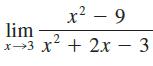
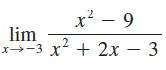
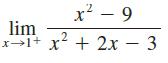
Find the limit. x? – 9 lim .2. x3 x + 2x - 3
What does the Squeeze Theorem say?
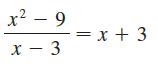
Determine whether the statement is true or false. If it is true, explain why. If it is false, explain why or give an example that disproves the statement. x? – 9 = x + 3 x - 3
Find an equation of the tangent line to the curve at the given point.y = 2x2 - 5x + 1, (3, 4)
Find the limit. x? – 9 lim x-3 x2 + 2x – 3
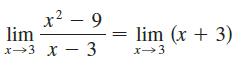
Determine whether the statement is true or false. If it is true, explain why. If it is false, explain why or give an example that disproves the statement. x? – 9 lim x3 X - 3 lim (x + 3)
The deck of a bridge is suspended 275 feet above a river. If a pebble falls off the side of the bridge, the height, in feet, of the pebble above the water surface after t seconds is given by y − 275 - 16t2.(a) Find the average velocity of the pebble for the time period beginning when t = 4 and
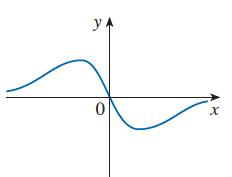
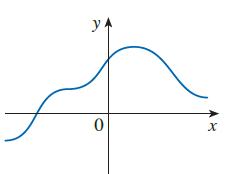
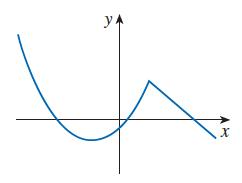
Trace or copy the graph of the given function f. (Assume that the axes have equal scales.) Then use the method of Example 1 to sketch the graph of f' below it. yA
Find an equation of the tangent line to the curve at the given point.y = x2 - 2x3, (1, -1)
Find the limit. x? – 9 lim x1+ x + 2x – 3
Determine whether the statement is true or false. If it is true, explain why. If it is false, explain why or give an example that disproves the statement.If limx→5 f(x) = 2 and limx→5 g(x) = 0, then limx→5 [f(x) / g(x)]does not exist.
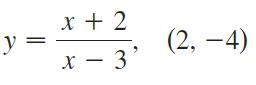
Find an equation of the tangent line to the curve at the given point.1 х+2 y = х — 3 (2, -4)
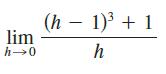
Find the limit. (h – 1) lim + 1 h0 h
Determine whether the statement is true or false. If it is true, explain why. If it is false, explain why or give an example that disproves the statement.If limx→5 f(x) = 0 and limx→5 g(x) = 0, then limx→5 [f(x) / g(x)] does not exist.
Sketch the graph of a function f that is defined on R and continuous except for the stated discontinuities.Removable discontinuity at -2, infinite discontinuity at 2
Trace or copy the graph of the given function f. (Assume that the axes have equal scales.) Then use the method of Example 1 to sketch the graph of f' below it. yA
Find an equation of the tangent line to the curve at the given point.1 у3 V1 - 3х, (-1, 2)
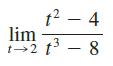
Find the limit. 12 – 4 lim 1-2 t - 8
Determine whether the statement is true or false. If it is true, explain why. If it is false, explain why or give an example that disproves the statement.If neither limx→a f(x) nor limx→a g(x) exists, then limx→a [f(x) + g(x)] does not exist.
Sketch the graph of a function f that is defined on R and continuous except for the stated discontinuities.Jump discontinuity at -3, removable discontinuity at 4
Trace or copy the graph of the given function f. (Assume that the axes have equal scales.) Then use the method of Example 1 to sketch the graph of f' below it. yA
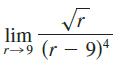
Find the limit. lim (r - 9)4
What does the Intermediate Value Theorem say?
If limx→a f(x) exists but limx→a g(x) does not exist, then limx→a [f(x) + g(x) does not exist.Determine whether the statement is true or false. If it is true, explain why. If it is false, explain why or give an example that disproves the statement.
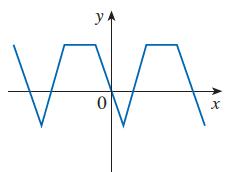
Trace or copy the graph of the given function f. (Assume that the axes have equal scales.) Then use the method of Example 1 to sketch the graph of f' below it. y
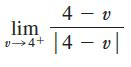
Find the limit. 4 - v lim 14 - v| リ→4+
Determine whether the statement is true or false. If it is true, explain why. If it is false, explain why or give an example that disproves the statement.If p is a polynomial, then limx→ap(x) = p(b).
Continuous only from the left at -1, not continuous from the left or right at 3. Sketch the graph of a function f that is defined on R and continuous except for the stated discontinuities.
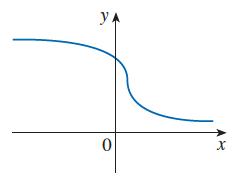
Trace or copy the graph of the given function f. (Assume that the axes have equal scales.) Then use the method of Example 1 to sketch the graph of f' below it. YA
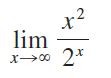
Guess the value of the limitby evaluating the function f(x) = x2/2x for x − 0, 1, 2, 3, 4, 5, 6, 7, 8, 9, 10, 20, 50, and 100. Then use a graph of f to support your guess. lim 00-x 2*
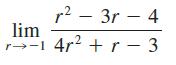
Find the limit. r2 – 3r – 4 lim 4r2 +r - 3 r--1
Suppose an object moves along a straight line with position f(t) at time t. Write an expression for the instantaneous velocity of the object at time t = a. How can you interpret this velocity in terms of the graph of f?
Determine whether the statement is true or false. If it is true, explain why. If it is false, explain why or give an example that disproves the statement.If limx→0 f(x) = ∞ and limx→0 g(x) = ∞, then limx→0 [f(x) - g(x)] = 0.
Sketch the graph of the function and use it to determine the values of a for which limx x → a f(x) exists. if x
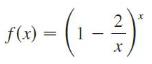
(a) Use a graph ofto estimate the value of limx→∞ f(x) correct to two decimal places.(b) Use a table of values of f(x) to estimate the limit to four decimal places. F(9) = (1 -2)
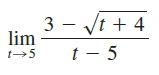
Find the limit. 3 - Vt + 4 lim t - 5
A function can have two different horizontal asymptotes.Determine whether the statement is true or false. If it is true, explain why. If it is false, explain why or give an example that disproves the statement.
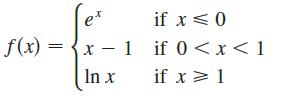
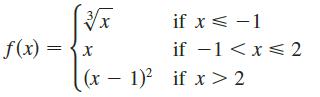
Sketch the graph of the function and use it to determine the values of a for which limx x → a f(x) exists. if x< -1 f(x) = if -1 2
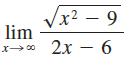
Find the limit. Vx² lim 2 - 9 — 9 x- 0 2x 6.
If f has domain [0, ∞] and has no horizontal asymptote, then limx→∞ f(x) = ∞ or limx→∞ f(x) = -∞.Determine whether the statement is true or false. If it is true, explain why. If it is false, explain why or give an example that disproves the statement.
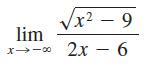
Find the limit. Vx² - 9 lim . 2x X -00
If the line x = 1 is a vertical asymptote of y = f(x), then f is not defined at 1.Determine whether the statement is true or false. If it is true, explain why. If it is false, explain why or give an example that disproves the statement.
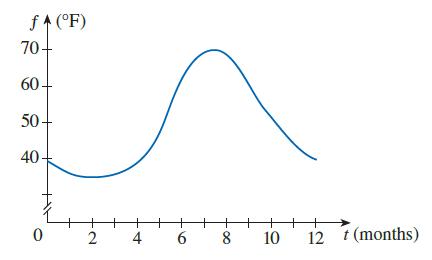
The graph shows how the average surface water temperature f of Lake Michigan varies over the course of a year (where t is measured in months with t = 0 corresponding to January 1). The average was calculated from data obtained over a 20-year period ending in 2011. Sketch the graph of the derivative
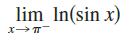
Find the limit. lim In(sin x)
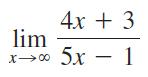
Find the limit or show that it does not exist. do 4х + 3 lim 5х — 1 X> 00
If f(1) > 0 and f(3) < 0, then there exists a number c between 1 and 3 such that f(c) = 0.Determine whether the statement is true or false. If it is true, explain why. If it is false, explain why or give an example that disproves the statement.
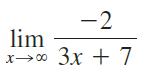
Find the limit or show that it does not exist.do -2 lim x→00 3x + 7
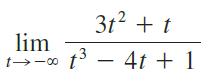
Find the limit or show that it does not exist. do 3t2 + t lim --0 t - 4t + 1
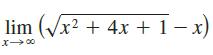
Find the limit. lim (Vx2 + 4x + 1- x)
If f is continuous on [-1, 1] and f(-1) = 4 and f(1) = 3, then there exists a number r such that |r | < 1 and f(r) = π.Determine whether the statement is true or false. If it is true, explain why. If it is false, explain why or give an example that disproves the statement.
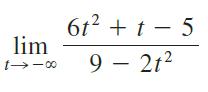
Find the limit or show that it does not exist. do 6t2 + t - 5 lim t -00 9 – 2t2
Find the limit. lim er-x2 X 00
Let f be a function such that limx→0 f(x) = 6. Then there exists a positive number δ such that if 0 < |x| < δ, then |f(x) - 6| < 1.Determine whether the statement is true or false. If it is true, explain why. If it is false, explain why or give an example that disproves the statement.
Showing 3400 - 3500
of 4932
First
28
29
30
31
32
33
34
35
36
37
38
39
40
41
42
Last
Step by Step Answers