New Semester
Started
Get
50% OFF
Study Help!
--h --m --s
Claim Now
Question Answers
Textbooks
Find textbooks, questions and answers
Oops, something went wrong!
Change your search query and then try again
S
Books
FREE
Study Help
Expert Questions
Accounting
General Management
Mathematics
Finance
Organizational Behaviour
Law
Physics
Operating System
Management Leadership
Sociology
Programming
Marketing
Database
Computer Network
Economics
Textbooks Solutions
Accounting
Managerial Accounting
Management Leadership
Cost Accounting
Statistics
Business Law
Corporate Finance
Finance
Economics
Auditing
Tutors
Online Tutors
Find a Tutor
Hire a Tutor
Become a Tutor
AI Tutor
AI Study Planner
NEW
Sell Books
Search
Search
Sign In
Register
study help
mathematics
elementary statistics picturing
Elementary Statistics Picturing The World 7th Edition Ron Larson, Betsy Farber - Solutions
A survey of 1020 U.S. adults found that 42% trust their political leaders.Identify the population and the sample. Describe the sample data set.
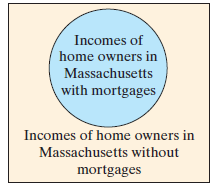
Use the Venn diagram to identify the population and the sample.Incomes of Home Owners in Massachusetts Incomes of home owners in Massachusetts with mortgages Incomes of home owners in Massachusetts without mortgages
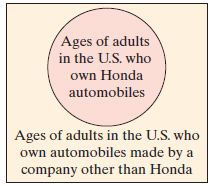
Use the Venn diagram to identify the population and the sample.Ages of Adults in the United States Who Own Automobiles Ages of adults in the U.S. who own Honda automobiles Ages of adults in the U.S. who own automobiles made by a company other than Honda
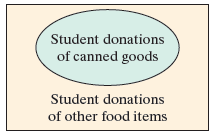
Use the Venn diagram to identify the population and the sample.Student Donations at a Food Drive Student donations of canned goods Student donations of other food items
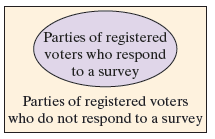
Use the Venn diagram to identify the population and the sample.Parties of Registered Voters Parties of registered voters who respond to a survey Parties of registered voters who do not respond to a survey
The air contamination levels at 20 locations near a factory.Determine whether the data set is a population or a sample. Explain your reasoning.
The political party of every U.S. senator.Determine whether the data set is a population or a sample. Explain your reasoning.
The age of every fourth person entering a grocery store.Determine whether the data set is a population or a sample. Explain your reasoning.
The final score of each gamer in a tournament.Determine whether the data set is a population or a sample. Explain your reasoning.
The number of wireless devices in each U.S. household.Determine whether the data set is a population or a sample. Explain your reasoning.
The triglyceride levels of 10 patients in a clinic with 50 patients.Determine whether the data set is a population or a sample. Explain your reasoning.
The annual revenue of each store in a shopping mall.Determine whether the data set is a population or a sample. Explain your reasoning.
A survey of 300 people from an auditorium with 13,000 people.Determine whether the data set is a population or a sample. Explain your reasoning.
The amount of energy collected from every solar panel on a photovoltaic power plant.Determine whether the data set is a population or a sample. Explain your reasoning.
The salary of each member of a Major League Baseball team.Determine whether the data set is a population or a sample. Explain your reasoning.
A sample statistic will not change from sample to sample.Determine whether the statement is true or false. If it is false, rewrite it as a true statement.
A population is the collection of some outcomes, responses, measurements, or counts that are of interest.Determine whether the statement is true or false. If it is false, rewrite it as a true statement.
Inferential statistics involves using a population to draw a conclusion about a corresponding sample.Determine whether the statement is true or false. If it is false, rewrite it as a true statement.
It is impossible to obtain all the census data about the U.S. population.Determine whether the statement is true or false. If it is false, rewrite it as a true statement.
A sample is a subset of a population.Determine whether the statement is true or false. If it is false, rewrite it as a true statement.
A statistic is a numerical description of a population characteristic.Determine whether the statement is true or false. If it is false, rewrite it as a true statement.
What are the two main branches of statistics?
What is the difference between a parameter and a statistic?
Why is a sample used more often than a population?
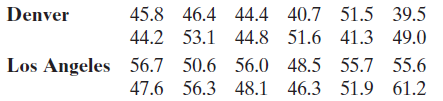
Sample annual salaries (in thousands of dollars) for entry level architects in Denver, CO, and Los Angeles, CA, are listed.Find the coefficient of variation for each of the two data sets. Then compare the results. 45.8 46.4 44.4 40.7 51.5 39.5 44.2 53.1 44.8 51.6 41.3 49.0 Los Angeles 56.7 50.6
The four departments of a printing company are listed.Administration Sales Production BillingDetermine the level of measurement of the data set. Explain.
Observational studies are sometimes referred to as natural experiments. Explain, in your own words, what this means.
How does the media influence the opinions of voters?Determine whether the survey question is biased. If the question is biased, suggest a better wording.
How much do you exercise during an average week?Determine whether the survey question is biased. If the question is biased, suggest a better wording.
Why does text messaging while driving increase the risk of a crash?Determine whether the survey question is biased. If the question is biased, suggest a better wording.
Why does eating whole-grain foods improve your health?Determine whether the survey question is biased. If the question is biased, suggest a better wording.
The most popular type of movie among 100,000 online movie rental subscribersDetermine whether you would take a census or use a sampling. If you would use a sampling, determine which sampling technique you would use. Explain.
The average age of the 115 residents of a retirement community.Determine whether you would take a census or use a sampling. If you would use a sampling, determine which sampling technique you would use. Explain.
Soybeans are planted on a 48-acre field. The field is divided into one-acre subplots. A sample is taken from each subplot to estimate the harvest.Identify the sampling technique used, and discuss potential sources of bias (if any). Explain.
Every tenth person entering a mall is asked to name his or her favorite store.Identify the sampling technique used, and discuss potential sources of bias (if any). Explain.
After a hurricane, a disaster area is divided into 200 equal grids. Thirty of the grids are selected, and every occupied household in the grid is interviewed to help focus relief efforts on what residents require the most.Identify the sampling technique used, and discuss potential sources of bias
Questioning university students as they leave a fraternity party, a researcher asks 463 students about their study habits.Identify the sampling technique used, and discuss potential sources of bias (if any). Explain.
Selecting employees at random from an employee directory, researchers contact 300 people and ask what obstacles (such as computer problems) keep them from accomplishing tasks at work.Identify the sampling technique used, and discuss potential sources of bias (if any). Explain.
Researchers in Germany tested the effect of a dietary supplement designed to control metabolism in patients with type 2 diabetes. Thirty-one patients with type 2 diabetes completed the study. The patients were assigned at random either the supplement or a placebo for 12 weeks. After a subsequent
A pharmaceutical company wants to test the effectiveness of a new drug used to treat migraine headaches. The company identifies 500 females ages 25 to 45 years old who suffer from migraine headaches. The subjects are randomly assigned into two groups. One group is given the drug and the other is
In a study designed to research the effect of music on driving habits, 1000 motorists ages 17–25 years old were asked whether the music they listened to influenced their driving.Determine whether the study is an observational study or an experiment. Explain.
To study the effects of social media on teenagers’ brains, researchers showed a few dozen teenagers photographs that had varying numbers of “likes” while scanning the reactions in their brains.Determine whether the study is an observational study or an experiment. Explain.
Researchers demonstrated that adults using an intensive program to lower systolic blood pressure to less than 120 millimeters of mercury reduce the risk of death from all causes by 27%.Determine whether the study is an observational study or an experiment. Explain.
In a survey of 1033 U.S. adults, 51% said U.S. presidents should release all medical information that might affect their ability to serve.Determine whether the study is an observational study or an experiment. Explain.
To select a cluster sample, divide a population into groups and then select all of the members in at least one (but not all) of the groups.Determine whether the statement is true or false. If it is false, rewrite it as a true statement.
The method for selecting a stratified sample is to order a population in some way and then select members of the population at regular intervals.Determine whether the statement is true or false. If it is false, rewrite it as a true statement.
A convenience sample is always representative of a population.Determine whether the statement is true or false. If it is false, rewrite it as a true statement.
Using a systematic sample guarantees that members of each group within a population will be sampled.Determine whether the statement is true or false. If it is false, rewrite it as a true statement.
A double-blind experiment is used to increase the placebo effect.Determine whether the statement is true or false. If it is false, rewrite it as a true statement.
A placebo is an actual treatment.Determine whether the statement is true or false. If it is false, rewrite it as a true statement.
What is replication in an experiment? Why is replication important?
What is the difference between a random sample and a simple random sample?
What is the difference between a census and a sampling?
What is an inherent zero? Describe three examples of data sets that have inherent zeros and three that do not.
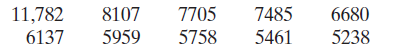
The numbers of performances for the 10 longest-running Broadway shows at the end of the 2016 season are listed.Determine whether the data are qualitative or quantitative, and determine the level of measurement of the data set. 7705 7485 5461 11,782 6137 8107 6680 5758 5959 5238
The top ten highest grossing worldwide concert tours for 2016 are listed.1. Bruce Springsteen & the E Street Band2. Beyoncé3. Coldplay4. Guns N’ Roses5. Adele 6. Justin Bieber7. Paul McCartney8. Garth Brooks9. The Rolling Stones10. Celine DionDetermine whether the data are qualitative
The scores for the gold medal winning diver in the men’s 10-meter platform event from the 2016 Summer Olympics are listed.91.80 91.00 88.2097.20 99.90 91.80Determine whether the data are qualitative or quantitative, and determine the level of
The regions representing the top salespeople in a corporation for the past six years are listed.Southeast NorthwestNortheast SoutheastSouthwest SouthwestDetermine whether the data are qualitative
The three political parties in the 114th Congress are listed.Republican Democrat IndependentDetermine whether the data are qualitative or quantitative, and determine the level of measurement of the data set.
The top ten teams in the final college football poll released in January 2017 are listed. 1. Clemson2. Alabama3. USC4. Washington5. Oklahoma 6. Ohio State7. Penn State8. Florida State9. Wisconsin10. MichiganDetermine whether the data are qualitative or quantitative, and determine the
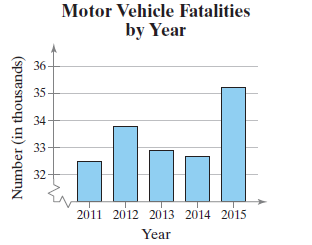
Determine the level of measurement of the data listed on the horizontal and vertical axes in the figure.Motor Vehicle Fatalities by Year Motor Vehicle Fatalities by Year 36 35 34 33 32 2011 2012 2013 2014 2015 Year Number (in thousands)
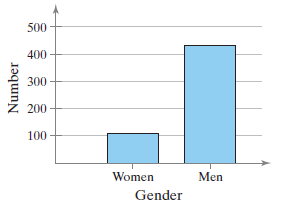
Determine the level of measurement of the data listed on the horizontal and vertical axes in the figure.Gender Profile of the 114th Congress 500 400 300 200 100 Women Men Gender Number
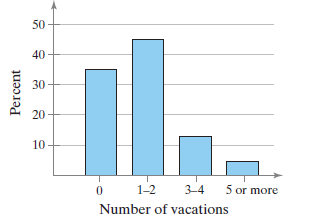
Determine the level of measurement of the data listed on the horizontal and vertical axes in the figure.How Many Vacations Are You Planning to Take This Summer? 50 40 30 20 10 5 or more 1-2 3-4 Number of vacations Percent
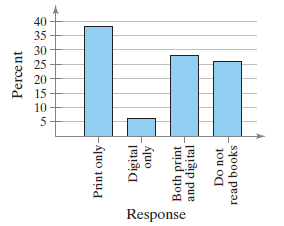
Determine the level of measurement of the data listed on the horizontal and vertical axes in the figure.What is the Format of the Books You Read? Response Percent Print only- Digital only Both print and digital Do not read books
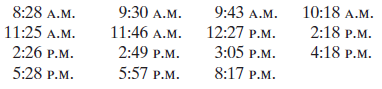
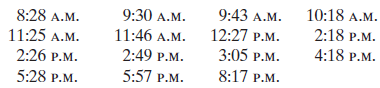
The times of the day when a person checks his or her cell phone are listed.Determine the level of measurement of the data set. Explain your reasoning. 10:18 A.M. 2:18 P.M. 4:18 P.M. 9:43 A.M. 9:30 A.M. 11:46 A.M. 2:49 P.M. 5:57 P.M. 8:28 A.M. 12:27 P.M. 3:05 P.M. 8:17 Р.м. 11:25 A.M. 2:26 P.M.
The top ten fiction books on The New York Times Best Sellers List on October 9, 2016, are listed.1. The Girl on the Train2. Home3. The Kept Woman4. Magic Binds5. Commonwealth 6. The Light Between Oceans7. Immortal Nights8. A Man Called Ove9. Thrice the Brinded Cat Hath Mew’d10. The Woman in
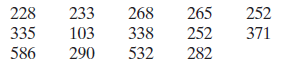
The lengths (in seconds) of songs on an album are listed.Determine the level of measurement of the data set. Explain your reasoning. 268 338 532 252 371 228 335 233 103 265 252 586 290 282
The times of the day when a person checks his or her cell phone are listed.Determine the level of measurement of the data set. Explain your reasoning. 10:18 A.M. 2:18 P.M. 4:18 P.M. 9:43 А.м. 12:27 P.M. 3:05 P.M. 8:17 P.M. 9:30 A.M. 11:46 A.M. 2:49 P.M. 5:57 P.M. 8:28 A.M. 11:25 A.M. 2:26 P.M.
The top ten fiction books on The New York Times Best Sellers List on October 9, 2016, are listed.1. The Girl on the Train2. Home3. The Kept Woman4. Magic Binds5. Commonwealth 6. The Light Between Oceans7. Immortal Nights8. A Man Called Ove9. Thrice the Brinded Cat Hath Mew’d10. The Woman in
The years that a television show on ABC won the Emmy for best comedy series are listed.Determine the level of measurement of the data set. Explain your reasoning. 1981 2013 1955 1979 2011 1980 2012 1982 2014 1988 2010
Wait times at a the Department of Motor VehiclesDetermine whether the data are qualitative or quantitative. Explain your reasoning.
Responses on an opinion pollDetermine whether the data are qualitative or quantitative. Explain your reasoning.
Species of mammals in a rain forest.Determine whether the data are qualitative or quantitative. Explain your reasoning.
Heights of infants in a maternity ward.Determine whether the data are qualitative or quantitative. Explain your reasoning.
Student ID numbers.Determine whether the data are qualitative or quantitative. Explain your reasoning.
Hair colors of classmates.Determine whether the data are qualitative or quantitative. Explain your reasoning.
Carrying capacities of flatbed trucks.Determine whether the data are qualitative or quantitative. Explain your reasoning.
Weights of dogs at an animal rescue facility.Determine whether the data are qualitative or quantitative. Explain your reasoning.
Data at the ratio level cannot be put in order.Whether the statement is true or false. If it is false, rewrite it as a true statement.
More types of calculations can be performed with data at the nominal level than with data at the interval level.Whether the statement is true or false. If it is false, rewrite it as a true statement.
For data at the interval level, you cannot calculate meaningful differences between data entries.Whether the statement is true or false. If it is false, rewrite it as a true statement.
Data at the ordinal level are quantitative only.Whether the statement is true or false. If it is false, rewrite it as a true statement.
Name each level of measurement for which data can be quantitative.
Name each level of measurement for which data can be qualitative.
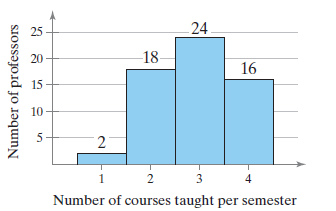
The numbers of courses taught per semester by a random sample of university professors are shown in the histogram.Make a frequency distribution for the data. Then use the table to estimate the sample mean and the sample standard deviation of the data set. 24 25 18- 20 16 15 10 5- 2 3 4 Number of
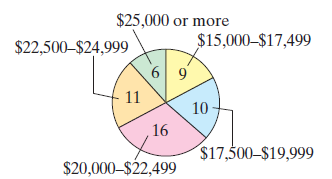
The distribution of the tuitions, fees, and room and board charges of a random sample of public 4-year degree-granting postsecondary institutions is shown in the pie chart. Use $26,249.50 as the midpoint for “$25,000 or more.”Make a frequency distribution for the data. Then use the table to
Make a frequency distribution for the data. Then use the table to find the sample mean and the sample standard deviation of the data set. 1 1 1 00 0 0 0 1 0 1 0 0 1 0 1 1 0 0 0 0 1 0 0 1 1 10 0 1 1 0 0 0 0 0 1 0 1 1 1 0 0 0 0 1 1 0 0 0
Make a frequency distribution for the data. Then use the table to find the sample mean and the sample standard deviation of the data set. 3 3 5 3 8 0 3 9 6 6 7 1 6 3 2 6 9 1 8 5 0 2 3 4 9 5 8 1 9 7 6 9 6 7 0 6 3 8 6 8 7 3 8 9 3 7 2 4 4
The mean number of runs per game scored by the Chicago Cubs during the 2016 World Series was 3.86 runs, with a standard deviation of 3.36 runs. Apply Chebychev’s Theorem to the data using k = 2. Interpret the results.
The mean score on a Statistics exam is 82 points, with a standard deviation of 3 points. Apply Chebychev’s Theorem to the data using k = 4. Interpret the results.
Old Faithful is a famous geyser at Yellowstone National Park. From a sample with n = 100, the mean interval between Old Faithful’s eruptions is 101.56 minutes and the standard deviation is 42.69 minutes. Using Chebychev’s Theorem, determine at least how many of the intervals lasted between
Toledo, OH, Average Normal Temperatures (Fo)Class. . . . . . . . . . . .. Frequency, f25–32 . . . . . . . . . . . .. 8633 – 40. . . . . . . . . . . . 3941– 48. . . . . . . . . . . .. 4149–56. . . . . . . . . . . .. 4857– 64. . . . . . . . . . . . 4365–72 . . . . . . . . . . . .
Use the frequency distribution to find the (a) class width, (b) class midpoints, and (c) class boundaries.Travel Time to Work (in minutes)Class . . . . . . . . . . Frequency, f0 –10 . . . . . . . . . . .18811–21 . . . . . . . . . . 37222–32 . . . . . . . . . .26433 – 43. . . . . . . . .
Class boundaries ensure that consecutive bars of a histogram touch.Determine whether the statement is true or false. If it is false, rewrite it as a true statement.
An ogive is a graph that displays relative frequencies.Determine whether the statement is true or false. If it is false, rewrite it as a true statement.
The midpoint of a class is the sum of its lower and upper limits divided by two.Determine whether the statement is true or false. If it is false, rewrite it as a true statement.
In a frequency distribution, the class width is the distance between the lower and upper limits of a class.Determine whether the statement is true or false. If it is false, rewrite it as a true statement.
What is the difference between a frequency polygon and an ogive?
After constructing an expanded frequency distribution, what should the sum of the relative frequencies be? Explain.
What is the difference between relative frequency and cumulative frequency?
Showing 2800 - 2900
of 2934
First
16
17
18
19
20
21
22
23
24
25
26
27
28
29
30
Step by Step Answers