New Semester
Started
Get
50% OFF
Study Help!
--h --m --s
Claim Now
Question Answers
Textbooks
Find textbooks, questions and answers
Oops, something went wrong!
Change your search query and then try again
S
Books
FREE
Study Help
Expert Questions
Accounting
General Management
Mathematics
Finance
Organizational Behaviour
Law
Physics
Operating System
Management Leadership
Sociology
Programming
Marketing
Database
Computer Network
Economics
Textbooks Solutions
Accounting
Managerial Accounting
Management Leadership
Cost Accounting
Statistics
Business Law
Corporate Finance
Finance
Economics
Auditing
Tutors
Online Tutors
Find a Tutor
Hire a Tutor
Become a Tutor
AI Tutor
AI Study Planner
NEW
Sell Books
Search
Search
Sign In
Register
study help
mathematics
elementary statistics picturing
Elementary Statistics 11th Edition Mario F. Triola - Solutions
When a fair die is rolled many times, the outcomes of 1, 2, 3, 4, 5, and 6 are equally likely, so the mean of the outcomes should be 3.5. The author drilled holes into a die and loaded it by inserting lead weights, then rolled it 16 times to obtain a mean of 2.9375. Assume that the standard
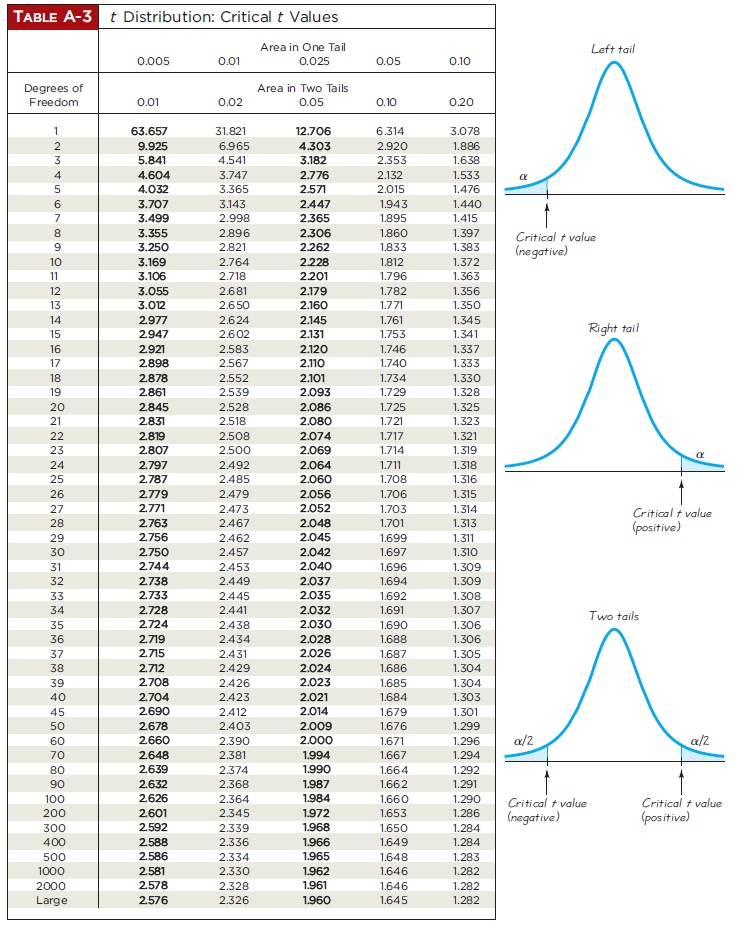
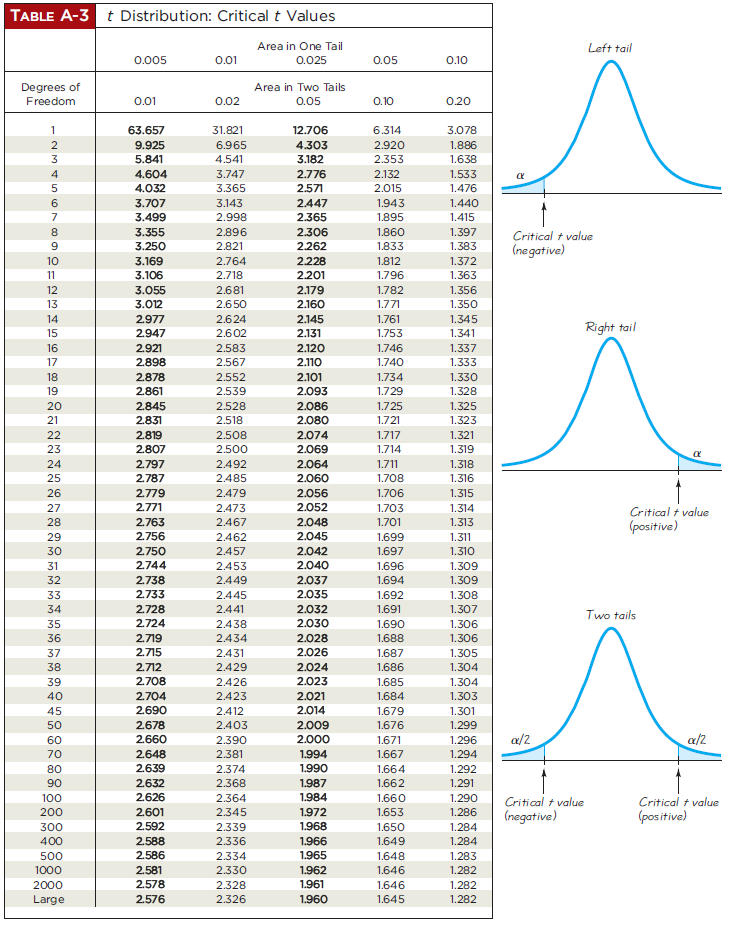
Test a claim about the mean body temperature of healthy adults: Left-tailed test with n = 11 and test statistic t = - 3.518. Either use technology to find the P-value or use Table A-3 to find a range of values for the P-value. TABLE A-3 t Distribution: Critical t Values Area in One Tail 0.025
The heights are measured for the simple random sample of supermodels Crawford, Bundchen, Pestova, Christenson, Hume, Moss, Campbell, Schiffer, and Taylor. Those heights have a mean of 70.0 in. and a standard deviation of 1.5 in. Use a 0.05 significance level to test the claim that supermodels have
The standard deviation of duration times (in seconds) of the Old Faithful geyser is less than 40 sec.Examine the given statement, then express the null hypothesis H0 and alternative hypothesis H1 in symbolic form. Be sure to use the correct symbol (μ, p, σ) for the indicated parameter.
Clinical trials involved treating flu patients with Tamiflu, which is a medicine intended to attack the influenza virus and stop it from causing flu symptoms. Among 724 patients treated with Tamiflu, 72 experienced nausea as an adverse reaction. Use a 0.05 significance level to test the claim that
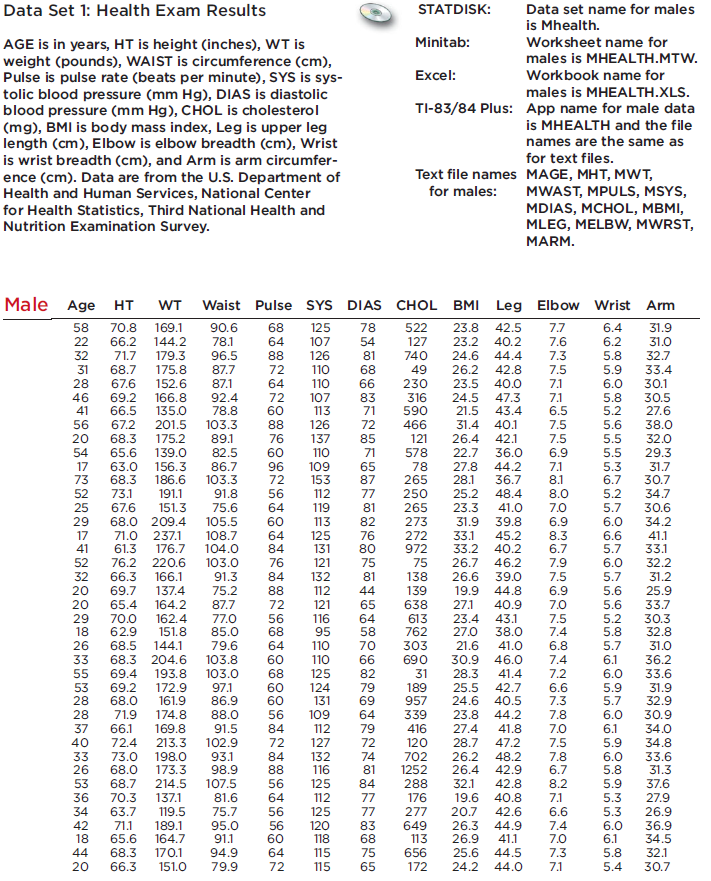
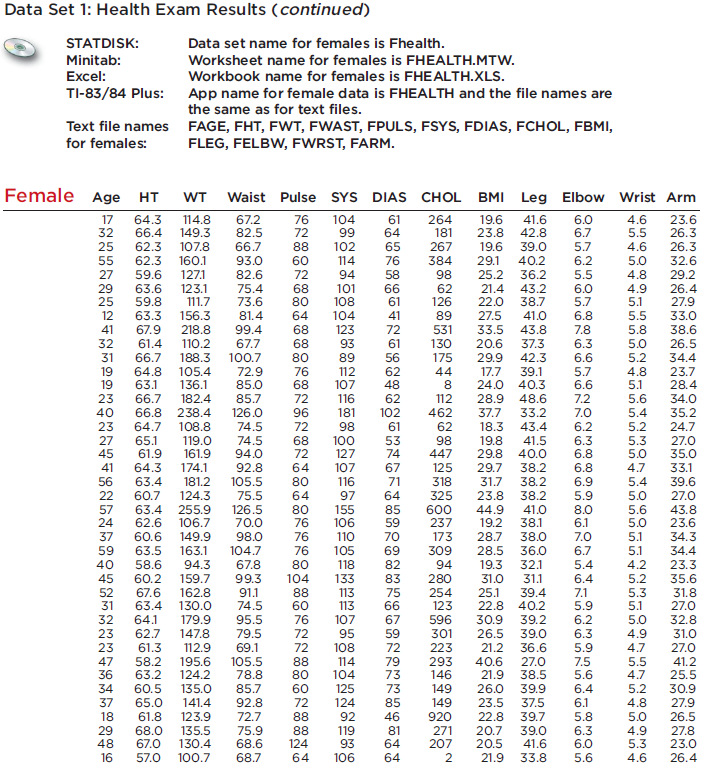
A student of the author measured the sitting heights of 36 male classmate friends, and she obtained a mean of 92.8 cm. The population of males has sitting heights with a mean of 91.4 cm and a standard deviation of 3.6 cm (based on anthropometric survey data from Gordon, Churchill, et al.). Use a
In the KLF Publications manual ?How to Have a Number One the Easy Way,? it is stated that a song ?must be no longer than three minutes and thirty seconds? (or 210 seconds). A simple random sample of 40 current hit songs results in a mean length of 252.5 sec and a standard deviation of 54.5 sec.
The standard deviation of daily rainfall amounts in San Francisco is 0.66 cm.Examine the given statement, then express the null hypothesis H0 and alternative hypothesis H1 in symbolic form. Be sure to use the correct symbol (μ, p, σ) for the indicated parameter.
A simple random sample of pulse rates of 40 women results in a standard deviation of 12.5 beats per minute (based on Data Set 1 in Appendix B). The normal range of pulse rates of adults is typically given as 60 to 100 beats per minute. If the range rule of thumb is applied to that normal range, the
The proportion of homes with fire extinguishers is 0.80.Examine the given statement, then express the null hypothesis H0 and alternative hypothesis H1 in symbolic form. Be sure to use the correct symbol (μ, p, σ) for the indicated parameter.
The mean weight of plastic discarded by households in one week is less than 1 kg.Examine the given statement, then express the null hypothesis H0 and alternative hypothesis H1 in symbolic form. Be sure to use the correct symbol (μ, p, σ) for the indicated parameter.
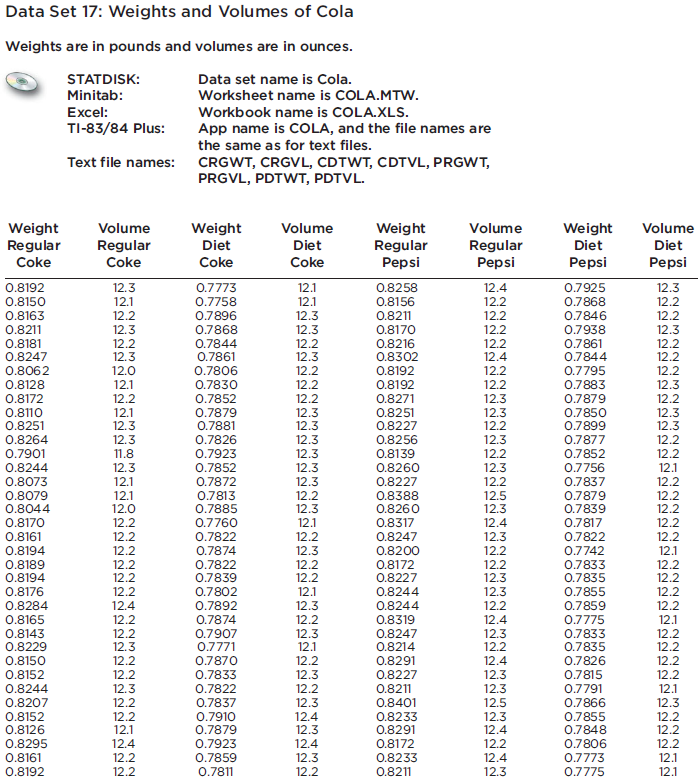
A simple random sample of 36 cans of regular Coke has a mean volume of 12.19 oz (based on Data Set 17 in Appendix B). Assume that the standard deviation of all cans of regular Coke is 0.11 oz. Use a 0.01 significance level to test the claim that cans of regular Coke have volumes with a mean of 12
Listed below are body mass indexes (BMI) for recent Miss America winners. Use a 0.01 significance level to test the claim that recent Miss America winners are from a population with a standard deviation of 1.34, which was the standard deviation of BMI for winners from the 1920s and 1930s. Do recent
Assume that the normal distribution applies and find the critical z values.Two-tailed test; α = 0.01.
When testing gas pumps in Michigan for accuracy, fuel-quality enforcement specialists tested pumps and found that 1299 of them were not pumping accurately (within 3.3 oz when 5 gal is pumped), and 5686 pumps were accurate. Use a 0.01 significance level to test the claim of an industry
Tests of older baseballs showed that when dropped 24 ft onto a concrete surface, they bounced an average of 235.8 cm. In a test of 40 new baseballs, the bounce heights had a mean of 235.4 cm. Assume that the standard deviation of bounce heights is 4.5 cm (based on data from Brookhaven National
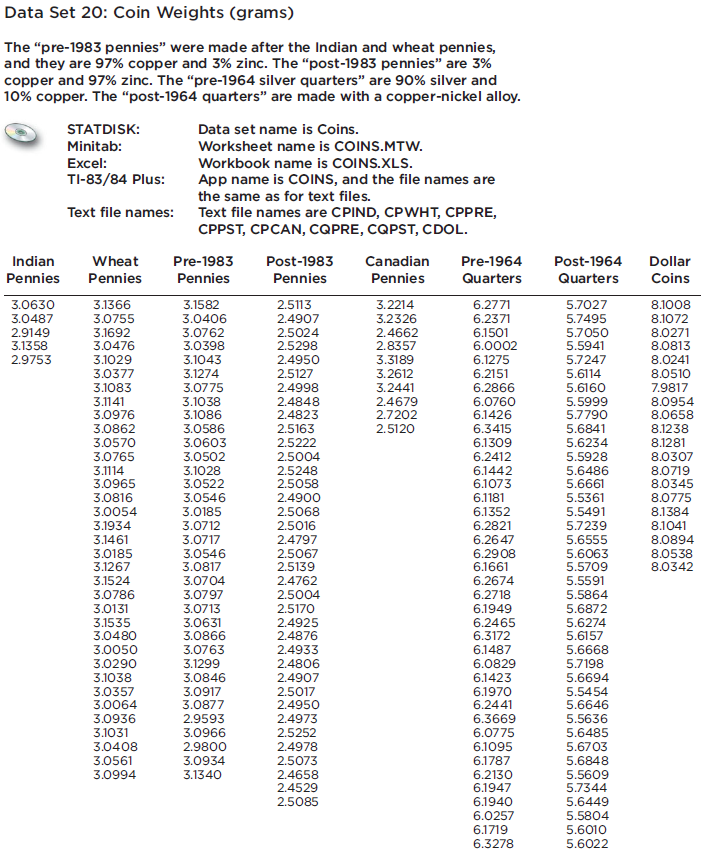
The U.S. Mint has a specification that pennies have a mean weight of 2.5 g. Data Set 20 in Appendix B lists the weights (in grams) of 37 pennies manufactured after 1983. Those pennies have a mean weight of 2.49910 g and a standard deviation of 0.01648 g. Use a 0.05 significance level to test the
Listed below are birth weights (in kilograms) of male babies born to mothers on a special vitamin supplement (based on data from the New York State Department of Health). Test the claim that this sample comes from a population with a standard deviation equal to 0.470 kg, which is the standard
Assume that the normal distribution applies and find the critical z values.Two-tailed test; α = 0.10.
The Genetics and IVF Institute conducted a clinical trial of the YSORT method designed to increase the probability that a baby is a boy. As of this writing, among the babies born to parents using the YSORT method, 172 were boys and 39 were girls. Use the sample data with a 0.01 significance level
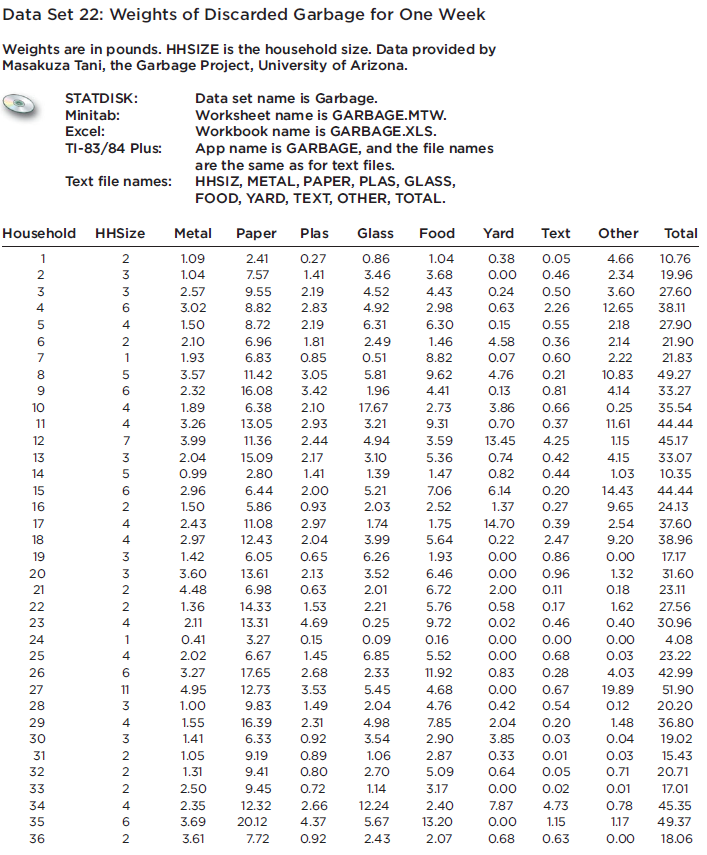
The totals of the individual weights of garbage discarded by 62 households in one week have a mean of 27.443 lb (based on Data Set 22 in Appendix B). Assume that the standard deviation of the weights is 12.458 lb. Use a 0.05 significance level to test the claim that the population of households has
Assume that the normal distribution applies and find the critical z values.Right-tailed test; α = 0.02.
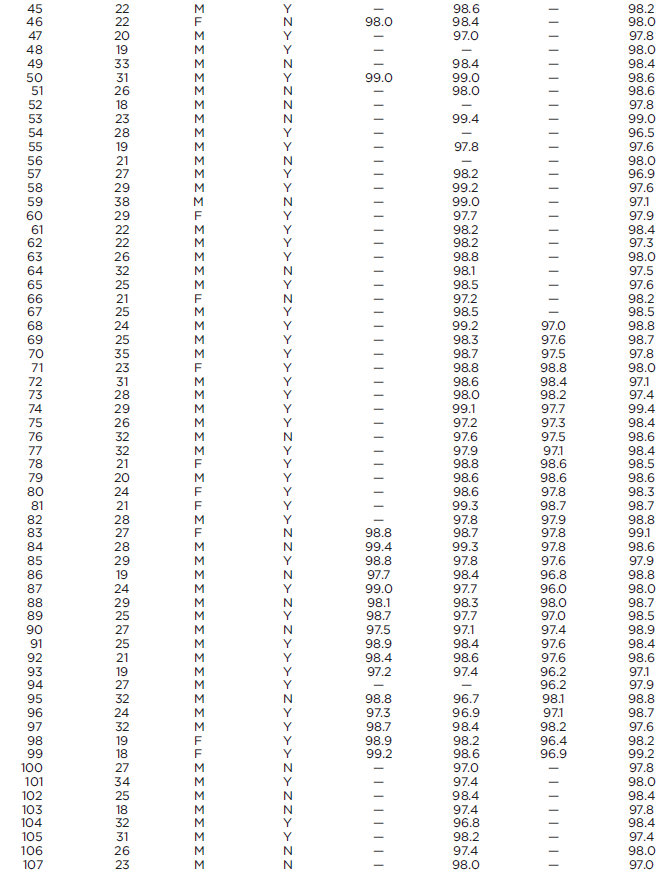
A simple random sample of FICO credit rating scores is obtained, and the scores are listed below. As of this writing, the mean FICO score was reported to be 678. Assuming the the standard deviation of all FICO scores is known to be 58.3, use a 0.05 significance level to test the claim that these
Researchers collected a simple random sample of the times that 81college students required to earn their bachelor’s degrees. The sample has a mean of 4.8 years and a standard deviation of 2.2 years (based on data from the National Center for Education Statistics). Use a 0.05 significance level to
Listed below are the playing times (in seconds) of songs that were popular at the time of this writing. (The songs are by Timberlake, Furtado, Daughtry, Stefani, Fergie, Akon, Ludacris, Beyonce, Nickelback, Rihanna, Fray, Lavigne, Pink, Mims, Mumidee, and Omarion.) Use a 0.05 significance level to
Assume that the normal distribution applies and find the critical z values.Left-tailed test; α = 0.10.
Listed below are recorded speeds (in mi h) of randomly selected cars traveling on a section of Highway 405 in Los Angeles (based on data from Sigalert). That part of the highway has a posted speed limit of 65 mi h. Assume that the standard deviation of speeds is 5.7 mi h and use a 0.01 significance
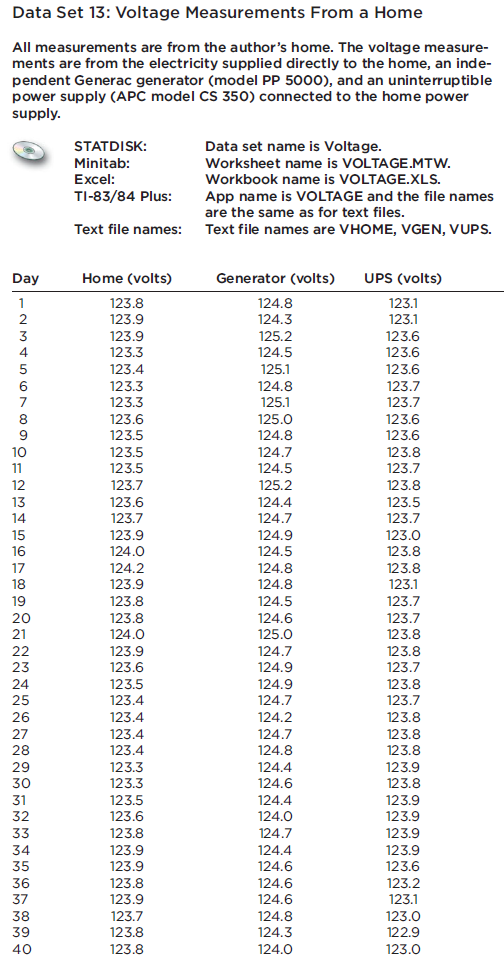
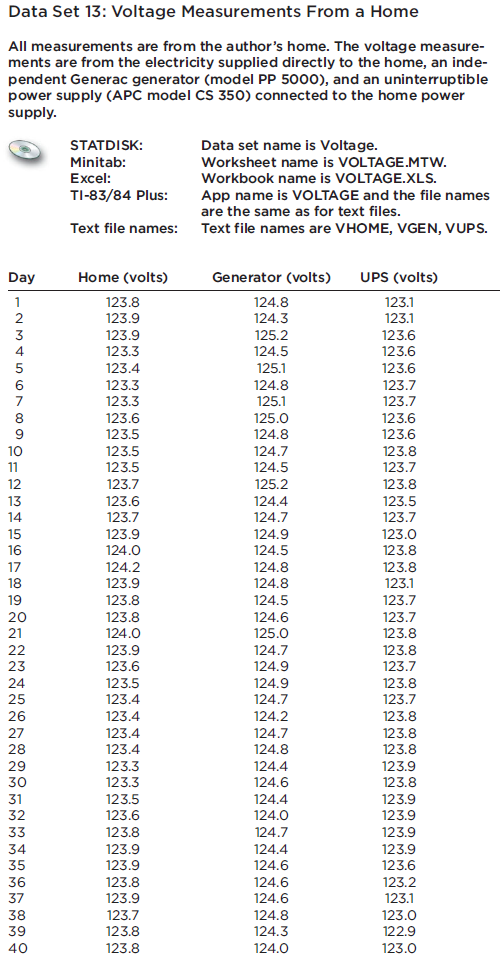
Data Set 13 in Appendix B lists measured voltage amounts obtained from the author?s back-up UPS (APC model CS 350). According to the manufacturer, the normal output voltage is 120 volts. The 40 measured voltage amounts from Data Set 13 have a mean of 123.59 volts and a standard deviation of 0.31
Assume that the normal distribution applies and find the critical z values.α = 0.05; H1 is p ≠ 98.6°F
A recently televised broadcast of 60 Minutes had a 15 share, meaning that among 5000 monitored households with TV sets in use, 15% of them were tuned to 60 Minutes. Use a 0.01 significance level to test the claim of an advertiser that among the households with TV sets in use, less than 20% were
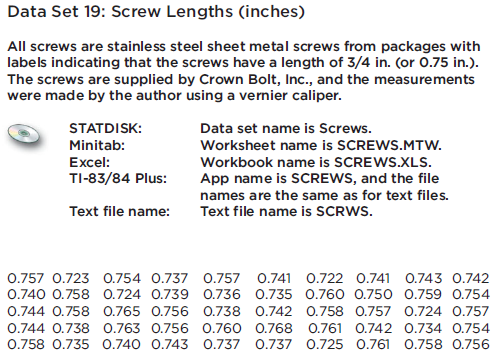
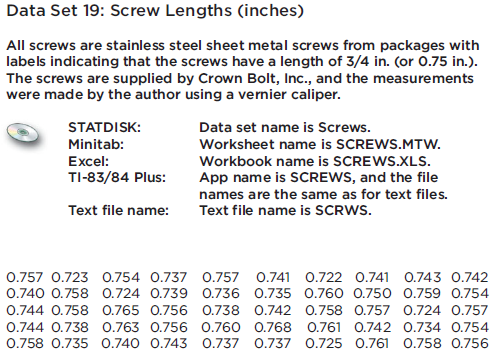
A simple random sample of 50 stainless steel sheet metal screws is obtained from those suppled by Crown Bolt, Inc., and the length of each screw is measured using a vernier caliper. The lengths are listed in Data Set 19 of Appendix B. Assume that the standard deviation of all such lengths is 0.012
In an analysis investigating the usefulness of pennies, the cents portions of 100 randomly selected checks are recorded. The sample has a mean of 23.8 cents and a standard deviation of 32.0 cents. If the amounts from 0 cents to 99 cents are all equally likely, the mean is expected to be 49.5 cents.
Assume that the normal distribution applies and find the critical z values.α = 0.01; H1 is p > 0.5.
In recent years, the Town of Newport experienced an arrest rate of 25% for robberies (based on FBI data). The new sheriff compiles records showing that among 30 recent robberies, the arrest rate is 30%, so she claims that her arrest rate is greater than the 25% rate in the past. Is there sufficient
Data Set 13 in Appendix B lists measured voltage amounts supplied directly to the author?s home. The Central Hudson power supply company states that it has a target power supply of 120 volts. Using those home voltage amounts and assuming that the standard deviation of all such voltage amounts is
A simple random sample of 40 recorded speeds (in mi h) is obtained from cars traveling on a section of Highway 405 in Los Angeles. The sample has a mean of 68.4 mi h and a standard deviation of 5.7 mi h (based on data from Sigalert). Use a 0.05 significance level to test the claim that the mean
Assume that the normal distribution applies and find the critical z values.α = 0.005; H1 is p < 5280 ft.
In an Accountemps survey of 150 senior executives, 47.3% said that the most common job interview mistake is to have little or no knowledge of the company. Test the claim that in the population of all senior executives, 50% say that the most common job interview mistake is to have little or no
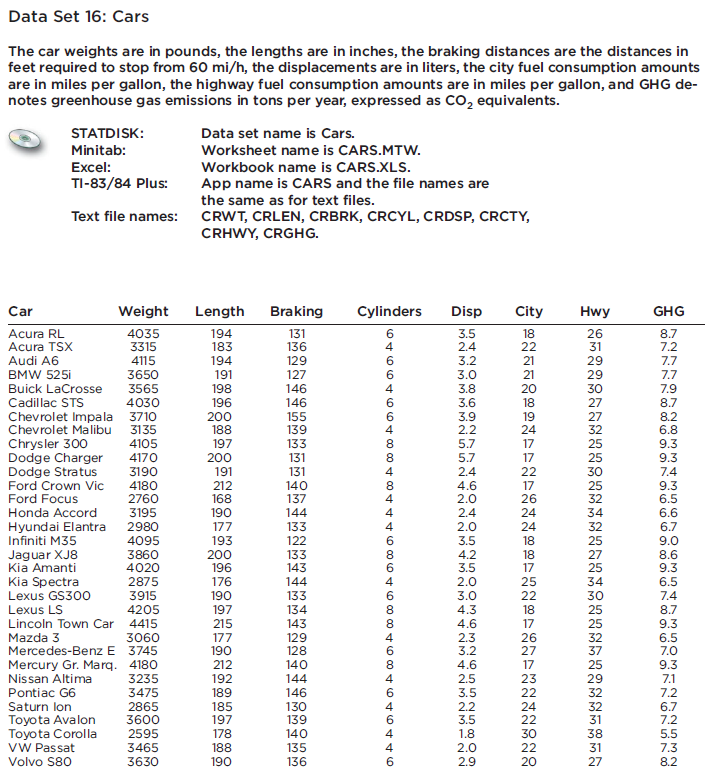
Data Set 16 in Appendix B lists the measured greenhouse gas emissions from 32 different cars. The sample has a mean of 7.78 tons and a standard deviation of 1.08 tons. (The amounts are in tons per year, expressed as CO2 equivalents.) Use a 0.05 significance level to test the claim that all cars
Assume that the normal distribution applies and find the critical z values.α = 0.005; H1 is p ≠ 45 mm
A survey showed that among 785 randomly selected subjects who completed four years of college, 18.3% smoke and 81.7% do not smoke (based on data from the American Medical Association). Use a 0.01 significance level to test the claim that the rate of smoking among those with four years of college is
The heights are measured for the simple random sample of supermodels Crawford, Bundchen, Pestova, Christenson, Hume, Moss, Campbell, Schiffer, and Taylor. They have a mean height of 70.0 in. and a standard deviation of 1.5 in. Use a 0.01 significance level to test the claim that supermodels have
When 3011 adults were surveyed in a Pew Research Center poll, 73% said that they use the Internet. Is it okay for a newspaper reporter to write that “3/4 of all adults use the Internet”? Why or why not?
The claim is that less than 1 2 of adults in the United States have carbon monoxide detectors. A KRC Research survey of 1005 adults resulted in 462 who have carbon monoxide detectors. Find the value of the test statistic z using 12 P-P pq V n
As part of a Pew Research Center poll, subjects were asked if there is solid evidence that the earth is getting warmer. Among 1501 respondents, 20% said that there is not such evidence. Use a 0.01 significance level to test the claim that less than 25% of the population believes that there is not
The claim is that more than 25% of adults prefer Italian food as their favorite ethnic food. A Harris Interactive survey of 1122 adults resulted in 314 who say that Italian food is their favorite ethnic food. Find the value of the test statistic z using 12 P-P pq V n
The Insurance Institute for Highway Safety conducted tests with crashes of new cars traveling at 6 mi h. The total cost of the damage was found. Results are listed below for a simple random sample of the tested cars. Use a 0.05 significance level to test the claim that when tested under the same
The claim is that more than 75% of adults always wear a seat belt in the front seat. A Harris Poll of 1012 adults resulted in 870 who say that they always wear a seat belt in the front seat. Find the value of the test statistic z using 12 P-P pq V n
The test statistic in a left-tailed test is z = - 1.25.Use the given information to find the P-value. Also, use a 0.05 significance level and state the conclusion about the null hypothesis (reject the null hypothesis or fail to reject the null hypothesis).
A simple random sample of 50 stainless steel sheet metal screws is obtained from those supplied by Crown Bolt, Inc., and the length of each screw is measured using a Vernier caliper. The lengths are listed in Data Set 19 of Appendix B. Use a 0.05 significance level to test the claim that the screws
The test statistic in a right-tailed test is z = 2.50.Use the given information to find the P-value. Also, use a 0.05 significance level and state the conclusion about the null hypothesis (reject the null hypothesis or fail to reject the null hypothesis).
The test statistic in a two-tailed test is z = 1.75.Use the given information to find the P-value. Also, use a 0.05 significance level and state the conclusion about the null hypothesis (reject the null hypothesis or fail to reject the null hypothesis).
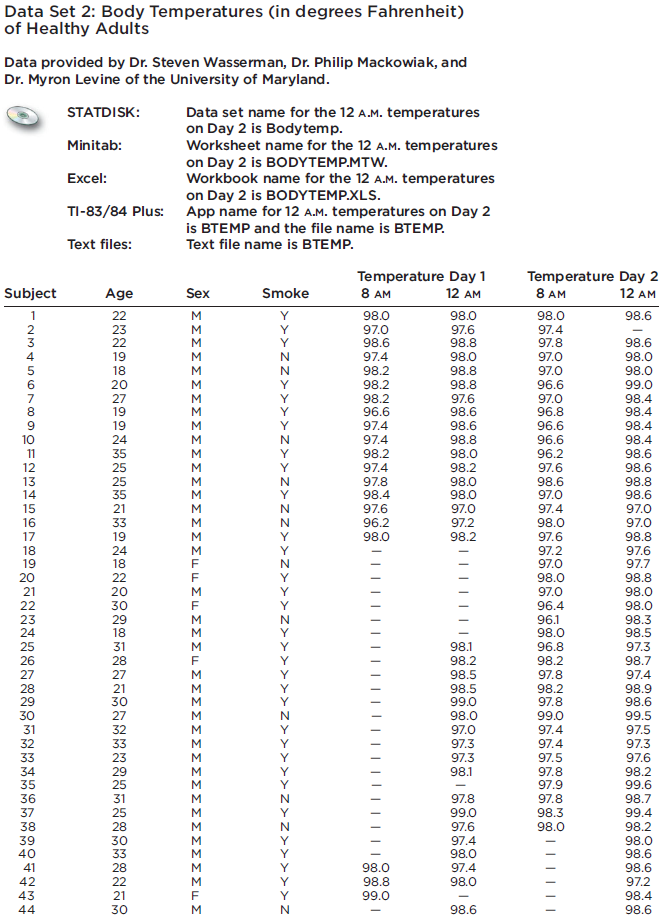
Data Set 2 in Appendix B includes measured human body temperatures. Use the temperatures listed for 12 AM on day 2 to test the common belief that the mean body temperature is 98.6?F. Does that common belief appear to be wrong? Data Set 2: Body Temperatures (in degrees Fahrenheit) of Healthy
The test statistic in a two-tailed test is z = - 0.55.Use the given information to find the P-value. Also, use a 0.05 significance level and state the conclusion about the null hypothesis (reject the null hypothesis or fail to reject the null hypothesis).
When Gregor Mendel conducted his famous hybridization experiments with peas, one such experiment resulted in 580 offspring peas, with 26.2% of them having yellow pods. According to Mendel’s theory, 1/4 of the offspring peas should have yellow pods. Use a 0.05 significance level to test the claim
Data Set 24 in Appendix B includes a simple random sample of FICO credit rating scores. As of this writing, the mean FICO score was reported to be 678. Use a 0.05 signficance level to test the claim that the sample of FICO scores comes from a population with a mean equal to 678. Data Set 24: FICO
With H1: p ≠ 0.707, the test statistic is z = - 2.75.Use the given information to find the P-value. Also, use a 0.05 significance level and state the conclusion about the null hypothesis (reject the null hypothesis or fail to reject the null hypothesis).
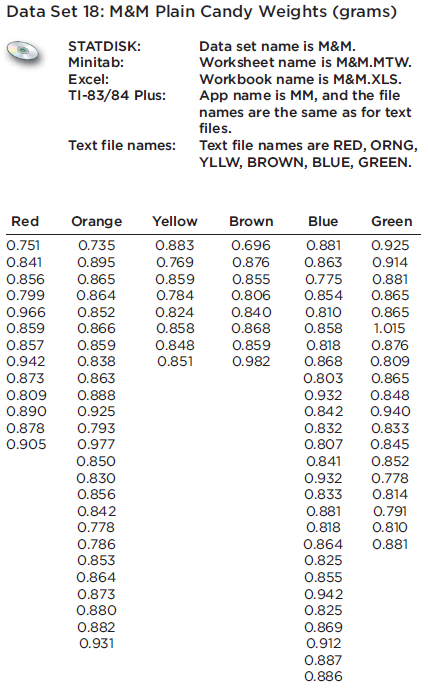
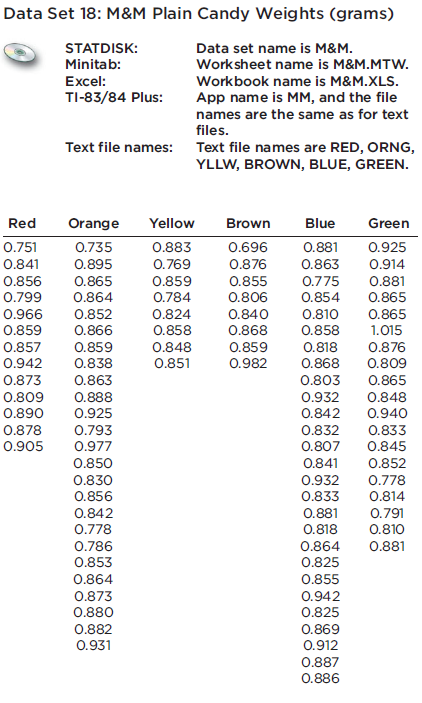
Refer to Data Set 18 in Appendix B and find the sample proportion of M&Ms that are red. Use that result to test the claim of Mars, Inc., that 20% of its plain M&M candies are red. Data Set 18: M&M Plain Candy Weights (grams) STATDISK: Minitab: Excel: Data set name is M&M. Worksheet name is
With H1: p ≠ 3/4, the test statistic is z = 0.35.Use the given information to find the P-value. Also, use a 0.05 significance level and state the conclusion about the null hypothesis (reject the null hypothesis or fail to reject the null hypothesis).
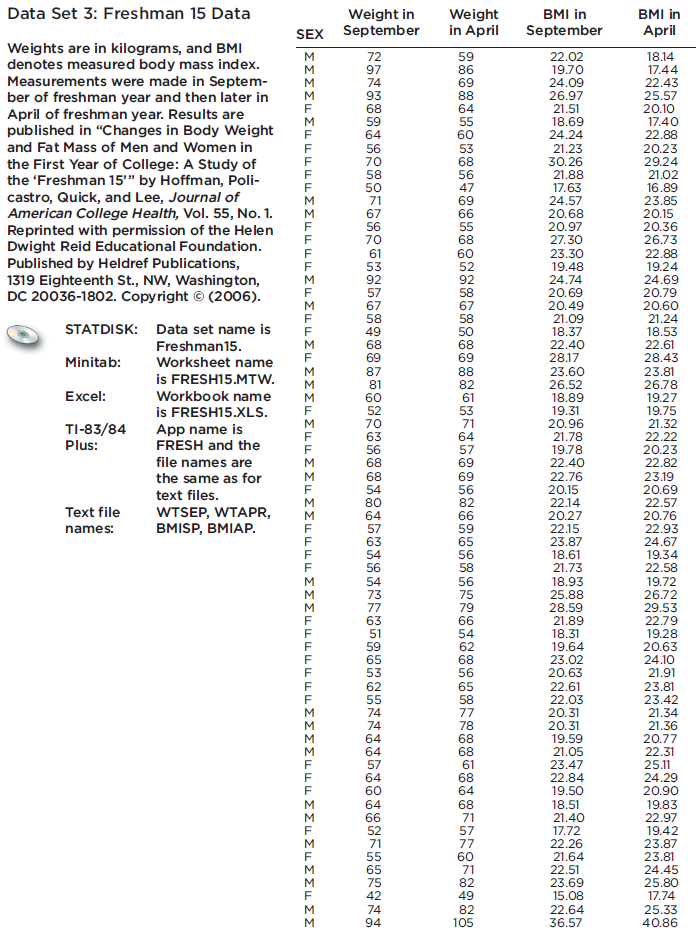
Data Set 3 in Appendix B includes results from a study described in ?Changes in Body Weight and Fat Mass of Men and Women in the First Year of College: A Study of the ?Freshman 15,?? by Hoffman, Policastro, Quick, and Lee, Journal of American College Health, Vol. 55, No. 1. Refer to that data set
When testing a claim about a population mean with a simple random sample selected from a normally distributed population with unknown σ, the Student t distribution should be used for finding critical values and/or a P-value. If the standard normal distribution is incorrectly used instead, does
With H1: p > 1/4, the test statistic is z = 2.30.Use the given information to find the P-value. Also, use a 0.05 significance level and state the conclusion about the null hypothesis (reject the null hypothesis or fail to reject the null hypothesis).
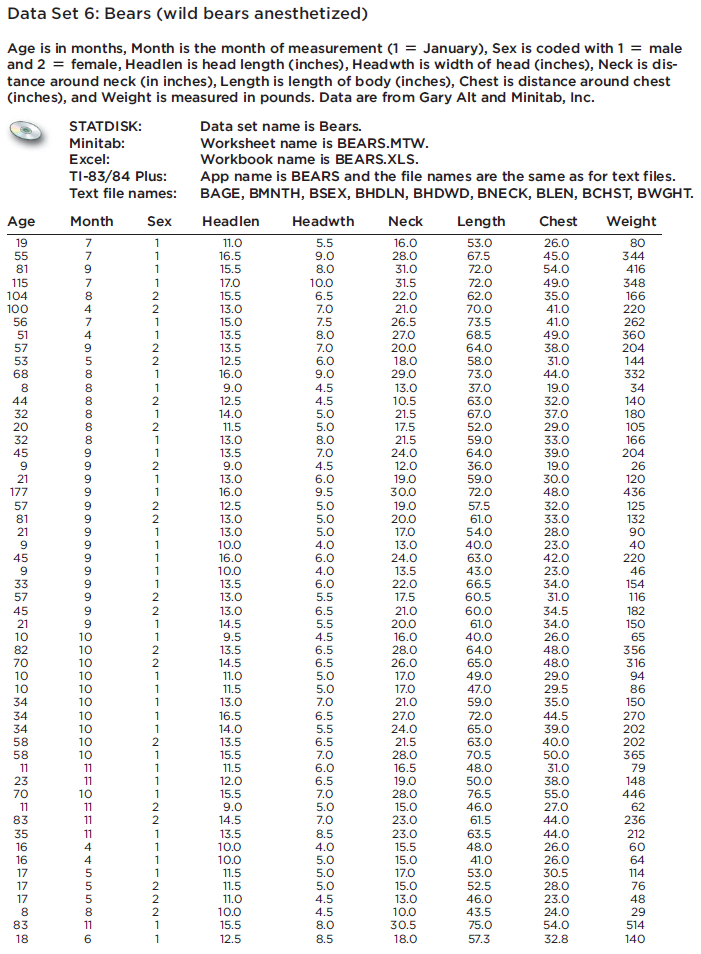
Refer to Data Set 6 in Appendix B and find the proportion of male bears included in the study. Use a 0.05 significance level to test the claim that when the bears were selected, they were selected from a population in which the percentage of males is equal to 50%. Data Set 6: Bears (wild bears
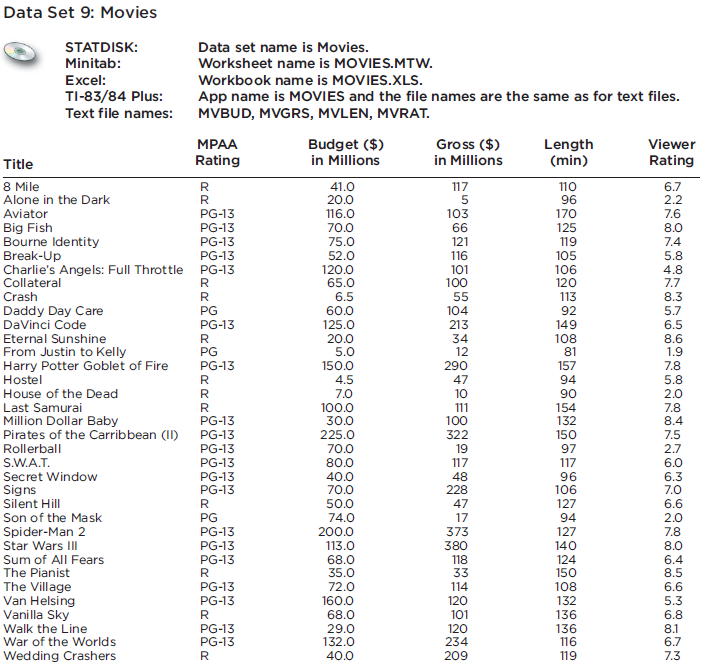
According to the Information Please almanac, the percentage of movies with ratings of R has been 55% during a recent period of 33 years. Refer to Data Set 9 in Appendix B and find the proportion of movies with ratings of R. Use a 0.01 significance level to test the claim that the movies in Data Set
With H1: p < 0.777, the test statistic is z = - 2.95.Use the given information to find the P-value. Also, use a 0.05 significance level and state the conclusion about the null hypothesis (reject the null hypothesis or fail to reject the null hypothesis).
When finding critical values, we sometimes need significance levels other than those available in Table A-3. Some computer programs approximate critical t values by calculating where df = n - 1, e = 2.718, A = z(8 ? df + 3)/(8? df + 1), and z is the critical z score. Use this approximation to
90%; n = 200; σ = 15.0; population appears to be skewed.Assume that we want to construct a confidence interval using the given confidence level. Do one of the following, as appropriate: (a) Find the critical value zα/2, (b) find the critical value tα/2, (c) state that neither the normal nor the
FICO (Fair, Isaac, and Company) credit rating scores of a simple random sample of applicants for credit cards: 95% confidence; n = 50, x = 677, and σ is known to be 68.Find the margin of error and confidence interval if the necessary requirements are satisfied. If the requirements are not all
Find the probability of making random guesses to 12 true false questions and getting 12 correct answers. If someone did get 12 correct answers, is it possible that they made random guesses? Is it likely that they made random guesses?
Listed below are weights (in pounds) of glass discarded in one week by randomly selected households (based on data from the Garbage Project at the University of Arizona).a. What is the best point estimate of the mean weight of glass discarded by households in a week?b. Construct a 95% confidence
Find the critical values and that correspond to the given confidence level X2L and X2R sample size.90%; n = 51
Find zα/2 for α = 0.02.Find the indicated critical z value.
95%; n = 40; σ is unknown; population appears to be skewed.Assume that we want to construct a confidence interval using the given confidence level. Do one of the following, as appropriate: (a) Find the critical value zα/2, (b) find the critical value tα/2, (c) state that neither the normal nor
Find zα/2 for α = 0.04.Find the indicated critical value zα/2.
Use the range rule of thumb to estimate the standard deviation of grade point averages at a college with a grading system designed so that the lowest and highest possible grade point averages are 0 and 4.
You have been hired by a consortium of local car dealers to conduct a survey about the purchases of new and used cars.a. If you want to estimate the percentage of car owners in your state who purchased new cars (not used), how many adults must you survey if you want 95% confidence that your sample
Find the critical values and that correspond to the given confidence level X2L and X2R sample size.99%; n = 81
Find zα/2 for α = 0.10.Find the indicated critical z value.
99%; n = 6; σ is unknown; population appears to be very skewed.Assume that we want to construct a confidence interval using the given confidence level. Do one of the following, as appropriate: (a) Find the critical value zα/2, (b) find the critical value tα/2, (c) state that neither the normal
Find zα/2 for α = 0.20.Find the indicated critical value zα/2.
What is a simple random sample? What is a voluntary response sample?
A Gallup poll consisted of 1012 randomly selected adults who were asked whether “cloning of humans should or should not be allowed.” Results showed that 901 adults surveyed indicated that cloning should not be allowed.a. Find the best point estimate of the proportion of adults believing that
Find the critical values and that correspond to the given confidence level X2L and X2R sample size.95%; n = 20
Find the critical value zα/2 that corresponds to a 99.5% confidence level.Find the indicated critical z value.
99%; n = 25; σ is known; population appears to be normally distributed.Assume that we want to construct a confidence interval using the given confidence level. Do one of the following, as appropriate: (a) Find the critical value zα/2, (b) find the critical value tα/2, (c) state that neither the
Find the critical value zα/2 that corresponds to a 99% confidence level.Find the indicated critical z value.
95%; n = 23; σ is unknown; population appears to be normally distributed.Assume that we want to construct a confidence interval using the given confidence level. Do one of the following, as appropriate: (a) Find the critical value zα/2, (b) find the critical value tα/2, (c) state that neither
Find the critical value zα/2 that corresponds to a 90% confidence level.Find the indicated critical value zα/2.
If a randomly selected job applicant is given a drug test, there is a 0.038 probability that the applicant will test positive for drug use (based on data from Quest Diagnostics).a. If a job applicant is randomly selected and given a drug test, what is the probability that the applicant does not
The National Transportation Safety Administration conducted crash test experiments on five subcompact cars. The head injury data (in hic) recorded from crash test dummies in the driver’s seat are as follows: 681, 428, 917, 898, 420. Use these sample results to construct a 95% confidence interval
Construct a 95% confidence interval for the population mean. Use the following weights (in pounds) of randomly selected supermodels. 125 (Taylor) 127 (Hall) 119 (Auermann) 105 (Moss) 128 (Schiffer) 123 (Mazza) 125 (Bundchen) 110 (Reilly) 119 (Turlington) 103 (Barton)
For the poll described in Exercise 1, describe what is meant by the statement that “the margin of error is ± 1 percentage point.”Exercise 1USA Today provided a “snapshot” illustrating poll results from 21,944 subjects. The illustration showed that 43% answered “yes” to this question:
Using the weights of the M&M candies listed in Data Set 18 from Appendix B, we use the standard deviation of the sample to obtain the following 95% confidence interval estimate of the standard deviation of the weights of all M&Ms: 0.0455 g Data Set 18: M&M Plain Candy Weights (grams)
In general, what is a point estimate of a population parameter? Given a simple random sample of heights from some population, such as the population of all basketball players in the NBA, how would you find the best point estimate of the population mean?
Three randomly selected households are surveyed as a pilot project for a larger survey to be conducted later. The numbers of people in the households are 2, 3, and 10 (based on Data Set 22 in Appendix B). Consider the values of 2, 3, and 10 to be a population. Assume that samples of size n = 2 are
The Newport Varsity Club has 210 members. The weights of members have a distribution that is approximately normal with a mean of 163 lb and a standard deviation of 32 lb. The design for a new club building includes an elevator with a capacity limited to 12 passengers.a. When considering the
In a study of Reye’s syndrome, 160 children had a mean age of 8.5 years, a standard deviation of 3.96 years, and ages that approximated a normal distribution (based on data from Holtzhauer and others, American Journal of Diseases of Children, Vol. 140). Assume that 36 of those children are to be
The Boeing 757-200 ER airliner carries 200 passengers and has doors with a height of 72 in. Heights of men are normally distributed with a mean of 69.0 in. and a standard deviation of 2.8 in.a. What doorway height would allow 95% of men to enter the aircraft without bending?b. Assume that half of
The starting five players for the Boston Celtics basketball team have agreed to make charity appearances tomorrow night. If you must send three players to a United Way event and the other two to a Heart Fund event, how many different ways can you make the assignments?
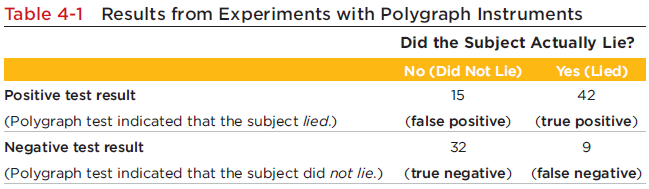
Refer to the sample data in Table 4-1. If one of the responses is randomly selected, what is the probability that it is a false positive? (Express the answer as a decimal.) What does this probability suggest about the accuracy of the polygraph test? Table 4-1 Results from Experiments with
Showing 300 - 400
of 2934
1
2
3
4
5
6
7
8
9
10
11
12
13
14
15
Last
Step by Step Answers