New Semester
Started
Get
50% OFF
Study Help!
--h --m --s
Claim Now
Question Answers
Textbooks
Find textbooks, questions and answers
Oops, something went wrong!
Change your search query and then try again
S
Books
FREE
Study Help
Expert Questions
Accounting
General Management
Mathematics
Finance
Organizational Behaviour
Law
Physics
Operating System
Management Leadership
Sociology
Programming
Marketing
Database
Computer Network
Economics
Textbooks Solutions
Accounting
Managerial Accounting
Management Leadership
Cost Accounting
Statistics
Business Law
Corporate Finance
Finance
Economics
Auditing
Tutors
Online Tutors
Find a Tutor
Hire a Tutor
Become a Tutor
AI Tutor
AI Study Planner
NEW
Sell Books
Search
Search
Sign In
Register
study help
mathematics
elementary statistics picturing
Elementary Statistics 11th Edition Mario F. Triola - Solutions
Listed below are the top 10 salaries (in millions of dollars) of television personalities in a recent year (listed in order for Letterman, Cowell, Sheindlin, Leno, Couric, Lauer, Sawyer, Viera, Sutherland, and Sheen, based on data from OK! magazine).a. Use the sample data to construct the 95%
Margin of error: two percentage points; confidence level: 99%; from a prior study, p is estimated by the decimal equivalent of 14%.Use the given data to find the minimum sample size required to estimate a population proportion or percentage.
Polling organizations typically generate the last digits of telephone numbers so that people with unlisted numbers are included. Listed below are digits randomly generated by STATDISK. Such generated digits are from a population with a standard deviation of 2.87.a. Use the methods of this section
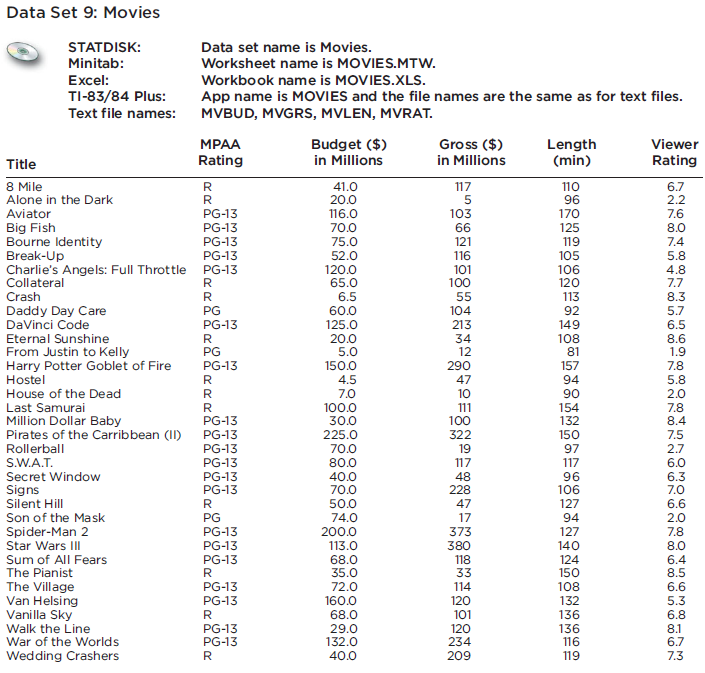
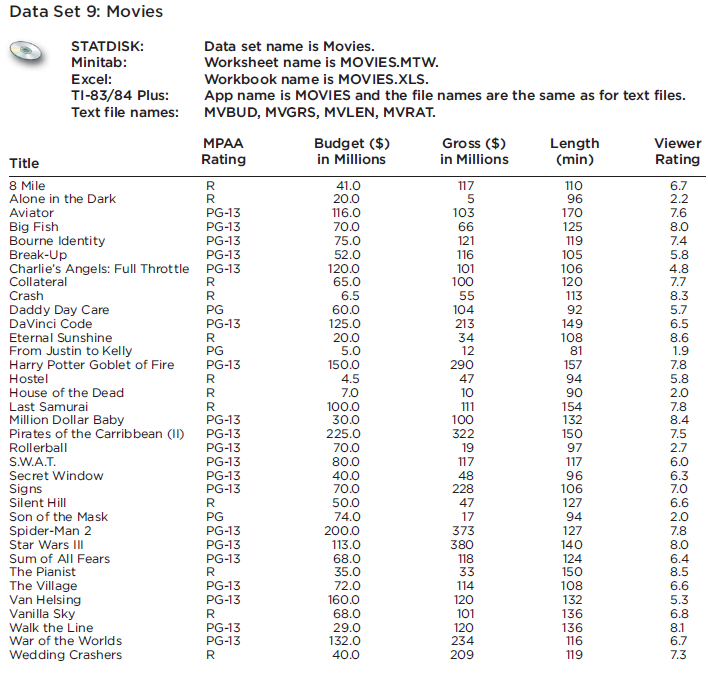
Listed below are 12 lengths (in minutes) of randomly selected movies from Data Set 9 in Appendix B.a. Construct a 99% confidence interval estimate of the mean length of all movies.b. Assuming that it takes 30 min to empty a theater after a movie, clean it, allow time for the next audience to enter,
Twelve different video games showing substance use were observed and the duration times of game play (in seconds) are listed below (based on data from “Content and Ratings of Teen-Rated Video Games,” by Haninger and Thompson, Journal of the American Medical Association, Vol. 291, No. 7). The
Margin of error: three percentage points; confidence level: 95%; from a prior study, p is estimated by the decimal equivalent of 87%.Use the given data to find the minimum sample size required to estimate a population proportion or percentage.
The Genetics and IVF Institute conducted a clinical trial of the XSORT method designed to increase the probability of conceiving a girl. As of this writing, 574 babies were born to parents using the XSORT method, and 525 of them were girls.a. What is the best point estimate of the population
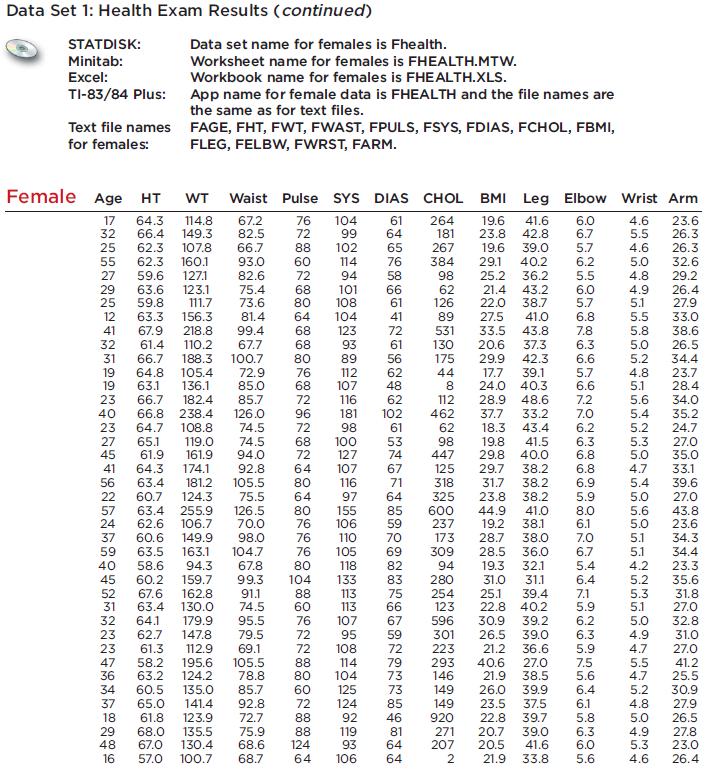
Refer to Data Set 9 from Appendix B and construct a 95% confidence interval estimate of the mean gross amount for the population of all movies. Assume that the population standard deviation is known to be 100 million dollars. Data Set 9: Movies STATDISK: Minitab: Excel: TI-83/84 Plus: Text file
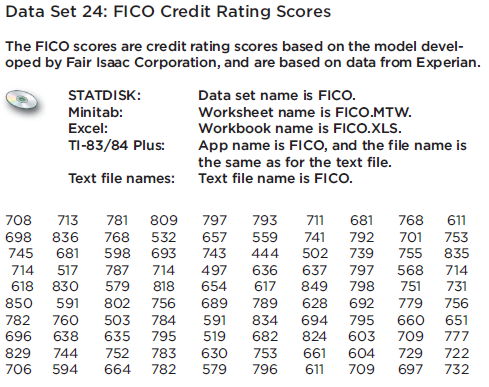
Refer to Data Set 24 in Appendix B and construct the 99% confidence interval estimate of the mean FICO score for the population. Assume that the population standard deviation is 92.2. Data Set 24: FICO Credit Rating Scores The FICO scores are credit rating scores based on the model devel- oped by
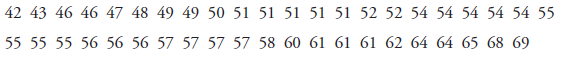
Listed below are the ages of the Presidents of the United States at the times of their inaugurations. Construct a 99% confidence interval estimate of the mean age of presidents at the times of their inaugurations. What is the population? Does the confidence interval provide a good estimate of the
An interesting and popular hypothesis is that individuals can temporarily postpone their death to survive a major holiday or important event such as a birthday. In a study of this phenomenon, it was found that in the week before and the week after Thanksgiving, there were 12,000 total deaths, and
What sample size is needed to estimate the mean white blood cell count (in cells per microliter) for the population of adults in the United States? Assume that you want 99% confidence that the sample mean is within 0.2 of the population mean. The population standard deviation is 2.5.
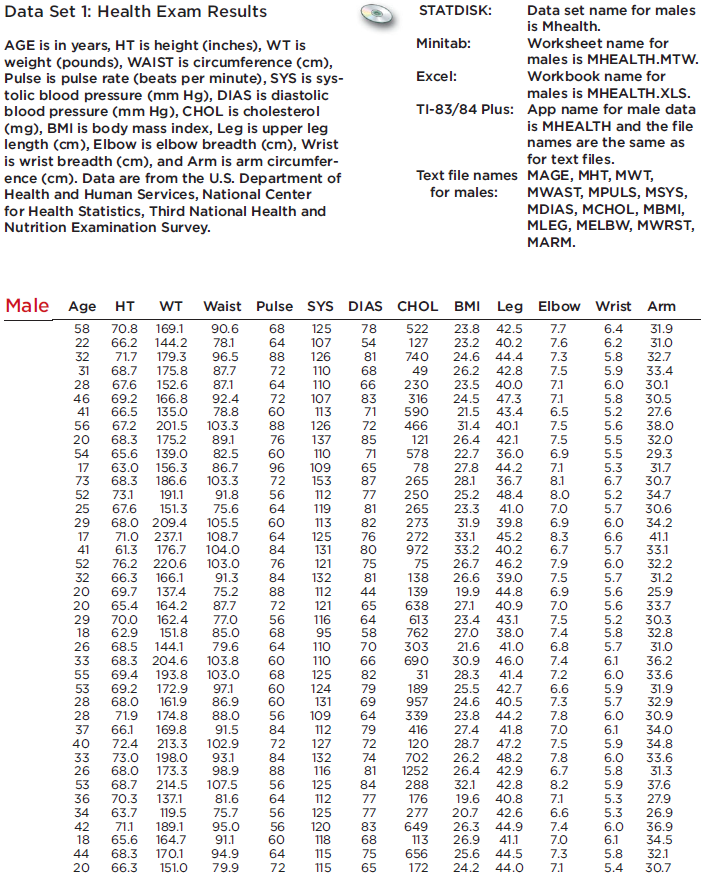
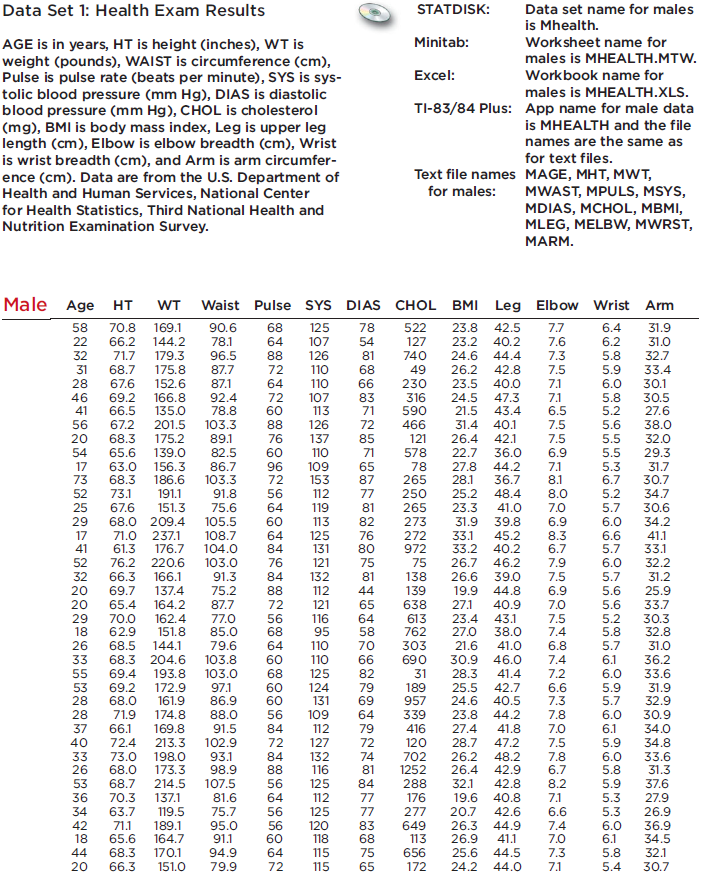
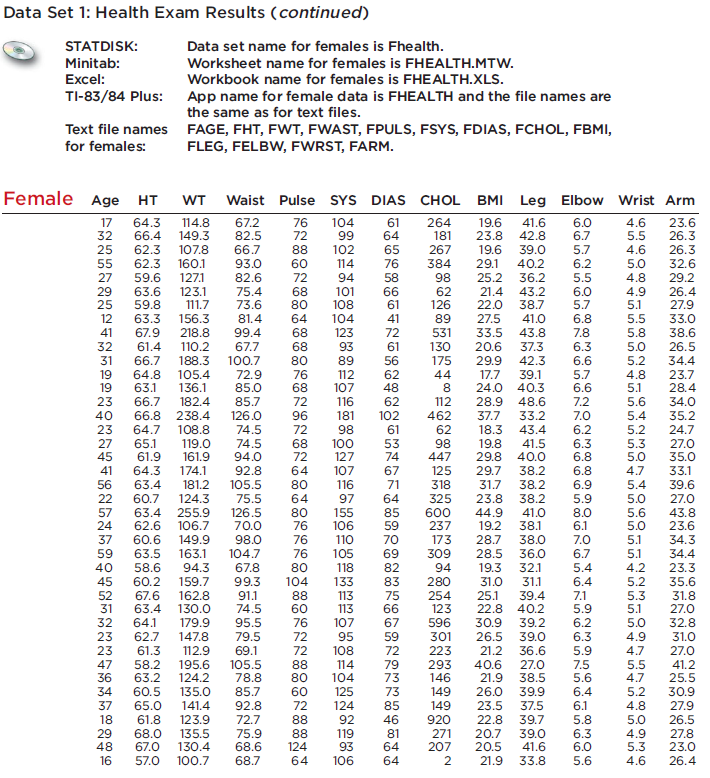
A physician wants to develop criteria for determining whether a patient?s pulse rate is atypical, and she wants to determine whether there are significant differences between males and females. Use the sample pulse rates in Data Set 1 from Appendix B. a. Construct a 95% confidence interval estimate
An important issue facing Americans is the large number of medical malpractice lawsuits and the expenses that they generate. In a study of 1228 randomly selected medical malpractice lawsuits, it is found that 856 of them were later dropped or dismissed (based on data from the Physician Insurers
You want to estimate the mean weight loss of people one year after using the Atkins weight loss program. How many people on that program must be surveyed if we want to be 95% confident that the sample mean weight loss is within 0.25 lb of the true population mean? Assume that the population
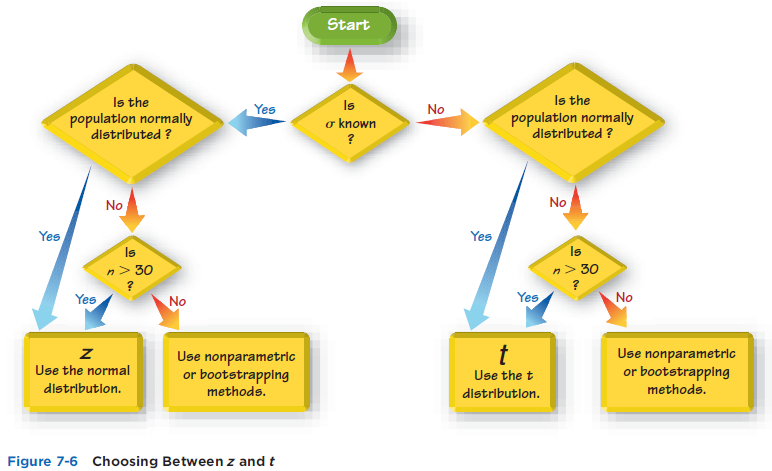
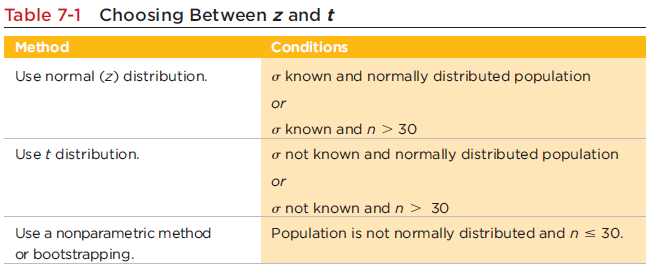
Figure 7-6 and Table 7-1 summarize the decisions made when choosing between the normal and t distributions. An alternative method included in some textbooks (but almost never used by professional statisticians and almost never included in professional journals) is based on this criterion:
In a survey of 1002 people, 701 said that they voted in a recent presidential election (based on data from ICR Research Group). Voting records show that 61% of eligible voters actually did vote.a. Find a 99% confidence interval estimate of the proportion of people who say that they voted.b. Are the
You want to estimate the mean amount of annual tuition being paid by current full-time college students in the United States. First use the range rule of thumb to make a rough estimate of the standard deviation of the amounts spent. It is reasonable to assume that tuition amounts range from $0 to
A study of 420,095 Danish cell phone users found that 135 of them developed cancer of the brain or nervous system. Prior to this study of cell phone use, the rate of such cancer was found to be 0.0340% for those not using cell phones. The data are from the Journal of the National Cancer
In a Pew Research Center poll, 73% of 3011 adults surveyed said that they use the Internet. Construct a 95% confidence interval estimate of the proportion of all adults who use the Internet. Is it correct for a newspaper reporter to write that “3 4 of all adults use the Internet”? Why or why
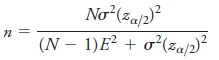
The methods of this section assume that sampling is from a population that is very large or infinite, and that we are sampling with replacement. If we have a relatively small population and sample without replacement, we should modify E to include a finite population correction factor, so that the
In an Accountemps survey of 150 senior executives, 47% said that the most common job interview mistake is to have little or no knowledge of the company. Construct a 99% confidence interval estimate of the proportion of all senior executives who have that same opinion. Is it possible that exactly
After 276 passengers on the Queen Elizabeth II cruise ship contracted a norovirus, America Online presented this question on its Internet site: “Would the recent outbreak deter you from taking a cruise?” Among the 34,358 people who responded, 62% answered “yes.” Use the sample data to
As the newly hired manager of a company that provides cell phone service, you want to determine the percentage of adults in your state who live in a household with cell phones and no land-line phones. How many adults must you survey? Assume that you want to be 90% confident that the sample
The use of the Internet is constantly growing. How many randomly selected adults must be surveyed to estimate the percentage of adults in the United States who now use the Internet? Assume that we want to be 99% confident that the sample percentage is within two percentage points of the true
A campaign was designed to convince car owners that they should fill their tires with nitrogen instead of air. At a cost of about $5 per tire, nitrogen supposedly has the advantage of leaking at a much slower rate than air, so that the ideal tire pressure can be maintained more consistently. Before
As this book was being written, former New York City mayor Rudolph Giuliani announced that he was a candidate for the presidency of the United States. If you are a campaign worker and need to determine the percentage of people that recognize his name, how many people must you survey to estimate
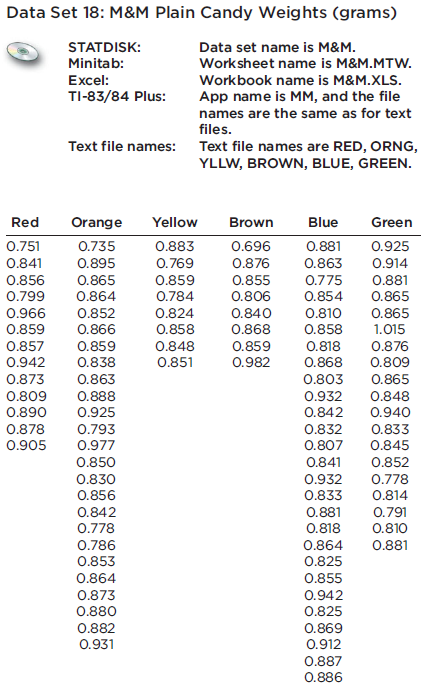
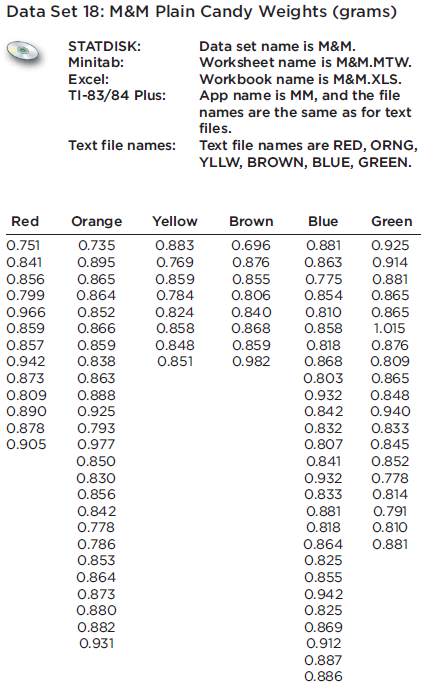
Refer to Data Set 18 in Appendix B and find the sample proportion of M&Ms that are green. Use that result to construct a 95% confidence interval estimate of the population percentage of M&Ms that are green. Is the result consistent with the 16% rate that is reported by the candy maker Mars?
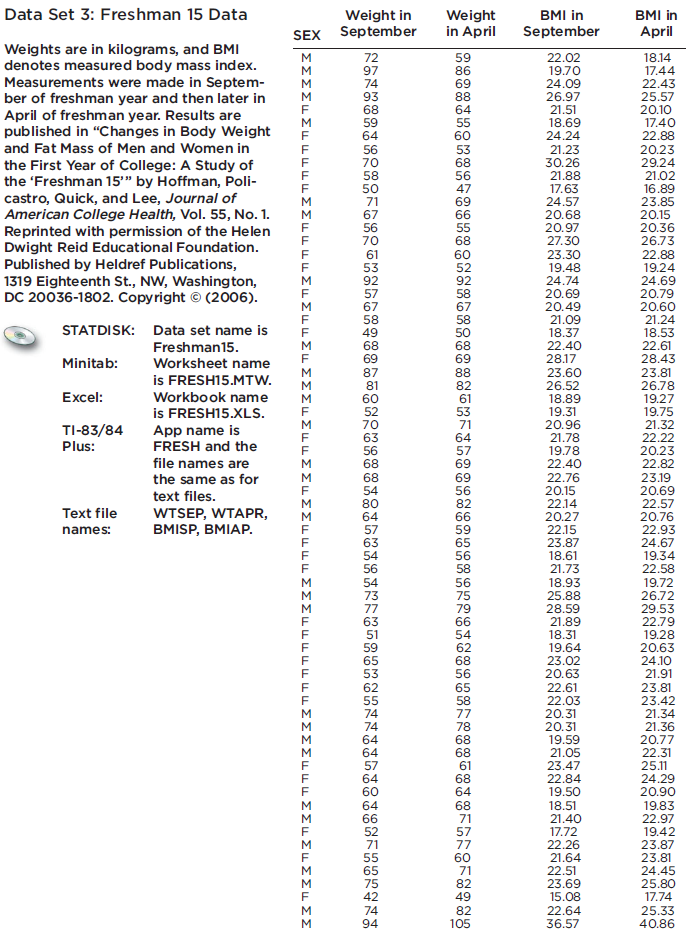
Refer to Data Set 3 in Appendix B. a. Based on the sample results, find the best point estimate of the percentage of college students who gain weight in their freshman year. b. Construct a 95% confidence interval estimate of the percentage of college students who gain weight in their freshman
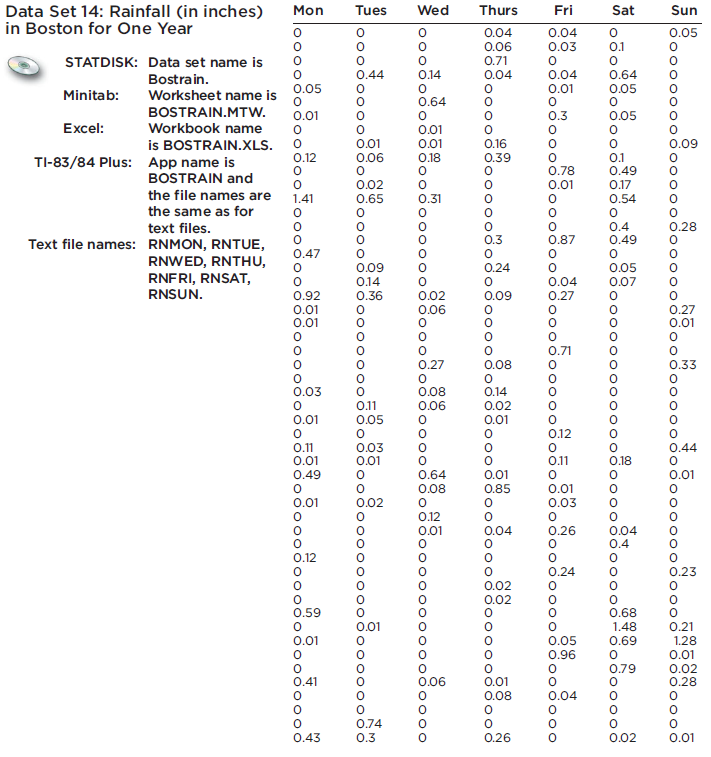
Refer to Data Set 14 in Appendix B, and consider days with precipitation values different from 0 to be days with precipitation. Construct a 95% confidence interval estimate of the proportion of Wednesdays with precipitation, and also construct a 95% confidence interval estimate of the proportion of
Refer to Data Set 9 in Appendix B and find the proportion of movies with R ratings. Use that proportion to construct a 95% confidence interval estimate of the proportion of all movies with R ratings. Assuming that the listed movies constitute a simple random sample of all movies, can we conclude
Assume that a coin is modified so that it favors heads, and 100 tosses result in 95 heads. Find the 99% confidence interval estimate of the proportion of heads that will occur with this coin. What is unusual about the results obtained by the methods of this section? Does common sense suggest a
Suppose n trials of a binomial experiment result in no successes. According to the Rule of Three, we have 95% confidence that the true population proportion has an upper bound of 3/n. (See “A Look at the Rule of Three,” by Jovanovic and Levy, American Statistician, Vol. 51, No. 2.)a. If n
A New York Times article about poll results states, “In theory, in 19 cases out of 20, the results from such a poll should differ by no more than one percentage point in either direction from what would have been obtained by interviewing all voters in the United States.” Find the sample size
Using 52 rainfall amounts for Sundays in Boston, a test of the claim that μ > 0 in. results in a P-value of 0.0091. What does the P-value suggest about the claim? In general, what does the following memory aid suggest about the interpretation of P-values: “If the P is low, the null must go.
A simple random sample of 1088 adults between the ages of 18 and 44 is conducted. It is found that 261 of the 1088 adults smoke (based on data from the National Health Interview Survey). Use a 0.05 significance level to test the claim that less than 1/4 of such adults smoke.
Listed below are the winning times (in seconds) of women in the 100-meter dash for consecutive summer Olympic games, listed in order by year. Assume that the times are sample data from a larger population. Find the values of the indicated statistics.11.07 11.08 11.06 10.97
In reporting on an Elle MSNBC.COM survey of 61,647 people, Elle magazine stated that “just 20% of bosses are good communicators.” Without performing formal calculations, do the sample results appear to support the claim that less than 50% of people believe that bosses are good communicators?
In a Harris poll, adults were asked if they are in favor of abolishing the penny. Among the responses, 1261 answered “no,” 491 answered “yes,” and 384 had no opinion. What is the sample proportion of yes responses, and what notation is used to represent it?
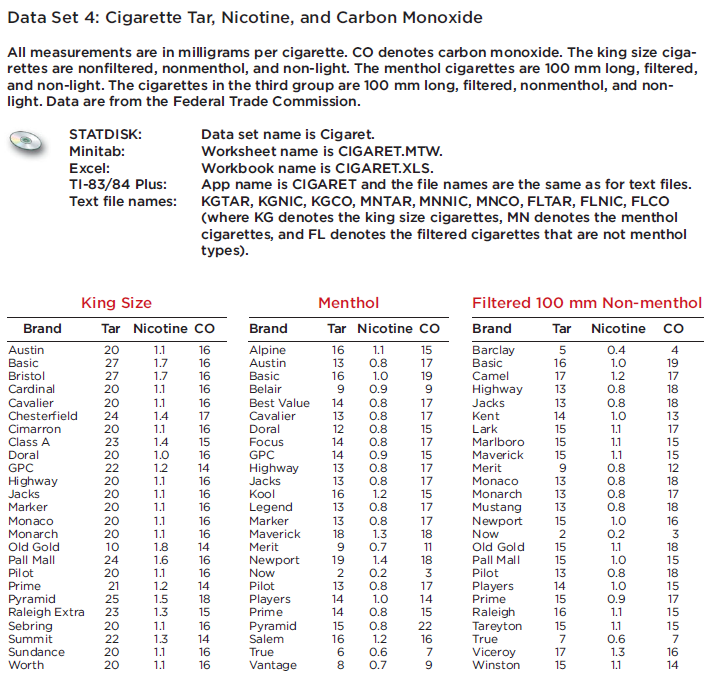
Data Set 4 in Appendix B lists the amounts of nicotine (in milligrams per cigarette) in 25 different king size cigarettes. If we want to use that sample to test the claim that all king size cigarettes have a mean of 1.5 mg of nicotine, identify the requirements that must be satisfied. Data Set 4:
Given a simple random sample of 20 speeds of cars on Highway 405 in California, you want to test the claim that the sample values are from a population with a mean greater than the posted speed limit of 65 mi h. Is it necessary to determine whether the sample is from a normally distributed
Hypothesis tests of claims about the population mean or population standard deviation both require a simple random sample from a normally distributed population. How does the normality requirement for a hypothesis test of a claim about a standard deviation differ from the normality requirement for
A very large simple random sample consists of the differences between the heights of the first-born male child and the second-born male child. With n = 295,362 x = 0.019 in., and s = 3.91 in., a test of the claim that μ > 0 in. results in a P-value of 0.0041. Is there statistical significance?
A simple random sample is conducted of 1486 college students who are seeking bachelor’s degrees, and it includes 802 who earned bachelor’s degrees within five years. Use a 0.01 significance level to test the claim that most college students earn bachelor’s degrees within five years.
Exercise 1 lists the winning times (in seconds) of women in the 100-meter dash for consecutive summer Olympic games.a. What is the level of measurement of the data? (nominal, ordinal, interval, ratio)b. Are the values discrete or continuous?c. Do the values constitute a simple random sample?d. What
America Online conducted a survey in which Internet users were asked to respond to this question: Do you want to live to be 100?” Among 5266 responses, 3042 were responses of “yes.” Is it valid to use these sample results for testing the claim that the majority of the general population wants
Because the amounts of nicotine in king size cigarettes listed in Data Set 4 in Appendix B constitute a sample of size n = 25, we must satisfy the requirement that the population is normally distributed. How do we verify that a population is normally distributed? Data Set 4: Cigarette Tar,
In statistics, what does df denote? If a simple random sample of 20 speeds of cars on California Highway 405 is to be used to test the claim that the sample values are from a population with a mean greater than the posted speed limit of 65 mi/h, what is the specific value of df?
There is a claim that the lengths of men’s hands have a standard deviation less than 200 mm. You plan to test that claim with a 0.01 significance level by constructing a confidence interval. What level of confidence should be used for the confidence interval? Will the conclusion based on the
Some magazines and newspapers conduct polls in which the sample results are a voluntary response sample. What is a voluntary response sample? In general, can such a voluntary response sample be used with a hypothesis test to make a valid conclusion about the larger population?
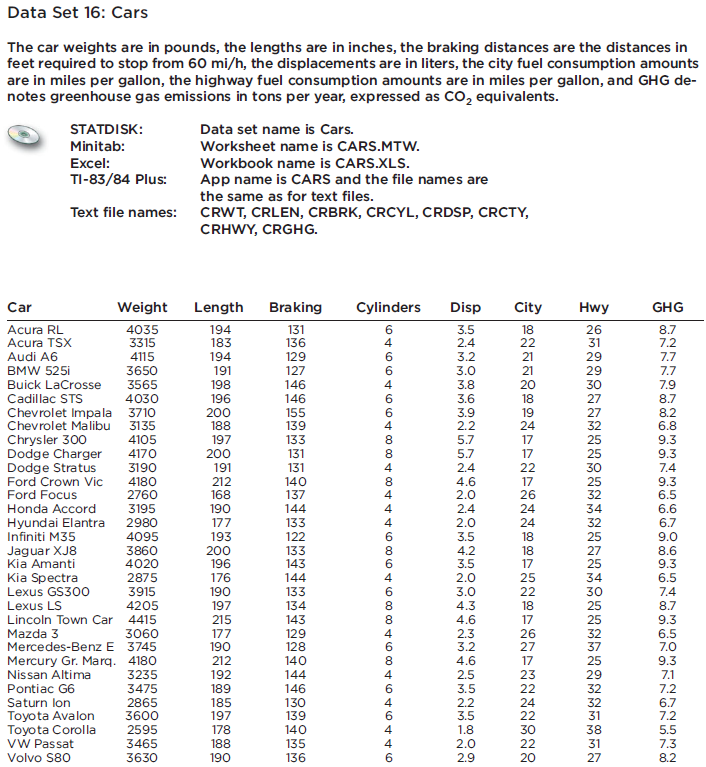
When planning for construction of a parkway, engineers must consider the weights of cars to be sure that the road surface is strong enough. A simple random sample of 32 cars yields a mean of 3605.3 lb and a standard deviation of 501.7 lb (based on Data Set 16 in Appendix B). Use a 0.01 significance
Bottles of Bayer aspirin are labeled with a statement that the tablets each contain 325 mg of aspirin. A quality control manager claims that a large sample of data can be used to support the claim that the mean amount of aspirin in the tablets is equal to 325 mg, as the label indicates. Can a
In 280 trials with professional touch therapists, correct responses to a question were obtained 123 times. The P-value of 0.979 is obtained when testing the claim that p > 0.5 (the proportion of correct responses is greater than the proportion of 0.5 that would be expected with random chance).
If you want to construct a confidence interval to be used for testing the claim that college students have a mean IQ score that is greater than 100, and you want the test conducted with a 0.01 significance level, what confidence level should be used for the confidence interval?
What is a t test? Why is the letter t used?
There is a claim that daily rainfall amounts in Boston have a standard deviation equal to 0.25 in. Sample data show that daily rainfall amounts are from a population with a distribution that is very far from normal. Can the use of a very large sample compensate for the lack of normality, so that
What does it mean when we say that a particular method of hypothesis testing is robust against departures from normality? Is the t test of a population mean robust against departures from normality? Is the X2 test of a population standard deviation robust against departures from normality?
Repeat Exercise 3 by assuming that weights of cars have a standard deviation known to be 520 lb. Repeat Exercise 3 When planning for construction of a parkway, engineers must consider the weights of cars to be sure that the road surface is strong enough. A simple random sample of 32 cars yields a
Use the sample values given in Exercise 1 to test the claim that the mean winning time is less than 11 sec. Use a 0.05 significance level. What can we conclude about winning times in the future?11.07 11.08 11.06 10.97 10.54 10.82 10.94 10.75
In preliminary results from couples using the Gender Choice method of gender selection to increase the likelihood of having a baby girl, 20 couples used the Gender Choice method with the result that 8 of them had baby girls and 12 had baby boys. Given that the sample proportion of girls is 8 20 or
A hypothesis test that the Zone diet is effective (when used for one year) results in this conclusion: There is sufficient evidence to support the claim that the mean weight change is less than 0 (so there is a loss of weight). The sample of 40 subjects had a mean weight loss of 2.1 lb (based on
Unlike the preceding section, this section does not include a requirement that the value of the population standard deviation must be known. Which section is more likely to apply in realistic situations: this section or the preceding section? Why?
There is a claim that men have foot breadths with a variance equal to 36 mm2. Is a hypothesis test of the claim that the variance is equal to 36 mm2 equivalent to a test of the claim that the standard deviation is equal to 6 mm?
Among 30,617 randomly selected adults, 5787 consumed herbs within the past 12 months (based on data from “Use of Herbs Among Adults Based on Evidence-Based Indications: Findings From the National Health Survey,” by Bardia, et al., Mayo Clinic Proceedings, Vol. 82, No. 5). Use a 0.01
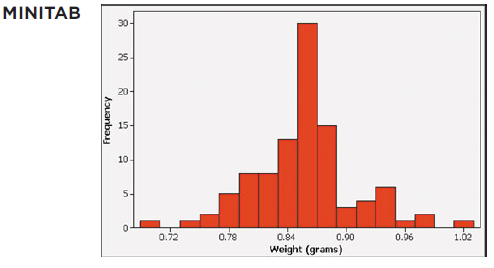
Minitab is used to construct a histogram of the weights of a simple random sample of M&M candies, and the result is shown on the next page. a. Does the sample appear to be from a population with a normal distribution? b. How many sample values are represented in the histogram? c. What is the
Claim: A coin favors heads when tossed, and there are 90 heads in 100 tosses.Make a decision about the given claim. Use only the rare event rule stated in Section 8-2, and make subjective estimates to determine whether events are likely. For example, if the claim is that a coin favors heads and
A recent study showed that 53% of college applications were submitted online (based on data from the National Association of College Admissions Counseling). Assume that this result is based on a simple random sample of 1000 college applications, with 530 submitted online. Use a 0.01 significance
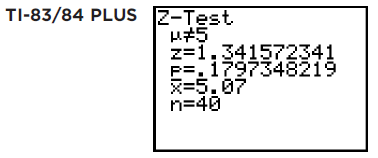
A jewelry designer claims that women have wrist breadths with a mean equal to 5 cm. A simple random sample of the wrist breadths of 40 women has a mean of 5.07 cm (based on Data Set 1 in Appendix B). Assume that the population standard deviation is 0.33 cm. Use the accompanying TI-83 84 Plus
Claim about IQ scores of statistics instructors: μ > 100. Sample data: n = 15, x = 118, s = 11. The sample data appear to come from a normally distributed population with unknown μ and σ.Determine whether the hypothesis test involves a sampling distribution of means that is a normal
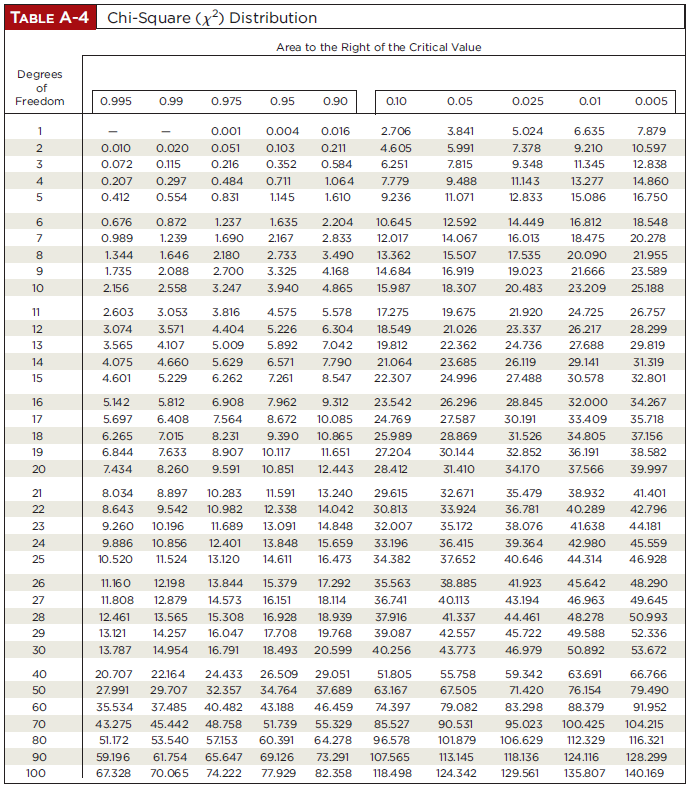
Find the test statistic and critical value(s). Also, use Table A-4 to find limits containing the P-value, then determine whether there is sufficient evidence to support the given alternative hypothesis. H1: ? ? 696 g, ? = 0.05, n = 25, s = 645 g. TABLE A-4 Chi-Square (x²) Distribution Degrees of
An axial load of an aluminum can is the maximum weight that the sides can support before collapsing. The axial load is an important measure, because the top lids are pressed onto the sides with pressures that vary between 158 lb and 165 lb. Pepsi experimented with thinner aluminum cans, and a
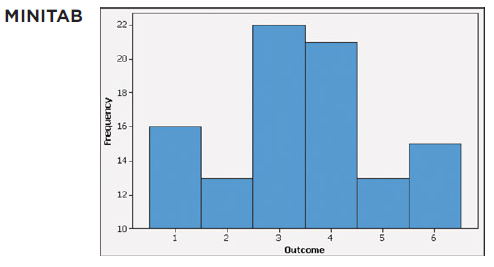
Minitab is used to generate a histogram of the outcomes from 100 rolls of a die. What is wrong with the graph? MINITAB Frequency 22- 18- 16- L 14- 20- 12- 10 T N to Outcome -5 л- 9_
Claim: The proportion of households with telephones is greater than the proportion of 0.35 found in the year 1920. A recent simple random sample of 2480 households results in a proportion of 0.955 households with telephones (based on data from the U.S. Census Bureau).Make a decision about the given
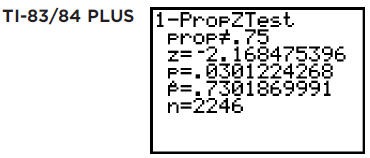
In a survey, 1864 out of 2246 randomly selected adults in the United States said that texting while driving should be illegal (based on data from Zogby International). Consider a hypothesis test that uses a 0.05 significance level to test the claim that more than 80% of adults believe that texting
The TI-83/84 Plus calculator can be used to generate random data from a normally distributed population. The command randNorm(74, 12.5, 100) generates 100 values from a normally distributed population with μ = 74 and σ = 12.5 (for pulse rates of women). One such generated sample of 100 values has
Refer to the histogram provided for Exercise 6 and construct the frequency distribution that summarizes the outcomes. Then find the mean of the 100 outcomes.
Claim: The mean pulse rate (in beats per minute) of students of the author is less than 75. A simple random sample of students has a mean pulse rate of 74.4.Make a decision about the given claim. Use only the rare event rule stated in Section 8-2, and make subjective estimates to determine whether
In a survey, 1640 out of 2246 randomly selected adults in the United States said that they use cell phones while driving (based on data from Zogby International). When testing the claim that the proportion of adults who use cell phones while driving is equal to 75%, the TI-83 84 Plus calculator
In the manual “How to Have a Number One the Easy Way,” by KLF Publications, it is stated that a song “must be no longer than three minutes and thirty seconds” (or 210 seconds). A simple random sample of 40 current hit songs results in a mean length of 252.5 sec. (The songs are by
Claim about daily rainfall amounts in Boston: μ < 0.20 in. Sample data: n = 19. x = 0.10 in, s = 0.26. The sample data appear to come from a population with a distribution that is very far from normal, and σ is unknown.Determine whether the hypothesis test involves a sampling distribution of
Find the test statistic and critical value(s). Also, use Table A-4 to find limits containing the P-value, then determine whether there is sufficient evidence to support the given alternative hypothesis. H1: ? > 3.5 minutes, ? = 0.01, n = 15, s = 4.5 minutes. TABLE A-4 Chi-Square (x²)
Repeat Exercise 7 without making the assumption that the population standard deviation is known.Repeat Exercise 7The TI-83/84 Plus calculator can be used to generate random data from a normally distributed population. The command randNorm(74, 12.5, 100) generates 100 values from a normally
A hypothesis test is conducted with a 0.05 significance level, so that there is a 0.05 probability of making the mistake of rejecting a true null hypothesis. If two different independent hypothesis tests are conducted with a 0.05 significance level, what is the probability that both conclusions are
Claim: Movie patrons have IQ scores with a standard deviation that is less than the standard deviation of 15 for the general population. A simple random sample of 40 movie patrons results in IQ scores with a standard deviation of 14.8.Make a decision about the given claim. Use only the rare event
A survey of 750 people aged 14 or older showed that 35 of them were arrested within the last year (based on FBI data). Minitab was used to test the claim that fewer than 5% of people aged 14 or older were arrested within the last year. Use the results from the Minitab display and use a 0.01
Claim about daily rainfall amounts in Boston: μ < 0.20 in. Sample data: n = 52, x = 0.10 in, s = 0.26 in. The sample data appear to come from a population with a distribution that is very far from normal, and σ is known.Determine whether the hypothesis test involves a sampling distribution of
Find the test statistic and critical value(s). Also, use Table A-4 to find limits containing the P-value, then determine whether there is sufficient evidence to support the given alternative hypothesis. H1: ? ? 0.25, ? = 0.01, n = 26, s = 0.18. TABLE A-4 Chi-Square (x²) Distribution Degrees of
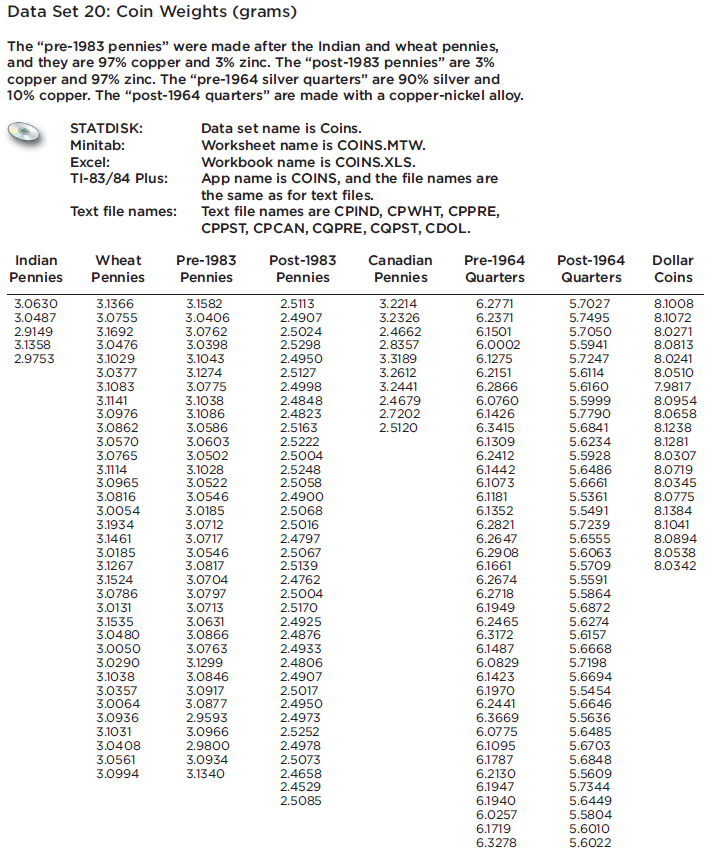
The examples in this section involved the claim that post-1983 pennies have weights with a standard deviation less than 0.0230 g. Data Set 20 in Appendix B includes the weights of a simple random sample of pre-1983 pennies, and that sample has a standard deviation of 0.03910 g. Use a 0.05
Use the sample results from Exercise 7 to test the claim that the generated values are from a population with a standard deviation equal to 12.5. Use a 0.05 significance level.Exercise 7The TI-83/84 Plus calculator can be used to generate random data from a normally distributed population. The
When designing a movie theater with stadium seating, engineers decide to consider the sitting eye heights of women. Those heights have a mean of 739 mm and a standard deviation of 33 mm and they are normally distributed (based on anthropometric survey data from Gordon, Churchill, Clauser).a. For a
The mean annual income of employees who took a statistics course is greater than $60,000.Examine the given statement, then express the null hypothesis H0 and alternative hypothesis H1 in symbolic form. Be sure to use the correct symbol (μ, p, σ) for the indicated parameter.
In a Pew Research Center poll of 745 randomly selected adults, 589 said that it is morally wrong to not report all income on tax returns. Use a 0.01 significance level to test the claim that 75% of adults say that it is morally wrong to not report all income on tax returns.
A simple random sample of the weights of 19 green M&Ms has a mean of 0.8635 g (as in Data Set 18 in Appendix B). Assume that ? is known to be 0.0565 g. Use a 0.05 significance level to test the claim that the mean weight of all green M&Ms is equal to 0.8535 g, which is the mean weight
The proportion of people aged 18 to 25 who currently use illicit drugs is equal to 0.20 (or 20%).Examine the given statement, then express the null hypothesis H0 and alternative hypothesis H1 in symbolic form. Be sure to use the correct symbol (μ, p, σ) for the indicated parameter.
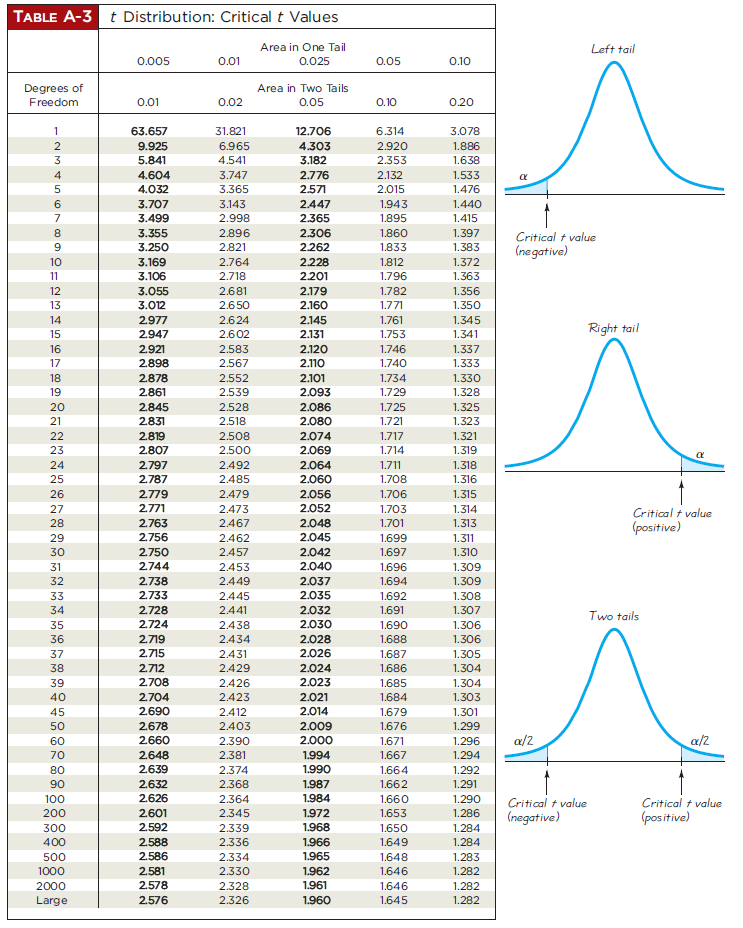
Two-tailed test with n = 15 and test statistic t = 1.495. Either use technology to find the P-value or use Table A-3 to find a range of values for the P-value. TABLE A-3 t Distribution: Critical t Values Area in One Tail 0.025 Degrees of Freedom 888885 www860 VOGAWN- 17 19 20 21 22 23 24 25 26 27
The standard deviation of human body temperatures is equal to 0.62°F.Examine the given statement, then express the null hypothesis H0 and alternative hypothesis H1 in symbolic form. Be sure to use the correct symbol (μ, p, σ) for the indicated parameter.
The Hawk-Eye electronic system is used in tennis for displaying an instant replay that shows whether a ball is in bounds or out of bounds. In the first U.S. Open that used the Hawk-Eye system, players could challenge calls made by referees. The Hawk-Eye system was then used to confirm or overturn
Two-tailed test with n = 9 and test statistic t = - 1.905. Either use technology to find the P-value or use Table A-3 to find a range of values for the P-value. TABLE A-3 t Distribution: Critical t Values Area in One Tail 0.025 Degrees of Freedom 888885 www860 VOGAWN- 17 19 20 21 22 23 24 25 26 27
When 40 people used the Weight Watchers diet for one year, their weight losses had a standard deviation of 4.9 lb (based on data from “Comparison of the Atkins, Ornish, Weight Watchers, and Zone Diets for Weight Loss and Heart Disease Reduction,” by Dansinger, et al., Journal of the American
The majority of college students have credit cards.Examine the given statement, then express the null hypothesis H0 and alternative hypothesis H1 in symbolic form. Be sure to use the correct symbol (μ, p, σ) for the indicated parameter.
Showing 200 - 300
of 2934
1
2
3
4
5
6
7
8
9
10
11
12
13
14
15
Last
Step by Step Answers