New Semester
Started
Get
50% OFF
Study Help!
--h --m --s
Claim Now
Question Answers
Textbooks
Find textbooks, questions and answers
Oops, something went wrong!
Change your search query and then try again
S
Books
FREE
Study Help
Expert Questions
Accounting
General Management
Mathematics
Finance
Organizational Behaviour
Law
Physics
Operating System
Management Leadership
Sociology
Programming
Marketing
Database
Computer Network
Economics
Textbooks Solutions
Accounting
Managerial Accounting
Management Leadership
Cost Accounting
Statistics
Business Law
Corporate Finance
Finance
Economics
Auditing
Tutors
Online Tutors
Find a Tutor
Hire a Tutor
Become a Tutor
AI Tutor
AI Study Planner
NEW
Sell Books
Search
Search
Sign In
Register
study help
mathematics
elementary statistics picturing
Elementary Statistics 11th Edition Mario F. Triola - Solutions
Original claim: The percentage of on-time U.S. airline flights is less than 75%.Initial conclusion: Reject the null hypothesis.State the final conclusion in simple nontechnical terms. Be sure to address the original claim.
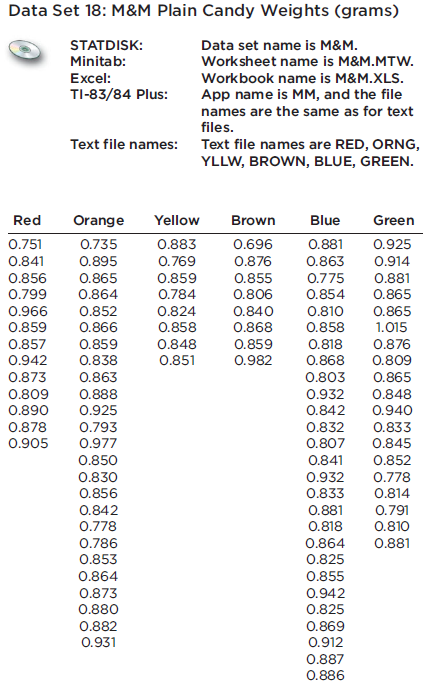
In a simple random sample of 50 plain M&M candies, it is found that none of them are blue. We want to use a 0.01 significance level to test the claim of Mars, Inc., that the proportion of M&M candies that are blue is equal to 0.10. Can the methods of this section be used? If so, test the
Original claim: The percentage of Americans who believe in heaven is equal to 90%.Initial conclusion: Reject the null hypothesis.State the final conclusion in simple nontechnical terms. Be sure to address the original claim.
Original claim: The percentage of Americans who know their credit score is equal to 20%.Initial conclusion: Fail to reject the null hypothesis.State the final conclusion in simple nontechnical terms. Be sure to address the original claim.
The percentage of nonsmokers exposed to secondhand smoke is equal to 41%.Identify the type I error and the type II error that correspond to the given hypothesis.
The percentage of Americans who believe that life exists only on earth is equal to 20%.Identify the type I error and the type II error that correspond to the given hypothesis.
The percentage of college students who consume alcohol is greater than 70%.Identify the type I error and the type II error that correspond to the given hypothesis.
The percentage of households with at least two cell phones is less than 60%.Identify the type I error and the type II error that correspond to the given hypothesis.
a. If a null hypothesis is rejected with a significance level of 0.05, is it also rejected with a significance level of 0.01? Why or why not?b. If a null hypothesis is rejected with a significance level of 0.01, is it also rejected with a significance level of 0.05? Why or why not?
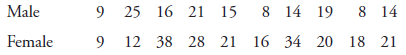
Listed below are the numbers of words (in thousands) males and females in randomly selected couples spoke in a day (based on data from ?Are Women Really More Talkative Than Men?? by Mehl, Vazire, Ramirez-Esparza, Slatcher, and Pennebaker, Science, Vol. 317, No. 5834). a. Are the two samples
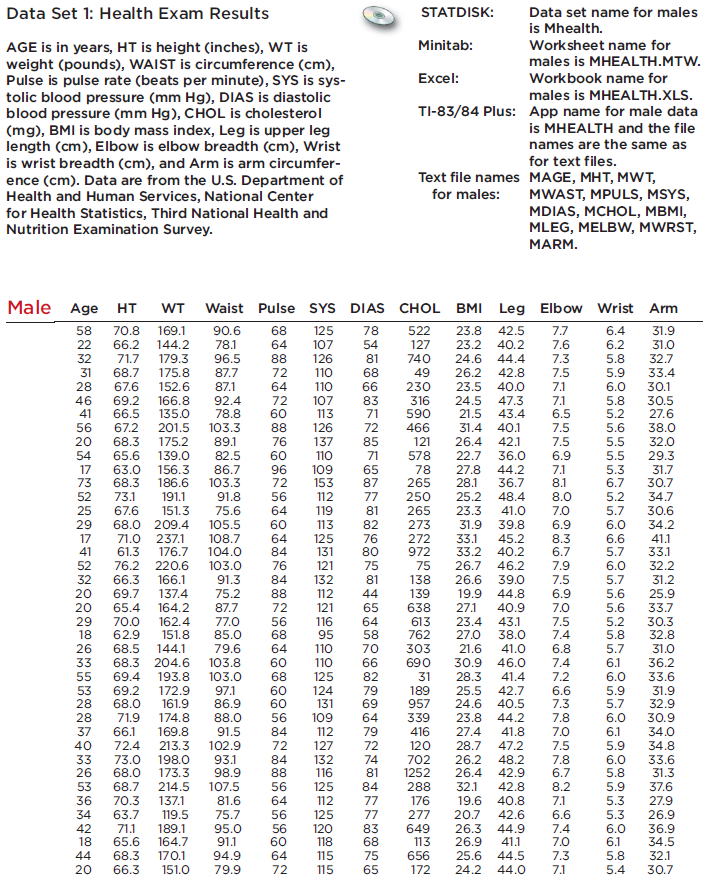
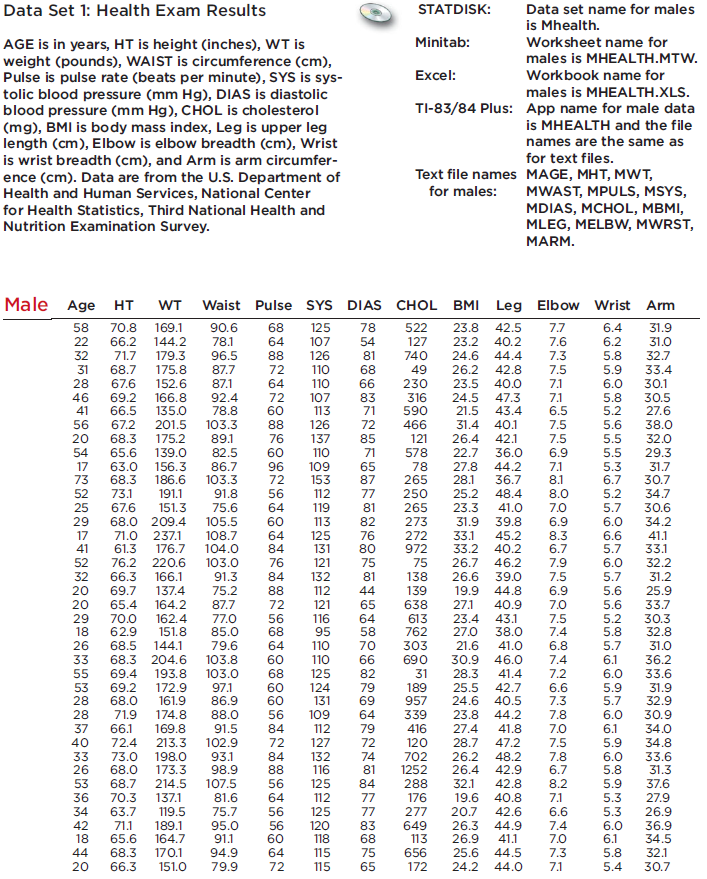
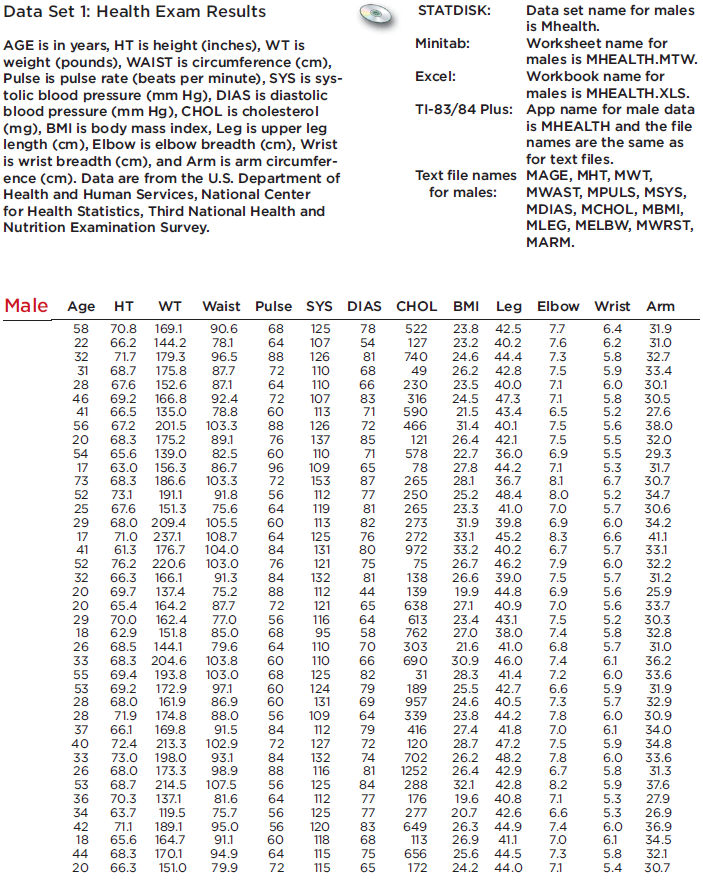
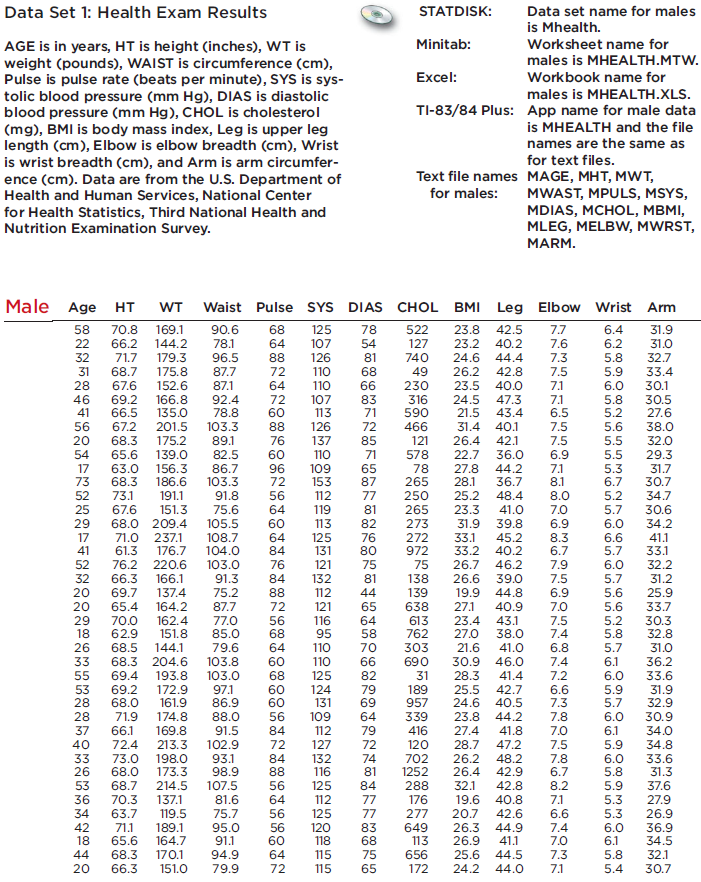
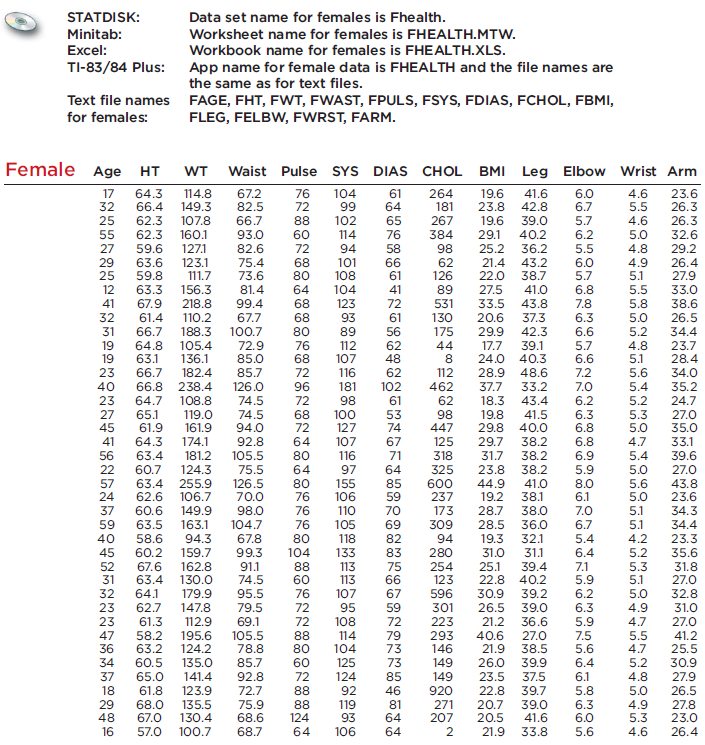
If the pulse rates of men and women from Data Set 1 in Appendix B are used to construct a 95% confidence interval for the difference between the two population means, the result is -12.2 1 - ?2 Data Set 1: Health Exam Results AGE is in years, HT is height (inches), WT is weight (pounds), WAIST is
Listed below are the time intervals (in minutes) before and after eruptions of the Old Faithful geyser. Find the values of d and sd. In general, what does ?d represent? Time interval before eruption Time interval after eruption 98 92 95 87 96 92 95 92 100 90
What does it mean when we say that some methods in this chapter are robust against departures from normality? Which method of this chapter is not robust against departures from normality?
In clinical trials of the drug Zocor, some subjects were treated with Zocor and others were given a placebo. The 95% confidence interval estimate of the difference between the proportions of subjects who experienced headaches is - 0.0518 < p1 - p2 < 0.0194 (based on data from Merck & Co.,
The drug Dozenol is tested on 40 male subjects recruited from New York and 40 female subjects recruited from California. The researcher pairs the 40 male subjects and the 40 female subjects. Can the methods of this section be used to analyze the results? Why or why not?
The word ginormous was added to the Merriam-Webster Dictionary at the time this exercise was written. AOL conducted an online poll in which Internet users were asked “What do you think of the word ‘ginormous’?” Among the Internet users who chose to respond, 12,908 gave the word a thumbs up,
Researchers conducted a study to assess the effects that occur when children are exposed to cocaine before birth. Children were tested at age 4 for object assembly skill, which was described as “a task requiring visual-spatial skills related to mathematical competence.” The 190 children born to
The author repeated the process of selecting two different random samples of heights of men (from data obtained through the National Health and Nutrition Examination Survey). In each case, the ratio s21/s22 was recorded without the stipulation that s1 is the larger of the two standard deviations.
In clinical trials of the drug Zocor, 1583 subjects were treated with Zocor and 15 of them experienced headaches. A placebo is used for 157 other subjects, and 8 of them experienced headaches (based on data from Merck & Co., Inc.). We plan to conduct a hypothesis test involving a claim about
Assume that you want to use a 0.01 significance level to test the claim that the mean pulse rate of men is less than the mean pulse rate of women. What confidence level should be used if you want to test that claim using a confidence interval?
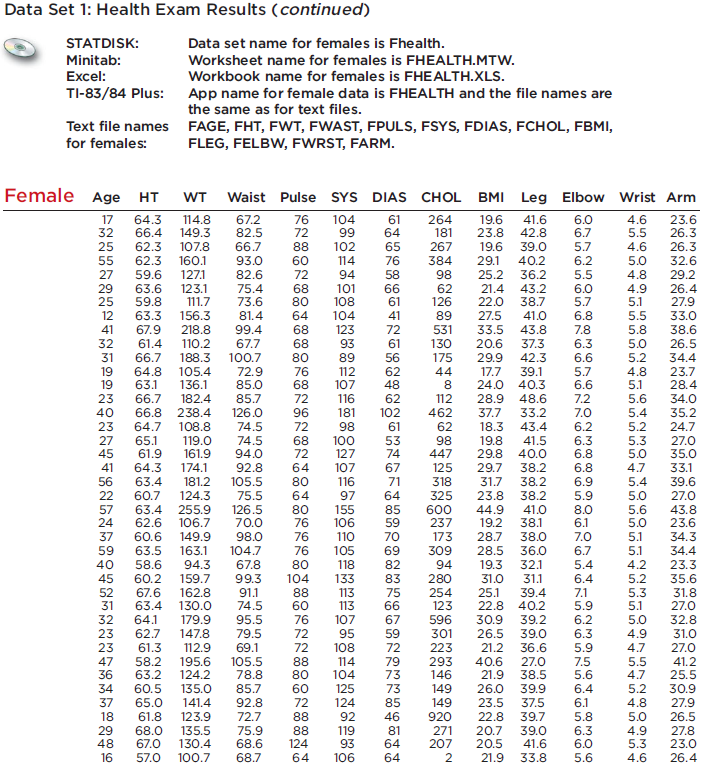
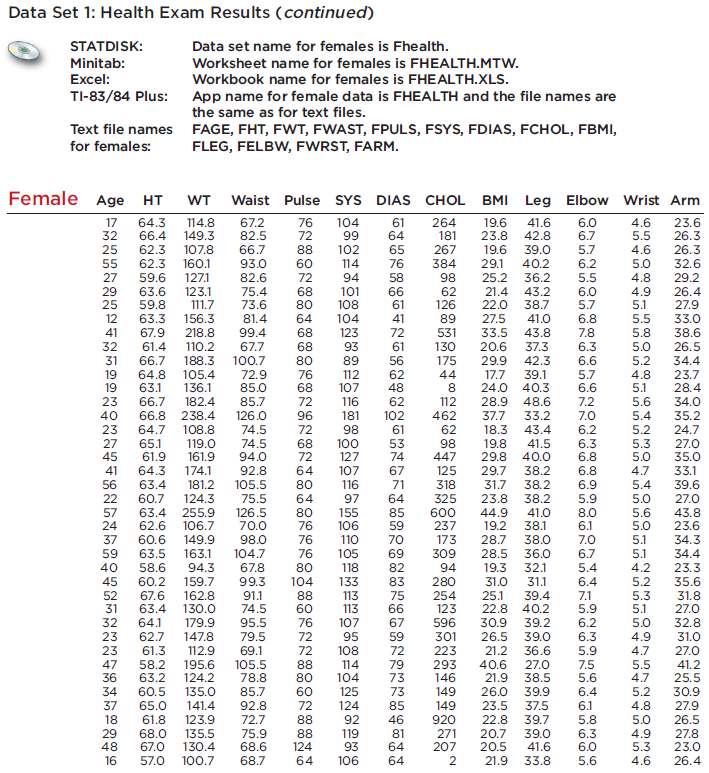
Using Data Set 1 in Appendix B, a researcher pairs pulse rates and cholesterol levels for the 40 women. Can the methods of this section be used to construct a confidence interval? Why or why not? Data Set 1: Health Exam Results AGE is in years, HT is height (inches), WT is weight (pounds), WAIST
A nutritionist selects a simple random sample of 50 cans of Coke and another simple random sample of 50 cans of Pepsi. The cans are arranged as 50 pairs, then the sugar content of each can is measured. Are the two samples (Coke and Pepsi) independent or dependent? Explain.
In 1908, ?Student? (William Gosset) published the article ?The Probable Error of a Mean? (Biometrika, Vol. 6, No. 1). He included the data listed below for two different types of straw seed (regular and kiln dried) that were used on adjacent plots of land. The listed values are the yields of straw
What does it mean when we say that the F test described in this section is not robust against departures from normality? Name two alternatives that are more robust against departures from normality.
Given a simple random sample of men and a simple random sample of women, we want to use a 0.05 significance level to test the claim that the percentage of men who smoke is equal to the percentage of women who smoke. One approach is to use the P-value method of hypothesis testing, a second approach
Assume that you want to use a 0.01 significance level to test the claim that the mean pulse rate of women is greater than the mean pulse rate of men using the sample data from Data Set 1 in Appendix B. Both samples have 40 values. If we use df = smaller of n1 - 1 and n2 - 1, we get df = 39, and the
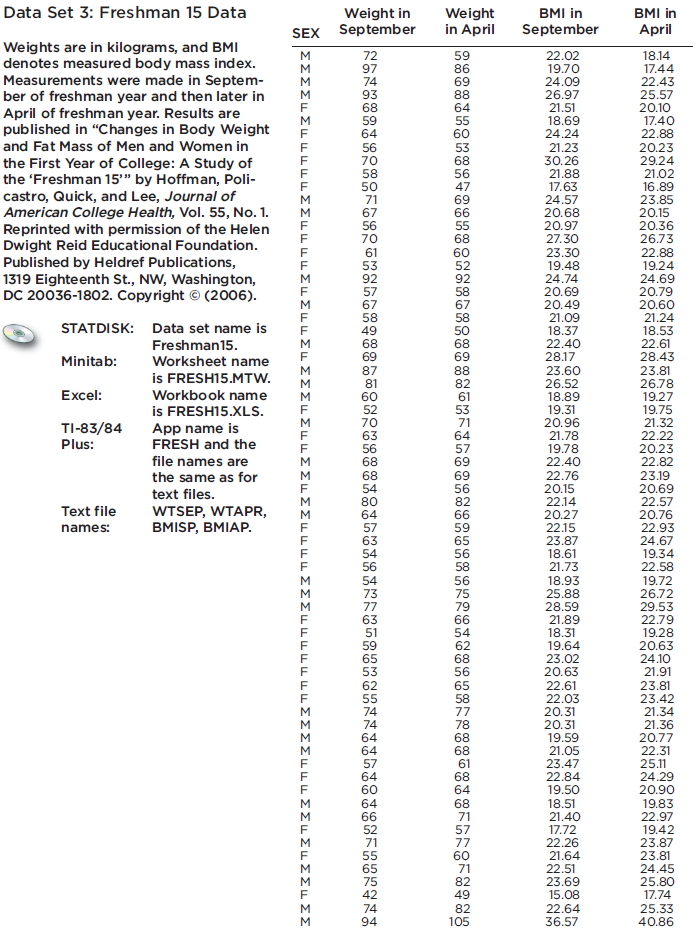
Example 4 showed that the 67 dependent April and September weight measurements from Data Set 3 in Appendix B result in this 95% confidence interval: 0.2 kg d 1 - ?2 Data Set 3: Freshman 15 Data Weights are in kilograms, and BMI denotes measured body mass index. Measurements were made in Septem-
An employee of the U.S. Department of Labor obtains the mean age of men and the mean age of women for each of the 50 states. She then uses those means to construct a confidence interval estimate of the difference between the mean age of men in the United States and the mean age of women in the
Given that the F test is not robust against departures from normality, it becomes necessary to verify that the two samples are from populations having distributions that are quite close to normal distributions. Assume that you want to test the claim of equal standard deviations using the samples of
From an article in Journal of the American Medical Association: Among 8834 malfunctioning pacemakers, in 15.8% the malfunctions were due to batteries.Find the number of successes x suggested by the given statement.
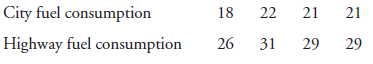
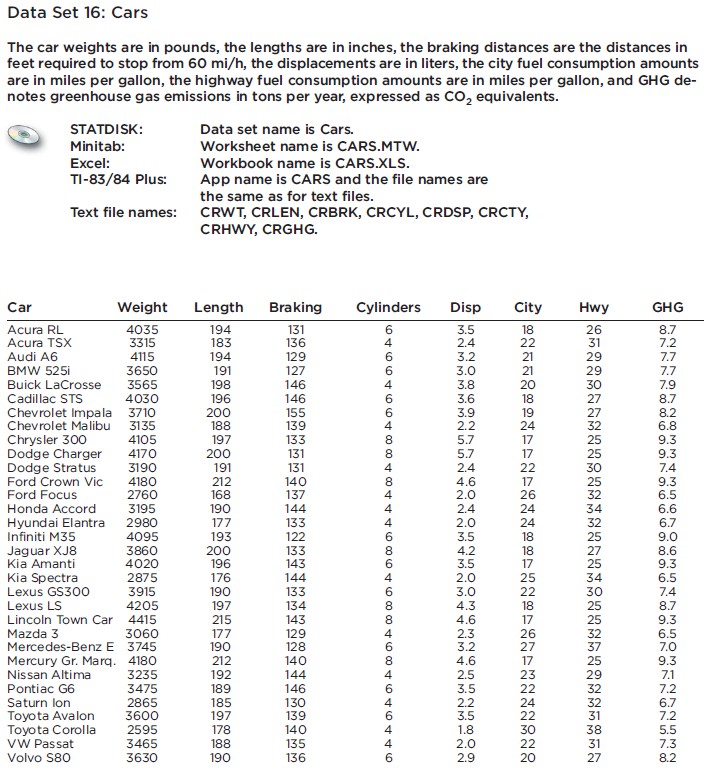
Listed below are measured fuel consumption amounts (in miles gal) from a sample of cars (Acura RL, Acura TSX, Audi A6, BMW 525i) taken from Data Set 16 in Appendix B. City fuel consumption Highway fuel consumption 18 26 31 22 21 21 29 29 Data Set 16: Cars The car weights are in pounds, the
Express the confidence interval 0.200 < p < 0.500 in the form of p ± E.Express the confidence interval using the indicated format.
95% confidence; n = 30, x = 1533, s = 333Use the given confidence level and sample data to find a confidence interval for the population standard deviation σ. In each case, assume that a simple random sample has been selected from a population that has a normal distribution.
a. Use the sample data from Exercise 9 to construct a 95% confidence interval estimate of the population standard deviation.b. Use the sample data from Exercise 9 to construct a 95% confidence interval estimate of the population variance.Exercise 9a. What is the best point estimate of the mean
If you conduct a poll by surveying all of your friends that you see during the next week, which of the following terms best describes the type of sampling used: random, systematic, cluster, convenience, voluntary response? Is the sample likely to be representative of the population?
The braking distances of a simple random sample of cars: 95% confidence; n = 32, x = 137 ft, and σ is known to be 7 ft.Find the margin of error and confidence interval if the necessary requirements are satisfied. If the requirements are not all satisfied, state that the margin of error and
95%; n = 9; σ is unknown; population appears to be very skewed.Assume that we want to construct a confidence interval using the given confidence level. Do one of the following, as appropriate: (a) Find the critical value zα/2, (b) find the critical value tα/2, (c) state that neither the normal
Express the confidence interval 0.720 < p < 0.780 in the form of p ± E.Express the confidence interval using the indicated format.
95% confidence; n = 25, x = 81.0 mi/h, s = 2.3 mi/h.Use the given confidence level and sample data to find a confidence interval for the population standard deviation σ. In each case, assume that a simple random sample has been selected from a population that has a normal distribution.
The amounts of rainfall for a simple random sample of Saturdays in Boston: 99% confidence; n = 12, x = 0.133 in., σ is known to be 0.212 in., and the population is known to have daily rainfall amounts with a distribution that is far from normal.Find the margin of error and confidence interval if
99%; n = 12; σ is unknown; population appears to be normally distributed.Assume that we want to construct a confidence interval using the given confidence level. Do one of the following, as appropriate: (a) Find the critical value zα/2, (b) find the critical value tα/2, (c) state that neither
Express the confidence interval (0.437, 0.529) in the form of p ± E.Express the confidence interval using the indicated format.
99% confidence; n = 7, x = 7.106, s = 2.019Use the given confidence level and sample data to find a confidence interval for the population standard deviation σ. In each case, assume that a simple random sample has been selected from a population that has a normal distribution.
The times before failure of integrated circuits used in calculators: 99% confidence; n = 25 x = 112 hours σ is known to be 18.6 hours, and the distribution of all times before failure is far from normal.Find the margin of error and confidence interval if the necessary requirements are satisfied.
95%; n = 38; σ is unknown; population appears to be skewed.Assume that we want to construct a confidence interval using the given confidence level. Do one of the following, as appropriate: (a) Find the critical value zα/2, (b) find the critical value tα/2, (c) state that neither the normal nor
Express the confidence interval 0.222 ± 0.044 in the form of p - E < p < p + E.Express the confidence interval using the indicated format.
99% confidence; n = 8, x = 1.24 sec, s = 0.12 secUse the given confidence level and sample data to find a confidence interval for the population standard deviation σ. In each case, assume that a simple random sample has been selected from a population that has a normal distribution.
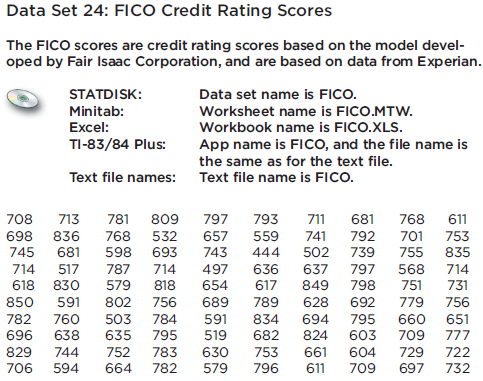
How many adults must be randomly selected to estimate the mean FICO (credit rating) score of working adults in the United States. We want 95% confidence that the sample mean is within 3 points of the population mean, and the population standard deviation is 68.
95% confidence; n = 20, x = $9004, s = $569 (based on data from hospital costs for car crash victims who wore seat belts, from the U.S. Department of Transportation)Use the given confidence level and sample data to find (a) the margin of error and (b) the confidence interval for the population mean
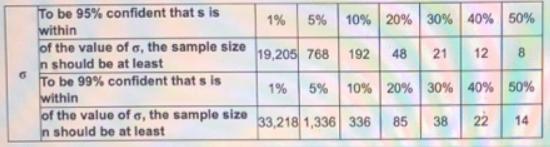
Find the minimum sample size needed to be 95% confident that the sample standard deviation s is within 1% of σ. Is this sample size practical in most applications?Assume that each sample is a simple random sample obtained from a normally distributed population. Use Table 7-2 to find the indicated
Use the given confidence interval limits to find the point estimate and the margin of error E.(0.320, 0.420)
How many cars must be randomly selected and tested in order to estimate the mean braking distance of registered cars in the United States. We want 99% confidence that the sample mean is within 2 ft of the population mean, and the population standard deviation is known to be 7 ft.
99% confidence; n = 7, x = 0.12, s = 0.04 (original values are nitrogenoxide emissions in grams mile, from the Environmental Protection Agency)Use the given confidence level and sample data to find (a) the margin of error and (b) the confidence interval for the population mean μ. Assume that the
A researcher wants to estimate the mean grade point average of all current college students in the United States. She has developed a procedure to standardize scores from colleges using something other than a scale between 0 and 4. How many grade point averages must be obtained so that the sample
Use the given confidence interval limits to find the point estimate and the margin of error E.0.772 < p < 0.776
Find the minimum sample size needed to be 95% confident that the sample standard deviation s is within 30% of σ. Is this sample size practical in most applications?Assume that each sample is a simple random sample obtained from a normally distributed population. Use Table 7-2 on page 376 to find
How many daily rainfall amounts in Boston must be randomly selected to estimate the mean daily rainfall amount? We want 99% confidence that the sample mean is within 0.010 in. of the population mean, and the population standard deviation is known to be 0.212 in.
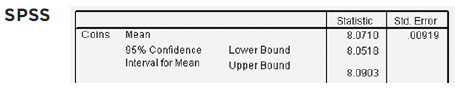
95% confidence; n = 20, x = 8.0710 g, s = 0.0411g (based on measurements made by the author). See the following SPSS display. Use the given data and the corresponding display to express the confidence interval in the format of x - E SPSS Coins Mean 95% Confidence Interval for Mean Lower Bound
Use the given confidence interval limits to find the point estimate and the margin of error E.0.433 < p < 0.527
Find the minimum sample size needed to be 99% confident that the sample variance is within 40% of the population variance. Is such a sample size practical in most cases?Assume that each sample is a simple random sample obtained from a normally distributed population. Use Table 7-2 to find the
How many integrated circuits must be randomly selected and tested for time to failure in order to estimate the mean time to failure? We want 95% confidence that the sample mean is within 2 hr of the population mean, and the population standard deviation is known to be 18.6 hours.
99% confidence; n = 62, x = 1.911 lb, s = 1.065 lb (based on data from the Garbage Project, University of Arizona). See the TI-83/84 Plus calculator display in the margin.Use the given data and the corresponding display to express the confidence interval in the format of x - E < μ < x + E.
Use the given confidence interval limits to find the point estimate and the margin of error E.0.102 < p < 0.236
Find the minimum sample size needed to be 95% confident that the sample variance is within 20% of the population variance.Assume that each sample is a simple random sample obtained from a normally distributed population. Use Table 7-2 to find the indicated sample size.
Identify the value of the point estimate of the population mean μ.Refer to the accompanying TI-83 84 Plus calculator display of a 95% confidence interval. The sample display results from using a simple random sample of the amounts of tar (in milligrams) in cigarettes that are all king size,
In a test of the effectiveness of garlic for lowering cholesterol, 47 subjects were treated with Garlicin, which is garlic in a processed tablet form. Cholesterol levels were measured before and after the treatment. The changes in their levels of LDL cholesterol (in mg dL) have a mean of 3.2 and a
n = 1000, x = 400, 95% confidenceAssume that a sample is used to estimate a population proportion p. Find the margin of error E that corresponds to the given statistics and confidence level.
Express the confidence interval in the format of x - E < μ < x + E.Refer to the accompanying TI-83 84 Plus calculator display of a 95% confidence interval. The sample display results from using a simple random sample of the amounts of tar (in milligrams) in cigarettes that are all king size,
A random sample of the birth weights of 186 babies has a mean of 3103 g and a standard deviation of 696 g (based on data from “Cognitive Outcomes of Preschool Children with Prenatal Cocaine Exposure,” by Singer et al., Journal of the American Medical Association, Vol. 291, No. 20). These babies
n = 500, x = 220, 99% confidenceAssume that a sample is used to estimate a population proportion p. Find the margin of error E that corresponds to the given statistics and confidence level.
Data Set 18 in Appendix B lists 100 weights (in grams) of M&M candies. The minimum weight is 0.696 g and the maximum weight is 1.015 g. a. Use the range rule of thumb to estimate ?, the standard deviation of weights of all such M&Ms. b. The 100 weights have a standard deviation of 0.0518 g.
Express the confidence interval in the format of x ± E.Refer to the accompanying TI-83 84 Plus calculator display of a 95% confidence interval. The sample display results from using a simple random sample of the amounts of tar (in milligrams) in cigarettes that are all king size, nonfiltered,
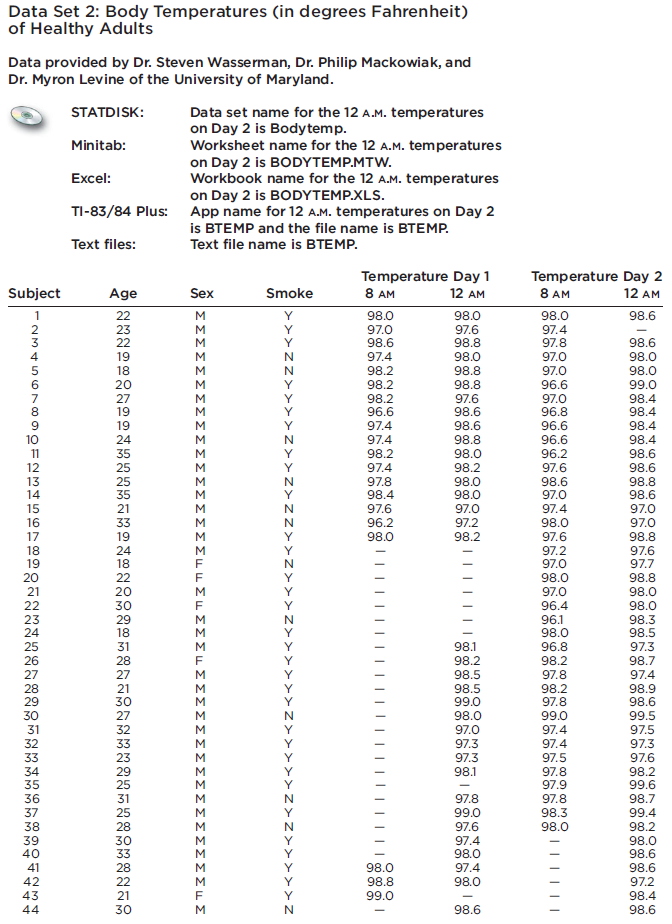
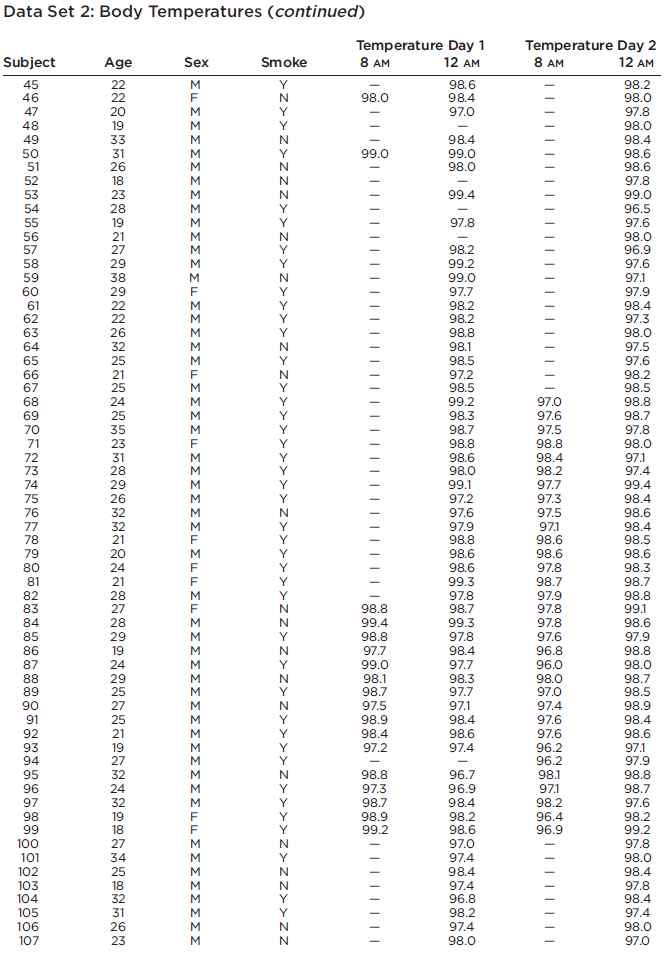
Data Set 2 in Appendix B includes 106 body temperatures for which x= 98.20?F and s = 0.62?F. a. What is the best point estimate of the mean body temperature of all healthy humans? b. Using the sample statistics, construct a 99% confidence interval estimate of the mean body temperature of all
Using the simple random sample of weights of women from Data Set 1 in Appendix B, we obtain these sample statistics: n = 40 and x = 146.22. Research from other sources suggests that the population of weights of women has a standard deviation given by σ = 30.86 lb.a. Find the best point estimate of
98% confidence; the sample size is 1230, of which 40% are successes.Assume that a sample is used to estimate a population proportion p. Find the margin of error E that corresponds to the given statistics and confidence level.
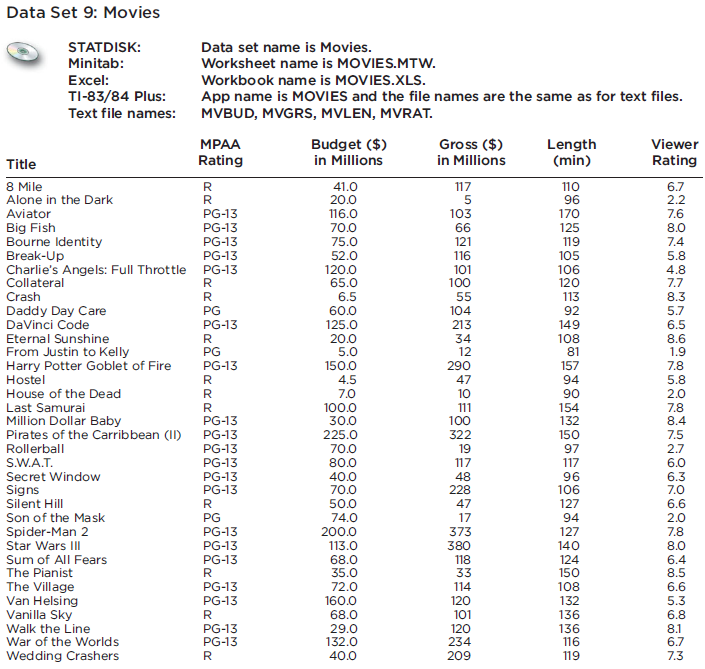
Data Set 9 in Appendix B includes 23 movies with ratings of PG or PG-13, and those movies have lengths (in minutes) with a mean of 120.8 min and a standard deviation of 22.9 min. That same data set also includes 12 movies with R ratings, and those movies have lengths with a mean of 118.1 min and a
Write a statement that interprets the 95% confidence interval.Refer to the accompanying TI-83 84 Plus calculator display of a 95% confidence interval. The sample display results from using a simple random sample of the amounts of tar (in milligrams) in cigarettes that are all king size,
In a test of the Atkins weight loss program, 40 individuals participated in a randomized trial with overweight adults. After 12 months, the mean weight loss was found to be 2.1 lb, with a standard deviation of 4.8 lb.a. What is the best point estimate of the mean weight loss of all overweight
90% confidence; the sample size is 1780, of which 35% are successes.Assume that a sample is used to estimate a population proportion p. Find the margin of error E that corresponds to the given statistics and confidence level.
Data Set 1 in Appendix B includes 40 pulse rates of men, and those pulse rates have a mean of 69.4 beats per minute and a standard deviation of 11.3 beats per minute. That data set also includes 40 pulse rates of women, and those pulse rates have a mean of 76.3 beats per minute and a standard
In a study designed to test the effectiveness of echinacea for treating upper respiratory tract infections in children, 337 children were treated with echinacea and 370 other children were given a placebo. The numbers of days of peak severity of symptoms for the echinacea treatment group had a mean
Use the sample data and confidence level to construct the confidence interval estimate of the population proportion p.n = 200, x = 40, 95% confidence
Twelve different video games showing substance use were observed and the duration times of game play (in seconds) are listed below (based on data from “Content and Ratings of Teen-Rated Video Games,” by Haninger and Thompson, Journal of the American Medical Association, Vol. 291, No. 7). The
A simple random sample of 40 salaries of NCAA football coaches has a mean of $415,953. Assume that σ = $463,364.a. Find the best point estimate of the mean salary of all NCAA football coaches.b. Construct a 95% confidence interval estimate of the mean salary of an NCAA football coach.c. Does the
In a study designed to test the effectiveness of acupuncture for treating migraine, 142 subjects were treated with acupuncture and 80 subjects were given a sham treatment. The numbers of migraine attacks for the acupuncture treatment group had a mean of 1.8 and a standard deviation of 1.4. The
Use the sample data and confidence level to construct the confidence interval estimate of the population proportion p.n = 2000, x = 400, 95% confidence
In the course of designing theater seats, the sitting heights (in mm) of a simple random sample of adult women is obtained, and the results are listed below (based on anthropometric survey data from Gordon, Churchill, et al.). Use the sample data to construct a 95% confidence interval estimate of
Randomly selected statistics students of the author participated in an experiment to test their ability to determine when 1 min (or 60 seconds) has passed. Forty students yielded a sample mean of 58.3 sec. Assume that σ = 9.5 sec.a. Find the best point estimate of the mean time for all statistics
In a study designed to test the effectiveness of magnets for treating back pain, 20 patients were given a treatment with magnets and also a sham treatment without magnets. Pain was measured using a standard Visual Analog Scale (VAS). After given the magnet treatments, the 20 patients had VAS scores
Use the sample data and confidence level to construct the confidence interval estimate of the population proportion p.n = 1236, x = 109, 99% confidence
The ages of the 79 actresses at the time that they won Oscars for the Best Actress category have a mean of 35.8 years and a standard deviation of 11.3 years. The ages of the 79 actors at the time that they won Oscars for the category of Best Actor have a mean of 43.8 years and a standard deviation
Use the sample data and confidence level to construct the confidence interval estimate of the population proportion p.n = 5200, x = 4821, 99% confidence
a. The listed values are waiting times (in minutes) of customers at the Jefferson Valley Bank, where customers enter a single waiting line that feeds three teller windows. Construct a 95% confidence interval for the population standard deviation σ.6.5 6.6 6.7 6.8 7.1 7.3 7.4 7.7 7.7 7.7b. The
A simple random sample of 125 SAT scores has a mean of 1522. Assume that SAT scores have a standard deviation of 333.a. Construct a 95% confidence interval estimate of the mean SAT score.b. Construct a 99% confidence interval estimate of the mean SAT score.c. Which of the preceding confidence
Listed below are measured amounts of lead (in micrograms per cubic meter, or μg/m3) in the air. The Environmental Protection Agency (EPA) has established an air quality standard for lead of 1.5μg/m3. The measurements shown below were recorded at Building 5 of the World Trade Center site on
Refer to Data Set 24 in Appendix B and use the credit rating scores to construct a 95% confidence interval estimate of the standard deviation of all credit rating scores. Data Set 24: FICO Credit Rating Scores The FICO scores are credit rating scores based on the model devel- oped by Fair Isaac
A simple random sample of birth weights in the United States has a mean of 3433 g. The standard deviation of all birth weights is 495 g.a. Using a sample size of 75, construct a 95% confidence interval estimate of the mean birth weight in the United States.b. Using a sample size of 75,000,
Margin of error: 0.005; confidence level: 99%; p and q unknownUse the given data to find the minimum sample size required to estimate a population proportion or percentage.
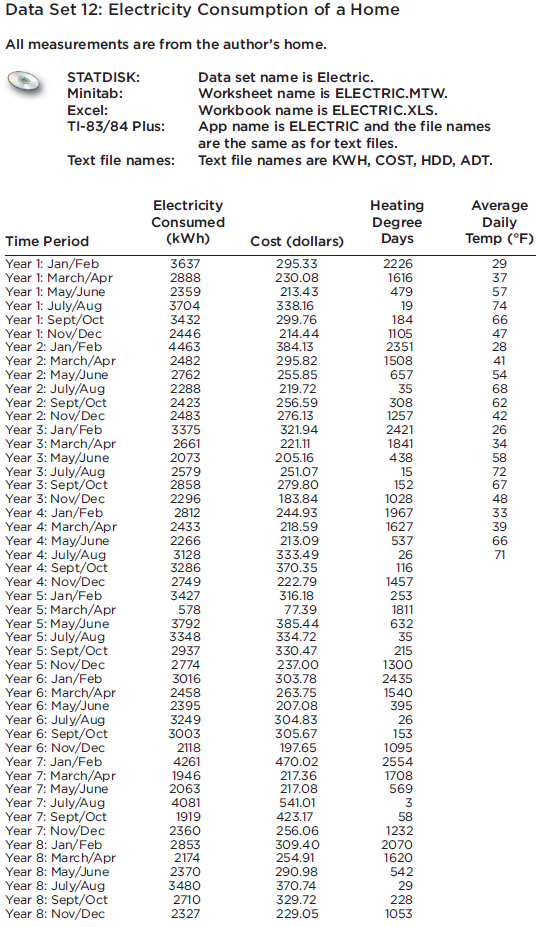
Refer to Data Set 12 in Appendix B and use the sample amounts of home energy consumption (in kWh) to construct a 99% confidence interval estimate of the standard deviation of all energy consumption amounts. Data Set 12: Electricity Consumption of a Home All measurements are from the author's home.
When 14 different second-year medical students at Bellevue Hospital measured the blood pressure of the same person, they obtained the results listed below. Assuming that the population standard deviation is known to be 10 mmHg, construct a 95% confidence interval estimate of the population mean.
Showing 100 - 200
of 2934
1
2
3
4
5
6
7
8
9
10
11
12
13
14
15
Last
Step by Step Answers