New Semester
Started
Get
50% OFF
Study Help!
--h --m --s
Claim Now
Question Answers
Textbooks
Find textbooks, questions and answers
Oops, something went wrong!
Change your search query and then try again
S
Books
FREE
Study Help
Expert Questions
Accounting
General Management
Mathematics
Finance
Organizational Behaviour
Law
Physics
Operating System
Management Leadership
Sociology
Programming
Marketing
Database
Computer Network
Economics
Textbooks Solutions
Accounting
Managerial Accounting
Management Leadership
Cost Accounting
Statistics
Business Law
Corporate Finance
Finance
Economics
Auditing
Tutors
Online Tutors
Find a Tutor
Hire a Tutor
Become a Tutor
AI Tutor
AI Study Planner
NEW
Sell Books
Search
Search
Sign In
Register
study help
physics
principles communications systems
Principles of Communications Systems, Modulation and Noise 7th edition Rodger E. Ziemer, William H. Tranter - Solutions
Assume that the input to a perfect second-order PLL is an unmodulated sinusoid plus band limited AWGN. In other words, the PLL input is represented byXc(t) = Ac cos(2πfct + θ) + nc(t) cos(2πfct + θ) - ns(t) sin(2πfct + θ)Also assume that the SNR at the loop input is large so that
A base band digital transmission system that sends ± A-valued rectangular pulses through a channel at a rate of 20,000 bps is to achieve an error probability of 10-6. If the noise power spectral density is N0 = 10-6 W/Hz, what is the required value of A? What is a rough estimate of the
Write a computer program to evaluate the degradation imposed by bit timing error at a desired error probability as discussed in Problem 9.7.Data From Problem 9.7.The received signal in a digital base band system is either +A or -A, equally likely, for T-second contiguous intervals. However, the
Consider an antipodal base band digital transmission system with a noise level of N0 = 10-3 W/Hz. The signal bandwidth is defined to be that required to pass the main lobe of the signal spectrum. Fill in the following table with the required signal power and bandwidth to achieve the error
Suppose N0 = 10-6 W/Hz and the base band data bandwidth is given by B = R = 1 / T Hz.For the Required Signal Power A2 and BandwidthR, bps PE = 10-3 PE = 10-4 PE = 10-4 PE = 10-5 PE = 10-61,00010,000100,000following bandwidths, find the required signal powers, A2, to give bit error probability of
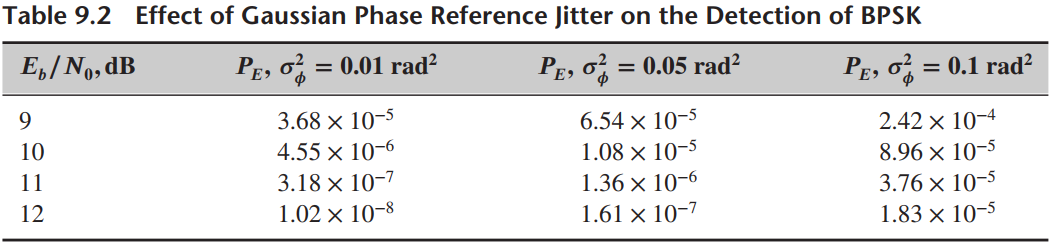
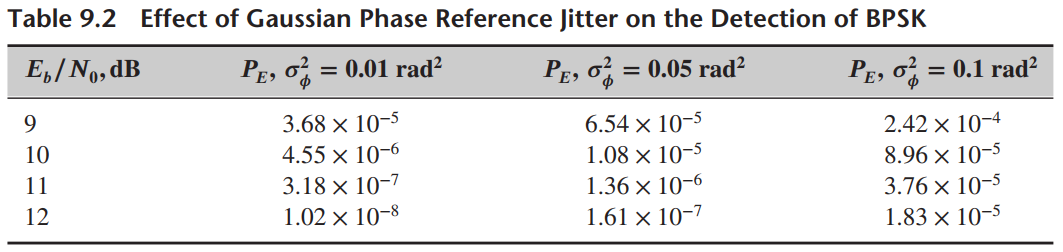
Write a computer program to evaluate the degradation imposed by Gaussian phase jitter at a desired error probability as discussed in connection with the data presented in Table 9.2. This will require numerical integration. Table 9.2 Effect of Gaussian Phase Reference Jitter on the Detection of BPSK
A receiver for base band digital data has a threshold set at ε instead of zero. Rederive (9.8), (9.9), and (9.11) taking this into account. If P(+A) = P(-A) = 1/2, find Eb / N0 in decibels as a function of e for 0 ≤ ε /σ ≤ 1 to give PE = 10-6, where σ2 is the variance of N.
Design a Monte Carlo simulation of a delay-and multiply DPSK receiver operating in additive white Gaussian noise to show the degradation of its operation relative to the optimum receiver for DPSK. One of your adjustable parameters for the simulation should be the bandwidth of the input filter
With N0 = 10-5 W/Hz and A = 40 mV in a base band data transmission system, what is the maximum data rate (use a bandwidth of 0 to first null of the pulse spec trum) that will allow a PE of 10-4 or less? 10-5? 10-6?
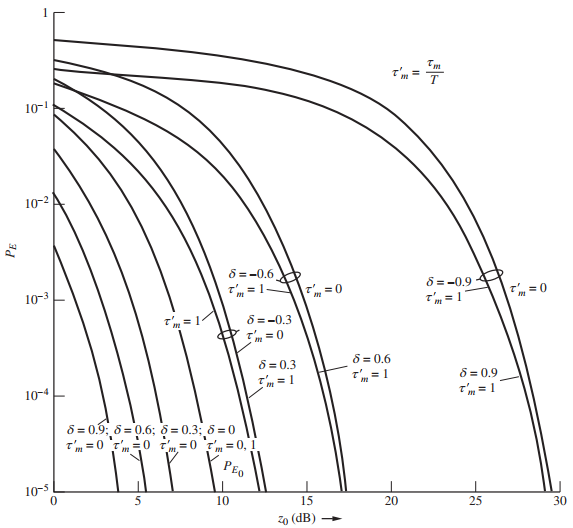
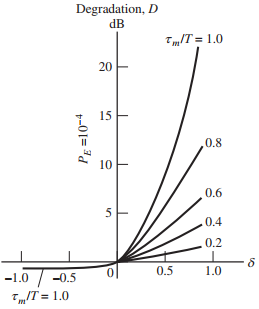
Write a computer program to verify Figures 9.28 and 9.29.Figure 9.28Figure 9.29 T'm = T 10-1 10-2 8 =-0.6 8= -0.9 T', = 1 T'm = 0 , =0 10-3 T'm = 1 8 =-0.3 T'm = 0 T'm = 1 8 = 0.6 T'm = 1 8 = 0.3 Tm = 1 8 = 0.9 T'm = 1 10-4 8 = 0.9; 6 = 0.6; 8 = 0.3: 6 = 0 T'm =0 Tm=0 m=0 Fm = 0,1 PEO 10-3 10 15 20
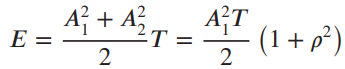
Consider antipodal signaling with amplitude imbalance. That is, a logic 1 is transmitted as a rectangular pulse of amplitude A1 and duration T, and a logic 0 is transmitted as a rectangular pulse of amplitude -A2 where A1‰¥ A2> 0. The receiver theshold is still set at
Write a computer program to evaluate degradation due to flat Rayleigh fading at a specified error probability. Include PSK, FSK, DPSK, and non-coherent FSK.
Write a computer program to design equalizers for specified channel conditions for: (a) the zero-forcing criterion; (b) the MMSE criterion.
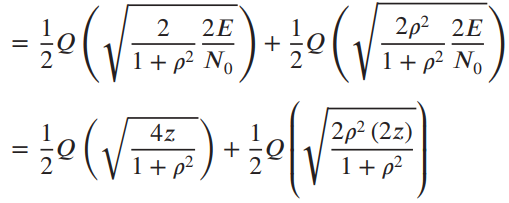
Redo the derivation of Section 9.1 for the case where the possible transmitted signals are either 0 or A for T seconds. Let the threshold be set at AT / 2.Express your result in terms of signal energy averaged over both signal possibilities, which are assumed equally probable;i.e., (0) + A?T
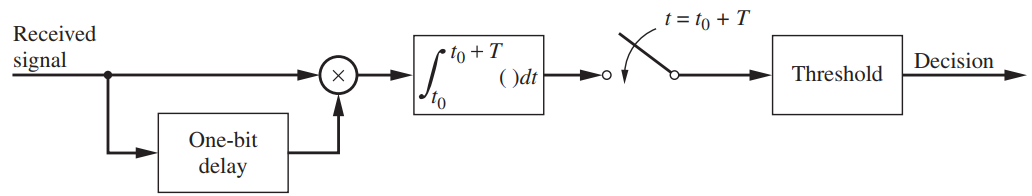
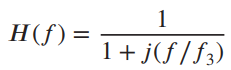
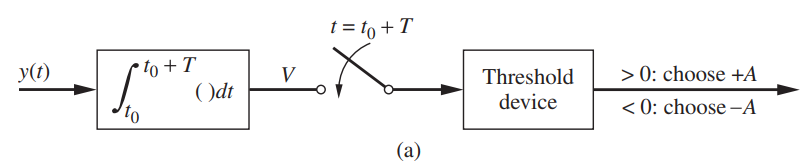
As an approximation to the integrate-and-dump detector in Figure 9.3(a), we replace the integrator with a low pass RC filter with frequency response function where f3 is the 3-dB cut off frequency Figure 9.3(a)(a) Find s02, (T) / E{n20(t)}, where s0(T) is the value of the output signal at
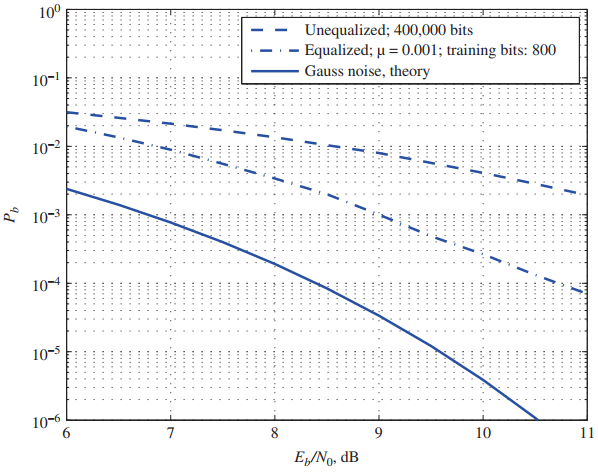
Write a computer simulation program to evaluate the bit error rate performance of a MMSE equalizer using LMS tap weight adjustment, thus verifying the results of Figure 9.33. 100 Unequalized; 400,000 bits - Equalized; µ = 0.001; training bits: 800 · Gauss noise, theory 10-! 10-2 e 10-3 10-4 10-5
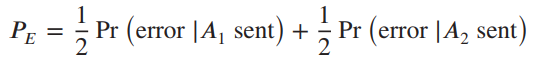
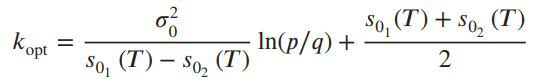
Assume that the probabilities of sending the signals s1(t) and s2(t) are not equal, but are given by p and q = 1 - p, respectively. Derive an expression for PEthat replaces (9.32) that takes this into account. Show that the error probability is minimized by choosing the threshold to be ,(T)+
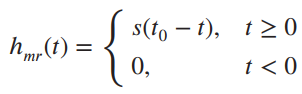
The general definition of a matched filter is a filter that maximizes peak signal-to-rms noise at some prechosen instant of time t0.(a) Assuming white noise at the input, use Schwarz€™s inequality to show that the frequency response function of the matched filter isHm(f) = S*(f)
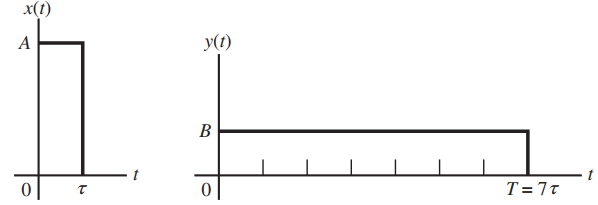
Referring to Problem 9.11 for the general definition of a matched filter, find the following in relation to the two signals shown in Figure 9.34.(a) The causal matched-filter impulse responses. Sketch them.(b) Relate the constants A and B so that both cases give the same peak-signal-to-rms noise
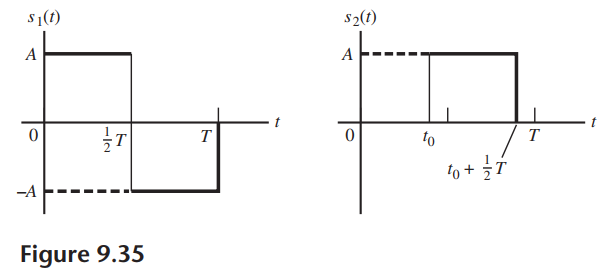
(a) Find the optimum (matched) filter impulse response h0(t), as given by (9.45) for s1(t) and s2(t), shown in Figure 9.35.(b) Find ζ2 as given (9.56). Plot ζ2 versus t0.(c) What is the best choice for t0 such that the error probability is
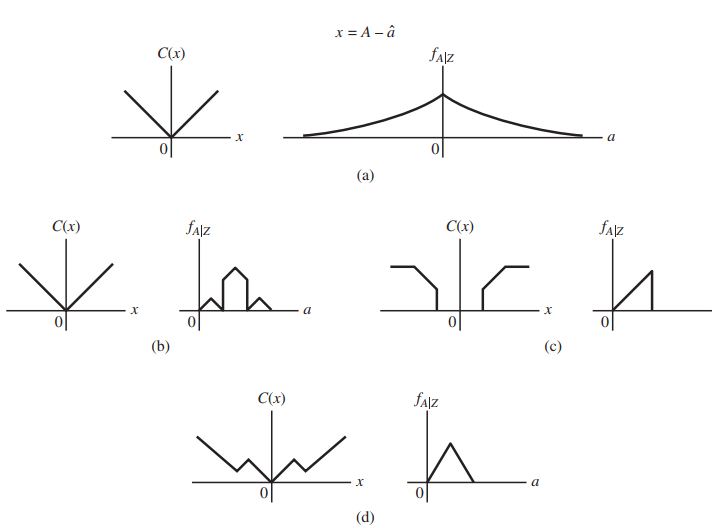
Find the peak-signal-squared-to-mean-squared noise ratio for the output of a matched filter for each of the following signals in terms of A and T. Take the noise spectral density (single-sided) as N0. Sketch each signal.(a)(b)(c)(d)The signals II(t) and Λ(t) are the unit-rectangular and
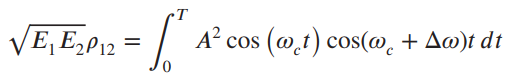
Given these signals:Assume that they are used in a binary digital data transmission system in the following combinations. Express B and C in terms of A so that their energies are the same. Sketch each one and in each case, calculate R12 in (9.16) in terms of A and T. Write down an expression for PE
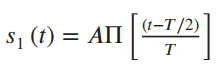
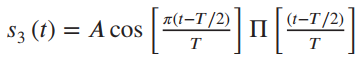
Given the three signals(a) Sketch each one and show that each has energy of A2T.(b) Show that R12, = 0 for each of the combinations (A, B), (B, C), and (A, C). What is the optimum threshold for each of these signaling combinations?(c) What is PE for each of the signaling combinations (A, B), (B,
A channel of bandwidth 10 kHz with single-sided noise power spectral density 10-7 W/Hz is available. A data rate through it of at least 4 kbps is desired at a PE ≤ 10-6. Design at least two data transmission systems that will achieve this data rate but don’t require acquisition of a
Plot the results for PEgiven in Table 9.2 versus z = Eb / N0in decibels with PEplotted on a semilog axis. Estimate the additional Eb / N0at PE= 10-5in decibels over the case for no phase error. Compare these results with that for constant phase error, as given by (9.81), of the same
Find z = Eb / N0 required to give PE = 10-5 for the following coherent digital modulation techniques:(a) binary ASK;(b) BPSK;(c) binary FSK;(d) BPSK with no carrier component but with a phase error of 5 degrees in the demodulator;(e) PSK with no phase error in demodulation, but with m = 1 /
An NFSK receiver must be designed with additional bandwidth for the input filters to accommodate frequency uncertainty of the received signal (due to Doppler shift, for example). (a) Justify that the resultant probability of error with frequency uncertainty is (b) Plot PE,
A binary PSK-modulated signal with carrier component was written in Section 9.2.8 asSPSK (t) = A sin [ωct + cos-1 m d (t) + θ]where 0 ‰¤ m ‰¤ 1 is the modulation index and d(t) is the data. It was expended as The first term is an unmodulated
Derive an expression for PEfor binary coherent FSK if the frequency separation of the two transmitted signals is chosen to give a minimum correlation coefficient between the two signals. That is, evaluate as a function of Δω and find the minimum value for R12. How much
Deferentially encode the following binary sequences. Arbitrarily choose a 1 as the reference bit to begin the encoding process. (a) 111 110 001 100 (b) 101 011 101 011(c) 111 111 111 111 (d) 000 000 000 000(e) 111 111 000 000 (f) 110 111 101 001(g) 101 010 101 010 (h) 101
(a) Consider the sequence 011 101 010 111. Deferentially encode it and assume that the deferentially encoded sequence is used to biphase modulate a sinusoidal carrier of arbitrary phase. Prove that the demodulator of Figure 9.17 properly gives back the original sequence.(b) Now invert the sequence
(a) In the analysis of the optimum detector for DPSK, show that the random variables n1, n2, n3, and n4 have zero means and variances N0T / 4.(b) Show that ω1,ω2,ω3, and ω4, have zero means and variances N0T / 8.
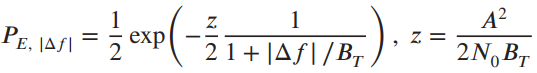
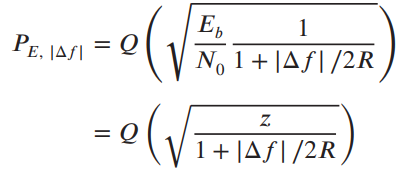
A delay-and-multiply receiver for DPSK as shown in Figure 9.17 should have an input filter bandwidth of B = 2/T = 2R Hz to achieve the asymptotic probability of error given by (9.113). If the received signal has a frequency error of Δf (due to Doppler shift, for example), the input
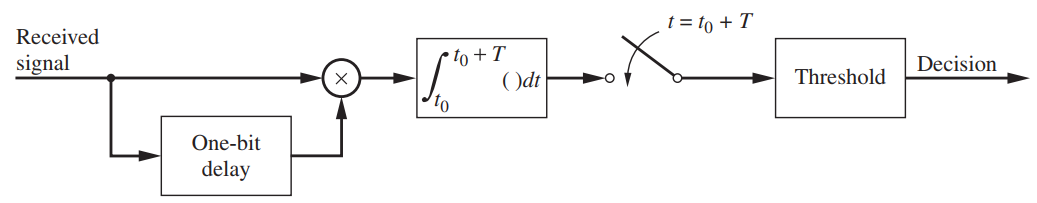
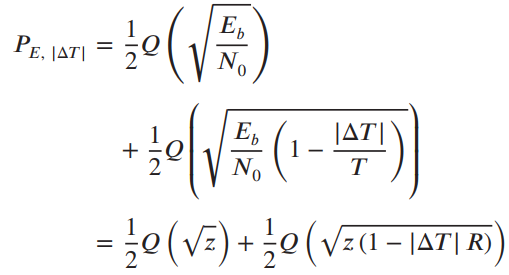
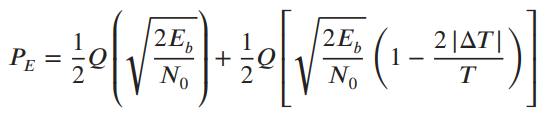
Assume that the delay in a delay-and-multiply receiver for DPSK as shown in Fig. 9.17 is in error by |ΔT|. (a) Show that the asymptotic bit error probability becomes (Consider the possible data sequences 11, 00, 10, and 01 thereby accounting for the cases of degradation and no
A channel of bandwidth 100 kHz is available. Using null-to-null RF bandwidths, what data rates may be supported by:(a) BPSK;(b) coherent FSK (tone spacing = 1 ∕ 2T);(c) DPSK;(d) non-coherent FSK (tone spacing = 2 ∕ T).
An M-ary communication system transmits at a rate of 2000 symbols per second. What is the equivalent bit rate in bits per second for M = 4? M = 8? M = 16? M = 32? M = 64? Show a plot of bit rate versus log2 M.
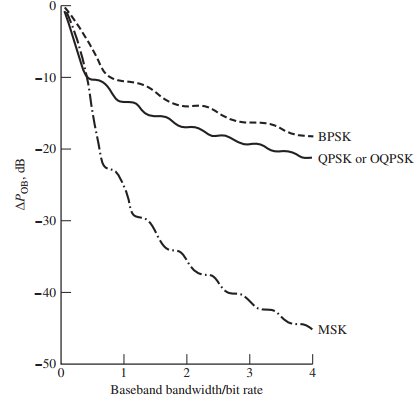
Use MATLAB to plot out-of-band power for M-ary PSK, QPSK (or OQPSK), and MSK. Compare with Figure 10.16. Use trapz to do the required numerical integration.Figure 10.16 -10 BPSK -20 QPSK or OQPSK -30 -40 MSK -50 2 4 Baseband bandwidth/bit rate APOR, dB «Яо
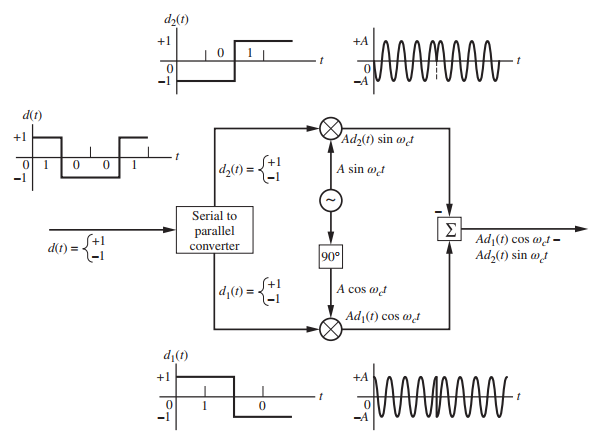
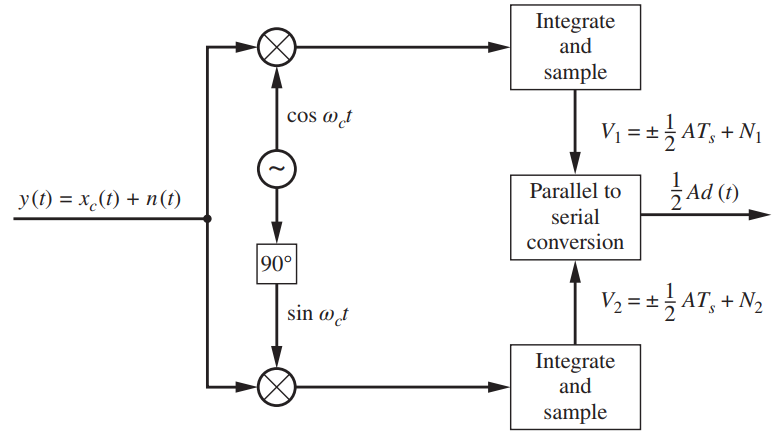
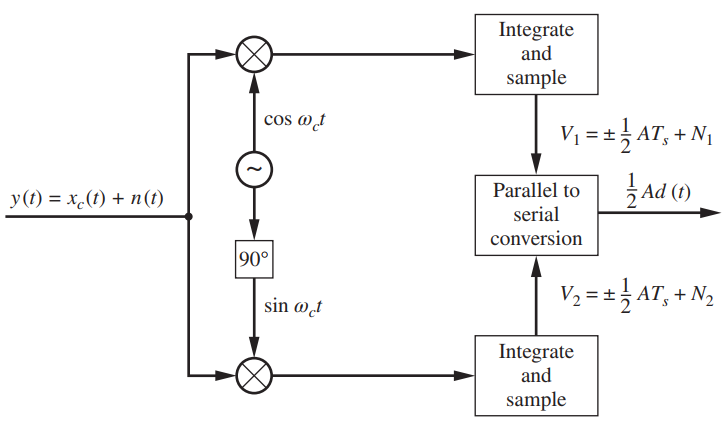
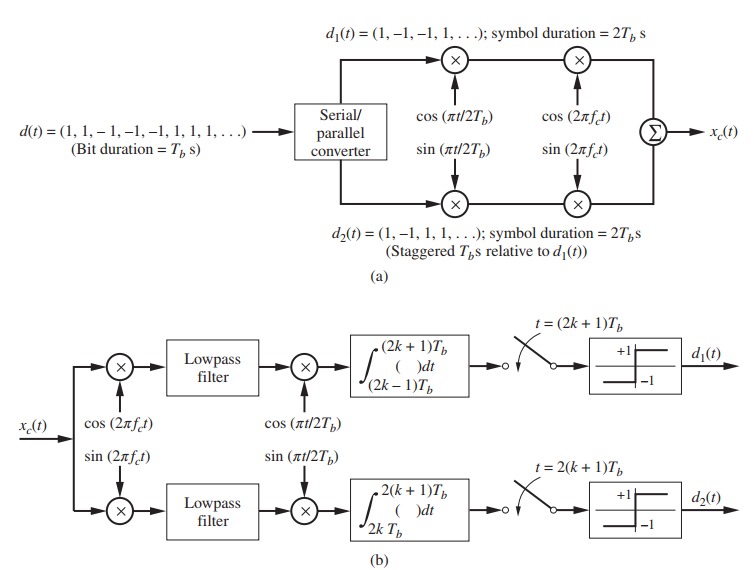
A serial bit stream, proceeding at a rate of 10 kbps from a source, is given as110110 010111 011011 (spacing for clarity)Number the bits from left to right starting with 1 and going through 18 for the right-most bit. Associate the odd indexed bits with d1 (t) and the even-indexed bits with d2 (t)
QPSK is used to transmit data through a channel that adds Gaussian noise with power spectral density N0 = 10-11 V2 / Hz. What are the values of the quadrature modulated carrier amplitudes required to give PE, symbol = 10-4 for the following data rates?(a) 5 kbps(b) 10 kbps(c) 50
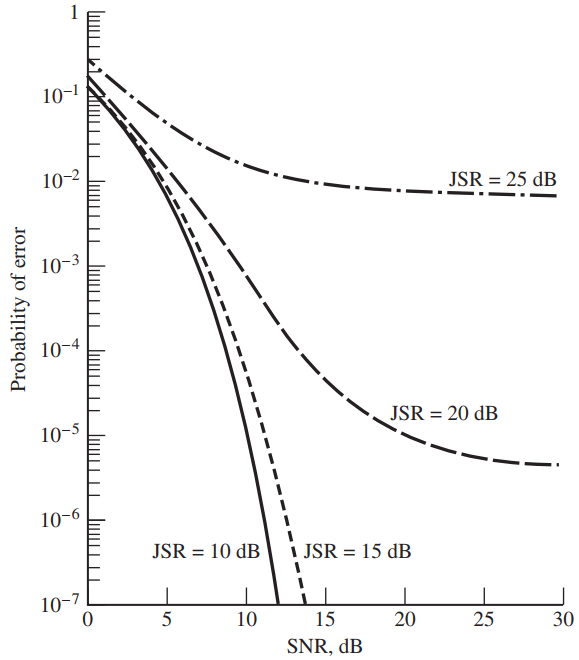
Use MATLAB to plot curves like those shown in Figure 10.25. Use fzero in MATLAB to find the processing gain required to give a desired probability of bit error for a given JSR and SNR. Note that your program should check to see if the desired bit error probability is possible for the given JSR and
Write a MATLAB simulation of GMSK that will simulate the modulated waveform. From this, compute and plot the power spectral density of the modulated waveform. Include the special case of ordinary MSK in your simulation so that you can compare the spectra of GMSK and MSK for several BTB products. Do
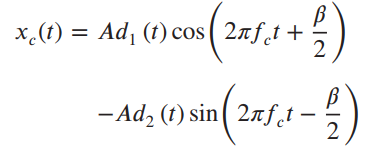
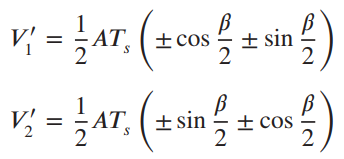
A QPSK modulator produces a phase-imbalanced signal of the form(a) Show that the integrator outputs of Figure 10.2, instead of (10.5) and (10.7), are now given bywhere the ± signs depend on whether the data bits d1 (t) and d2 (t) are + 1 or -1.Figure 10.2(b) Show that the probability of
Write a MATLAB simulation for an Alamouti type of MISO diversity system.
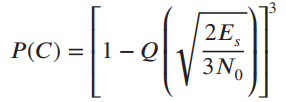
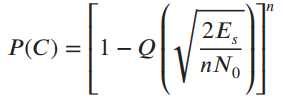
(a) A BPSK system and a QPSK system are designed to transmit at equal rates; that is, two bits are transmitted with the BPSK system for each symbol (phase) in the QPSK system. Compare their symbol error probabilities versus Es / N0 (note that Es for the BPSK system is 2Eb).(b) A BPSK system and a
Given the serial data sequence101011 010010 100110 110011associate every other bit with the upper and lower data streams of the block diagrams of Figures 10.2 and 10.4. Draw on the same time scale (one below the other) the quadrature wave forms for the following data modulation schemes: QPSK,
Sketch excess phase tree and phase trellis diagrams for each of the cases of Problem 10.7. Show as a heavy line the actual path through the tree and trellis diagrams represented by the data sequence given.Data From Problem 7Given the serial data sequence101011 010010 100110 110011associate every
Derive Equation (10.25) for the spectrum of an MSK signal by multiplying |G(f)|2, given by (10.23), times SBPSK (f), given by (10.24). That is, show that serial modulation of MSK works from the standpoint of spectral arguments. (Work only with the positive-frequency portions of (10.23) and (10.24)
An MSK system has a carrier frequency of 10 MHz and transmits data at a rate of 50 kbps.(a) For the data sequence 1010101010 …, what is the instantaneous frequency?(b) For the data sequence 0000000000 …, what is the instantaneous frequency?
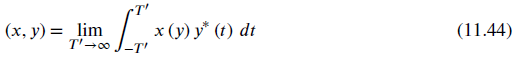
Show that the scalar-product definitions given by (11.44) and (11.45) satisfy the properties listed in the subsection entitled €˜€˜Scalar Product€™€™ in Section 10.2. x (y) y* (t) dt (х, у) — lim (11.44) T'→∞
Determine the quantizing levels, in terms of σ, so that the entropy at the output of a quantizer is maximized. Assume that there are six quantizing levels and that the input to the quantizer is a zero-mean Gaussian process.
Repeat the preceding problem assuming that the input to the quantizer has the Rayleigh probability density function Data From Problem 12.11The input to a quantizer is a random signal having an amplitude probability density function The signal is to be quantized using four quantizing
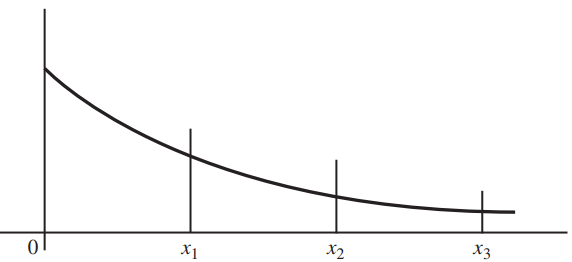
The input to a quantizer is a random signal having an amplitude probability density function The signal is to be quantized using four quantizing levels xi as shown in Figure 12.44. Determine the values xi, i = 1, 2, 3, in terms of α so that the entropy at the quantizer output is
From the entropy definitions given in (12.25) through (12.29), derive (12.30) and (12.31).
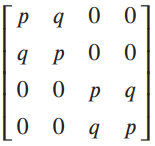
Determine the capacity of the channel described by the channel matrix shown below. Sketch your result as a function of p and give an intuitive argument that supports your sketch. (Note: q = 1 - p.). Generalize to N parallel binary symmetric channels. я р
A binary symmetric channel with error probability p1 is followed by an erasure channel with erasure probability p2. Describe the channel matrix that results from this cascade combination of channels. Comment on the results.
In Computer Example 12.7, a runstream of W and B symbols was generated. Develop a MATLAB program to develop the run-length code.
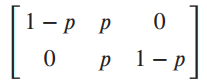
A channel has two inputs, (0, 1), and three outputs, (0, e,1), where e indicates an erasure; that is, there is no output for the corresponding input. The channel matrix is Compute the channel capacity. 1-p P 0 p 1-p
Repeat Computer Example 12.6 for y = 0.1 and y = 0.3 and y = 0.4 What do you conclude from these results combined with the results of Computer Example 12.6, which were generated for y = 0.2?
A binary symmetric channel has an error probability of 0.007. How many of these channels can be cascaded before the overall error probability exceeds 0.02?
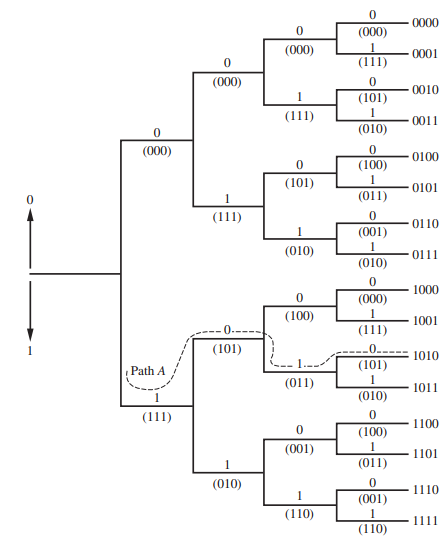
Develop a MATLAB program for generating the tree diagram illustrated in Figure 12.25. 0000 (000) (000) 0001 (111) (000) 0010 (101) (111) 0011 (010) (000) 0100 (100) (101) 0101 (011) (111) 0110 (001) (010) 0111 (010) 1000 (000) (100) 1001 (111) (101) .0- 1010 (101) Path A (011) 1011 (010) (111) 1100
In implementing the Tomen technique for comparing codes on the basis of information bit error probability, the MATLAB function nchoosek was used. Using this function for large values of n and k can give rise to numerical precision difficulties that result from the factorial function. In order to
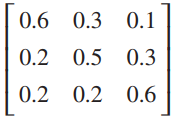
A channel has the following transition matrix:(a) Sketch the channel diagram showing all transition probabilities.(b) Determine the channel output probabilities assuming that the input probabilities are equal.(c) Determine the channel input probabilities that result in equally likely
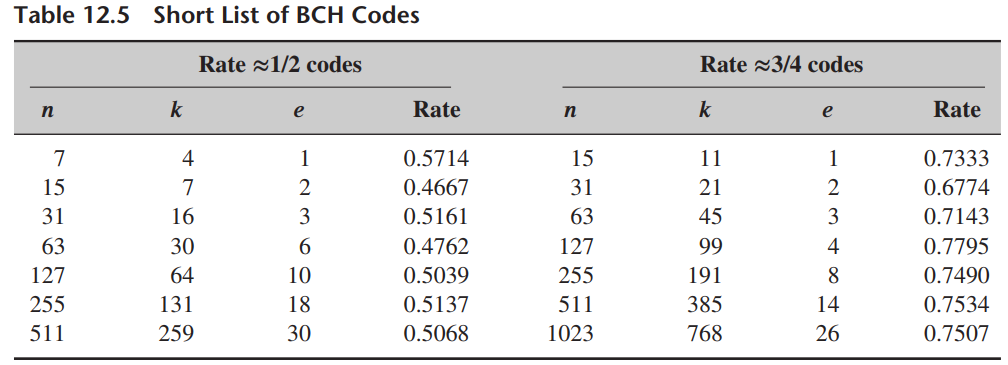
Table 12.5 gives a short list of rate 1/2 and rate 3/4 BCH codes. Using the Torrieri bound and an appropriate MATLAB program, plot together on a single set of axes the bit error probability for the rate 1/2 BCH codes having block length n = 7, 15, 31, and 63. Assume PSK modulation with
A source consists of six outputs denoted [A, B, C, D, E, F] with respective probabilities [0.30, 0.25, 0.20, 0.1, 0.1, 0.05]. Determine the entropy of the source.
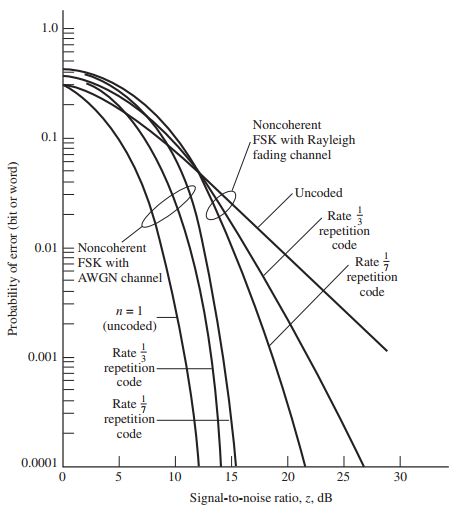
Computer Example 12.2 did not contain the MATLAB program used to generate Figure 12.18. Develop a MATLAB program for generating Figure 12.18, and use your program to verify the correctness of Figure 12.18. 1.0 Noncoherent 0.1 FSK with Rayleigh fading channel Uncoded Rate repetition code :
A source has five outputs denoted [m1, m2, m3, m4, m5] with respective probabilities [0.30, 0.25, 0.20, 0.15, 0.10]. Determine the entropy of the source. What is the maximum entropy of a source with five outputs?
Develop a MATLAB program that generates the Huffman source code for an input random binary bit stream of arbitrary length.
Assume that you have a standard deck of 52 cards (jokers have been removed).(a) What is the information associated with the drawing of a single card from the deck?(b) What is the information associated with the drawing of a pair of cards, assuming that the first card drawn is replaced in the
Develop a computer program that allows you to plot the entropy of a source with variable output probabilities. We wish to observe that the maximum source entropy does indeed occur when the source outputs are equally likely. Start with a simple two-output source [m1,m2] with respective probabilities
A binary three-hop communication system has transition probabilities αi, βi, and γi (i = 1,2,3,4). Determine the transition probabilities for the overall three-hop system. Solve this problem two different ways. First, trace all possible paths from the input to the output and compute the
Given that the impulse response of an ideal integrator over T seconds is h(t) = 1/T [u (t) - u (t - T)] where u(T) is the unit-step function, show that its equivalent noise bandwidth is BN,idealint = 1 / 2T hertz. You may apply (7.108) using the expression for h(t) directly or find the frequency
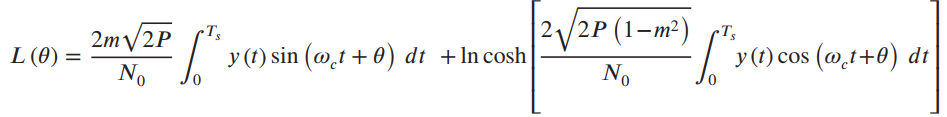
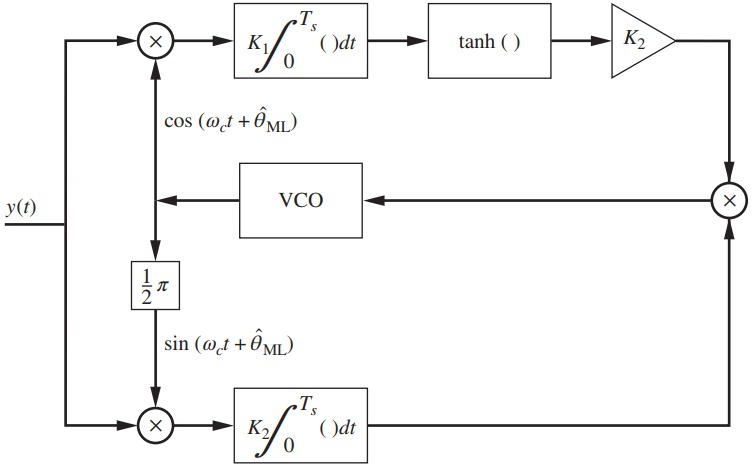
Assume a biphase modulated signal in white Gaussian noise of the form y(t) = ˆš2P sin (ωct ± cos-1 m + θ) + n(t), 0 ‰¤ t ‰¤ Ts where the ± signs are equally probable and θ is to be estimated by a
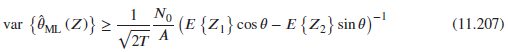
Generalize the estimation of a sample of a PAM signal, expressed by (11.207), to the case where the sample value m0is a zero-mean Gaussian random variable with variance σ2m. 1 No -° (E {Z}} cos 0 – E{Z2} sin 0)¯ VZT {OML (Z)} > · (11.207) (Z)} > var
Given K independent measurements (Z1, Z2,.....,ZK) of a noise voltage Z(t) at the RF filter output of a receiver: (a) If Z(t) is Gaussian with mean zero and var {σ2n}, what is the ML estimate of the noise variance?(b) Calculate the expected value and variance of this estimate as functions of
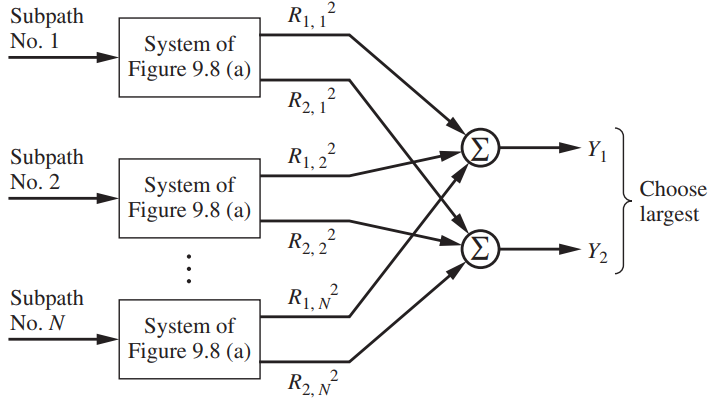
For which of the cost functions and posterior pdfs shown in Figure 11.14 will the conditional mean be the Bayes estimate? Tell why or why not in each case. х 3DА-ӑ Cх) fAlZ х (a) C(x) fAlZ fAZ Iom. C(x) х х (b) (c) falZ С(х) х (d)
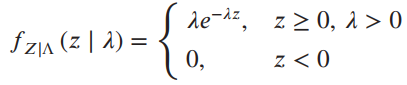
Let an observed random variable Z depend on a parameter λ according to the conditional pdf The α priori pdf of λ iswhere β and m are parameters and Γ(m) is the gamma function. Assume that m is a positive integer. (a)
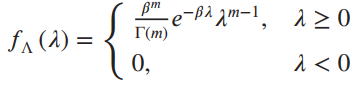
Investigate the use of diversity to improve the performance of binary non-coherent FSK signaling over the flat-fading Rayleigh channel. Assume that the signal energy Esis divided equally among N sub paths, all of which fade independently. For equal SNRs in all paths, the optimum receiver is shown
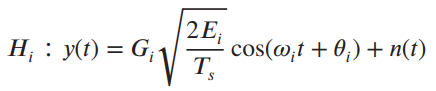
Generalize the fading problem of binary non-coherent FSK signaling to the M-ary case. Let the ith hypothesis be of the formi = 1, 2,......., M; 0 ‰¤ t ‰¤ Tswhere Gi is Rayleigh, θi is uniform in (0, 2Ï€), Ei is the energy of the unperturbed
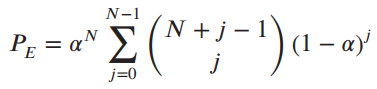
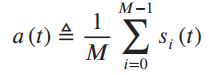
This problem develops the simplex signaling set.13Consider M orthogonal signals, si(t), i = 0, 1, 2,...., M - 1 each with energy Es. Compute the average of the signals and define a new signal sets'i (t) = si (t) - a (t), i = 0, 1, 2,......, M - 1(a) Show that the energy of each signal in the
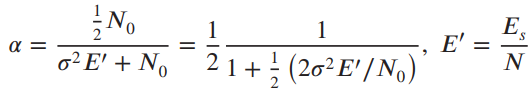
Go through the steps in deriving (11.144). LI SR, (r:|H1,) dr SR, (ri ,) dr |P (E\H¡) = 1 1+; (20²E/No) 8. I|
(a) Referring to the signal set defined by (11.98), show that the minimum possible Δf = Δω / 2π such that (si, sj) = 0 is Δf = 1/(2Ts).(b) Using the result of part (a), show that for a given time-bandwidth product WTs the maximum number of signals for M-ary FSK signaling is given by M = 2WTs,
Consider vertices-of-a-hyper-cube signaling, for which the in which the coefficients αik are permuted through the values +1 and -1, Es is the signal energy, and the ϕksare orthonormal. Thus, M = 2n, where n = log2 M is an integer. For M = 8, n = 3, the signal
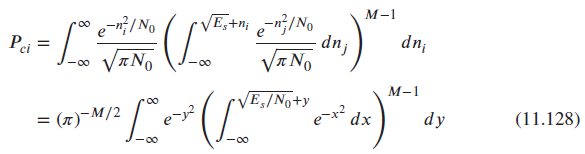
Consider (11.128) for M = 2. Express PE as a single Q-function. Show that the result is identical to binary, coherent FSK. VE,+n n;/No e-n;/No Pei - dp, VANO dn; νTNο -00 -00 M-1 E,/No+y dy (11.128) e-x* dx = (x)-M/2 e-? -00
For M-ary PSK, the transmitted signal is of the form si (t) = A cos(2πt + iπ / 2), i = 0, 1, 2, 3, for 0 ≤ t ≤ 1si (t) = A cos[4πt + (i - 4)π / 2], i = 4, 5, 6, 7, for 0 ≤ t ≤ 1(a) Find a set of basis functions for this signaling scheme. What is the dimension of the signal space?
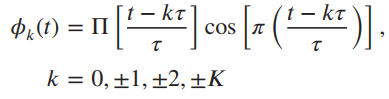
Rework Example 11.6 for half-cosine pulses given by – kt Pr(t) = II [t – kt (t – kt cos |T т k = 0,±1,±2,±K
Use the Gram--Schmidt procedure to find an orthonormal basis for the signal set given below. Express each signal in terms of the orthonormal basis set found.s1(t) = 1, 0 ≤ t ≤ 2s2 (t) = cos (πt), 0 ≤ t ≤ 2s3 (t) = sin (πt), 0 ≤ t ≤ 2s4 (t) = sin2 (πt), 0 ≤ t ≤ 2
(a) Find a set of orthonormal basis functions for the signals given below which are defined on the interval -1 ≤ t ≤ 1:x1 (t) = t x2 (t) = t2 x3 (t) = t3 x4 (t) = t4 (b) Attempt to provide a general result for xn(t) = tn, -1 ≤ t ≤ 1.
(a) Using the Gram--Schmidt procedure, find an orthonormal basis set corresponding to the signalsx1 (t) = exp (-t) u(t)x2 (t) = exp (-2t) u (t)x3 (t) = exp (-3t) u (t)(b) See if you can find a general formula for the basis set for the signal set x1(t) = exp (-t) u(t),......, xn (t) = exp (-nt) u(t)
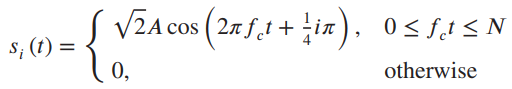
Consider the set of signalswhere N is an integer and i = 0,1,2,3,4,5,6,7.(a) Find an orthonormal basis set for the space spanned by this set of signals.(b) Draw a set of coordinate axes, and plot the locations of si (t), i = 1, 2,.....,8, after expressing each one as a generalized Fourier series in
Use the Gram--Schmidt procedure to find a set of orthonormal basis vectors corresponding the the vector space spanned by the vectors x1 = 3î + 2ĵ – k, x, = -2î + 5f +k, x3 = 6î – 2ĵ + Tk, and x4 = 3î + 8ĵ – 3R.
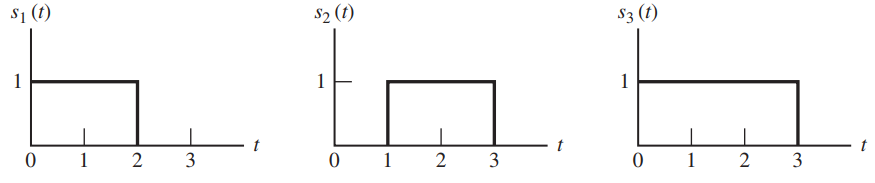
(a) Use the Gram--Schmidt procedure to find a set of orthonormal basis functions corresponding to the signals given in Figure 11.12.(b) Express s1, s2, and s3 in terms of the orthonormal basis set found in part (a).Figure 11.12 S1 (t) $3 (t) S2 (t) 1 1 3 3 3 2 3. 3. 2.
Verify Schwarz’s inequality for the 3-space vectors of Problem 11.6.Data From Problem 11.6For the following vectors in 3-space with x, y, z components as given, evaluate their magnitudes and the cosine of the angle between them (î, ĵ, and k̂ are the orthogonal unit vectors along the x, y, and
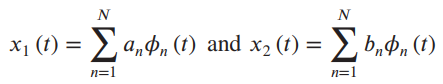
Verify Schwarz€™s inequality forwhere the Ï•n(t)s are orthonormal and the ans and bns are constants. N x1 (t) = Ea,ø, (t) and x, (1) = b,4, (1) n=1 n=1
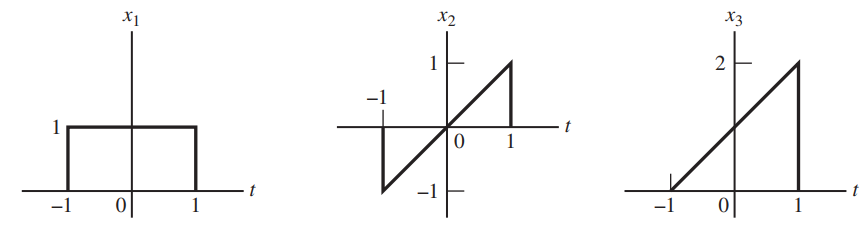
Evaluate||x1||,||x2||,||x3||, (x2, x1), and (x3, x1) for the signals in Figure 11.11. Use these numbers to construct a vector diagram and graphically verify that x3= x1+ x2.Figure 11.11 X1 Хз X2 -1 -1 -1 0| 2.
Let x1(t) and x2(t) be two real-valued signals. Show that the square of the norm of the signal x1(t) + x2(t) is the sum of the square of the norm of x1(t) and the square of the norm of x2(t), if and only if x1(t) and x2(t) are orthogonal; that is, ||x1 + x2||2 = ||x1||2 + ||x2||2 if and only if
Using the appropriate definition, (11.44) or (11.45), calculate (x1,x2) for each of the following pairs of signals:(a) e-ItI, 2e-3tu(t)(b) e-(4+j3)t u(t), 2e-(3+j5)t u(t)(e) cos 2πt, cos 4πt(d) cos 2πt, 5u(t)
For the following vectors in 3-space with x, y, z components as given, evaluate their magnitudes and the cosine of the angle between them (î, ĵ, and k̂ are the orthogonal unit vectors along the x, y, and z axes, respectively):(a) A = î + 3ĵ + 2k̂; B = 5î + ĵ + 3k̂;(b) A = 6î + 2j
Show that ordinary three-dimensional vector space satisfies the properties listed in the subsection entitled ‘‘Structure of Signal Space’’ in Section 11.2, where x(t) and y (t) are replaced by vectors A and B.
Referring to Problem 10.3, find general expressions for the probabilities of false alarm and detection for each case. Assume that c12 = 1 in all cases. Numerically evaluate them for the cases where σ2n = 9 and σ2s = 16. Evaluate the risk.Data From Problem 10.3Assume that data of the form Z =
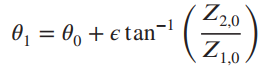
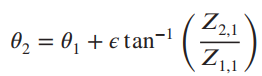
Write a computer simulation of the PLL estimation problem. Do this by generating two independent Gaussian random variables to form Z1 and Z2 given by (11.196). Thus, for a given (11.201). Call the first value θ0. Estimate the next value of θ, call it
Showing 200 - 300
of 1112
1
2
3
4
5
6
7
8
9
10
11
12
Step by Step Answers
![(1–T/2) $2 (1) = ]}=4 1+ cos 2 2a(1–T/2) т](https://dsd5zvtm8ll6.cloudfront.net/si.question.images/images/question_images/1537/8/7/7/0145baa2416c4f3f1537859390674.jpg)
![[(( — т/2) н0] SA(1) 3D АП 꾸의피의 ауe) (t – T /2)] П л (1 — Т/2) Sв (1) 3 Всos т мо-9( (t –](https://dsd5zvtm8ll6.cloudfront.net/si.question.images/images/question_images/1537/8/7/7/2925baa252cb47d31537859668563.jpg)
![[(t – T /2)] SĄ(t) = AII 2 (t – 3T /4)] AII 2 (t – T /4) AII SB(t)](https://dsd5zvtm8ll6.cloudfront.net/si.question.images/images/question_images/1537/8/7/8/5655baa2a256e3171537860940654.jpg)
![[4 (t – T /8) 4 (t – 3T /8)] АП Sc(t) = AII [4 (t – 5T /8)] 4 (t – 7T /8)] АП +AI](https://dsd5zvtm8ll6.cloudfront.net/si.question.images/images/question_images/1537/8/7/8/5785baa2a32843271537860954377.jpg)