New Semester
Started
Get
50% OFF
Study Help!
--h --m --s
Claim Now
Question Answers
Textbooks
Find textbooks, questions and answers
Oops, something went wrong!
Change your search query and then try again
S
Books
FREE
Study Help
Expert Questions
Accounting
General Management
Mathematics
Finance
Organizational Behaviour
Law
Physics
Operating System
Management Leadership
Sociology
Programming
Marketing
Database
Computer Network
Economics
Textbooks Solutions
Accounting
Managerial Accounting
Management Leadership
Cost Accounting
Statistics
Business Law
Corporate Finance
Finance
Economics
Auditing
Tutors
Online Tutors
Find a Tutor
Hire a Tutor
Become a Tutor
AI Tutor
AI Study Planner
NEW
Sell Books
Search
Search
Sign In
Register
study help
physics
principles communications systems
Principles of Communications Systems, Modulation and Noise 7th edition Rodger E. Ziemer, William H. Tranter - Solutions
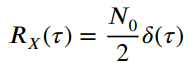
Two random processes are given byX (t) = n (t) + A cos(2πf0t + θ)andY (t) = n (t) + A sin(2πf0t + θ)Where A and f0 are constants and θ is a random variable uniformly distributed in the interval [-π, π). The first term, n (t), represents a stationary random noise process with auto correlation
Given two independent, wide-sense stationary random processes X(t) and Y(t) with auto correlation functions Rx(τ) and RY(τ), respectively.(a) Show that the auto correlation function RZ(τ) of their product Z(t) = X(t) Y(t) is given byRz(τ) = Rx(τ)RY(τ)(b) Express the power spectral density of
A random signal has the auto correlation functionR(τ) = 9 + 3Λ (τ/5) where Λ(x) is the unit-area triangular function defined in Chapter 2. Determine the following:(a) The ac power.(b) The dc power.(c) The total power.(d) The power spectral density. Sketch it and label
A random process is defined as Y(t) = X (t) + X(t - T), where X (t) is a wide-sense stationary random process with auto correlation function RX(T) and power spectral density Sx (f).(a) Show that RY(τ) = 2RX(τ) + RX(τ + T) + RX(τ - T).(b) Show that SY(f) = 4SX (f) cos2(πfT).(c) If X (t) has
The power spectral density of a wide-sense stationary random process is given by SX (f) = 10δ(f) + 25sinc2(5f) + 5δ (f - 10) + 5δ (f + 10)(a) Sketch and fully dimension this power spectral density function.(b) Find the power in the dc component of the random process.(c) Find the
Given the following functions of τ:Rx1(τ) = 4 exp(-α|τ|) cos 2πτRx2(τ) = 2 exp(-α|τ|) + 4 cos 2πbτRx3 (f) = 5 exp(-4τ2)(a) Sketch each function and fully dimension.(b) Find the Fourier transforms of each and sketch. With the information of part (a) and the Fourier transforms justify
A stationary random process n(t) has a power spectral density of 10-6 W/Hz, -∞ < f < ∞. It is passed through an ideal low pass filter with frequency response function H(f) = II (f / 500 kHz), where II(x) is the unit-area pulse function defined in Chapter 2.(a) Find and sketch the
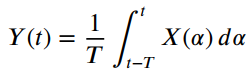
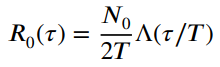
An ideal finite-time integrator is characterized by the input-output relationship(a) Justify that its impulse response is h(t) = 1 / T [u (t) - u (t - T)].(b) Obtain its frequency response function. Sketch it.(c) The input is white noise with two-sided power spectral density N0/2. Find
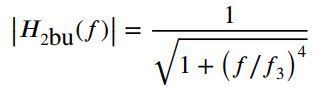
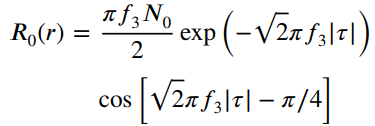
White noise with two-sided power spectral density N0/2 drives a second-order Butter worth filter with frequency response function magnitude
A power spectral density given bySY(f) = f2 / f4 + 100is desired. A white-noise source of two-sided power spectral density 1 W/Hz is available. What is the frequency response function of the filter to be placed at the noise-source output to produce the desired power spectral density?
Obtain the auto correlation functions and power spectral densities of the outputs of the following systems with the input auto correlation functions or power spectral densities given.(a) Transfer function: H(f) = II(f / 2B)Auto correlation function of input:N0 and B are positive
The input to a low pass filter with impulse responseh(t) = exp (-10t) u(t) is white, Gaussian noise with single-sided power spectral density of 2 W/Hz. Obtain the following:(a) The mean of the output.(b) The power spectral density of the output.(c) The auto correlation function
A second-order Butter worth filter has 3-dB bandwidth of 500 Hz. Determine the unit impulse response of the filter and use it to compute the noise-equivalent bandwidth of the filter. Check your result against the appropriate special case of Example 7.9.
Determine the noise-equivalent bandwidths for the four filters having transfer functions given below:(a) Ha (f) = II(f/4) + II(f/2)(b) Hb (f) = 2Λ(f/50)(c) Hc (f) = 10 / 10 + j2πf(d) Hd (f) = II(f/10) + Λ(f/5)
A filter has frequency response functionH(f) = H0 (f - 500) + H0(f + 500) where H0(f) = 2Λ(f / 100)Find the noise-equivalent bandwidth of the filter.
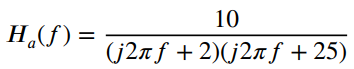
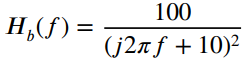
Determine the noise-equivalent bandwidths of the systems having the following transfer functions. Use the time-domain approach.(a) (b) 10 H.(f) = (j2nf +2)(j2nf +25) 100 H,(f) = (j2nf + 10)²
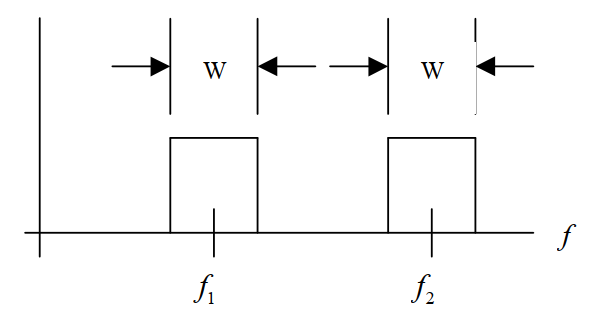
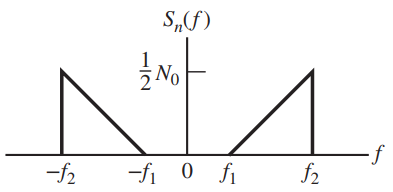
Noise n (t) has the power spectral density shown in Figure 7.16. We writen(t) = nc (t) cos (2πf0t + θ) - ns (t) sin(2πf0t + θ)Make plots of the power spectral densities of nc(t) and ns (t) for the following cases:(a) f0 = f1(b) f0 = f2 (c) f0 =
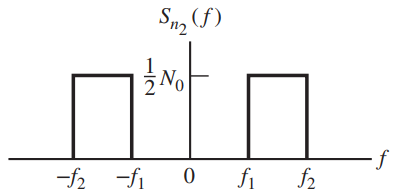
The double-sided power spectral density of noise n (t) is shown in Figure 7.17. If n (t) = nc(t) cos(2πf0t + θ) - ns(t) sin(2πf0t + θ), find and plot Snc, (f), Sns(f), and Sncns(f) for the following cases: (a) f0 = 1/2(f1 + f2)(b) f0 = f1(c) f0 =
A circle is divided into 21 equal parts. A pointer is spun until it stops on one of the parts, which are numbered from 1 through 21. Describe the sample space and, assuming equally likely outcomes, find(a) P(an even number); (b) P(the number 21); (c) P(the number 4,5 or 9); (d) P(a
Referring to (5.69) and using the fact that d (t) = ± 1 in T -second intervals, find the value of kf such that the peak frequency deviation of XFSK (t) is 10,000 Hz if the bit rate is 1000 bits per second.
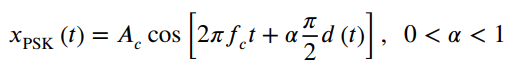
Referring to (5.68), it is sometimes desirable to leave a residual carrier component in a PSK-modulated waveform for carrier synchronization purposes at the receiver. Thus, instead of (5.68), we would have Find α so that 10% of the power of xPSK (t) is in the carrier
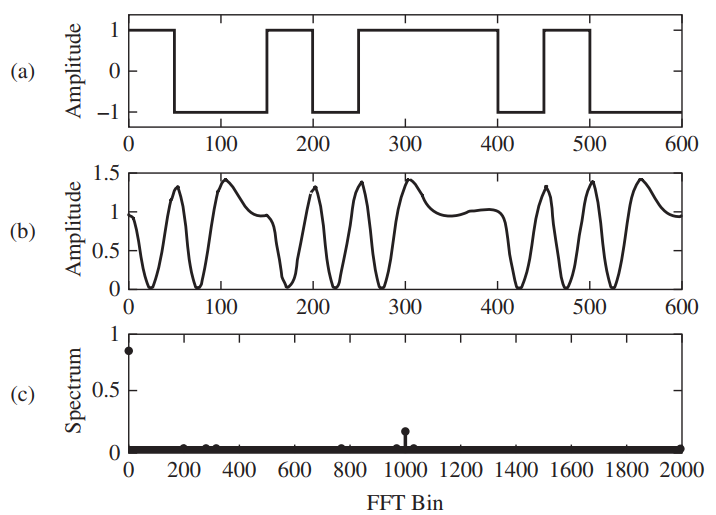
Assume that the bit period of Example 5.8 is T = 1 second. That means that the sampling rate is fs= 10 sps because nsamp = 10 in the program. Assuming that a NFFT= 5000 point FFT was used to produce Figure 5.16 and that the 5000th point corresponds to fsjustify that the FFT output at bin 1000
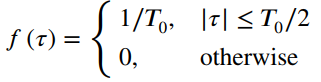
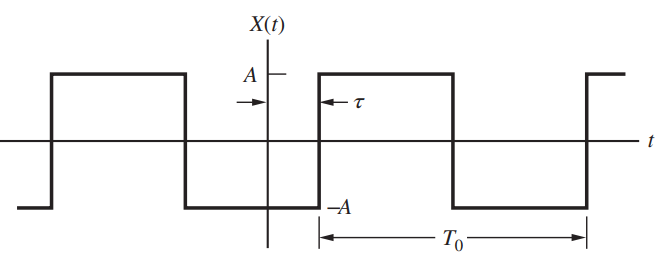
A random process is composed of sample functions that are square waves, each with constant amplitude T0, and random delay Ï„ as sketched in Figure 7.15. The pdf of Ï„ is Figure 7.15(a) Sketch several typical sample functions.(b) Write the first-order pdf for this
Referring to Problem 7.1, what are the following probabilities for each case?(a)FX(X ‰¤ 2A,t = 4)(b)FX(X ‰¤ 0,t = 4)(c)FX(X ‰¤ 2A,t = 2)Data From Problem 7.1A fair die is thrown. Depending on the number of spots on the up face, the following random processes are
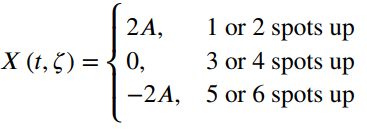
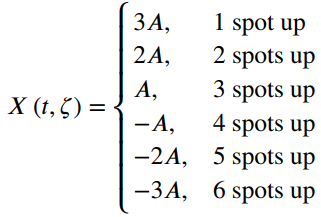
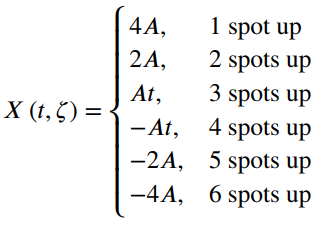
A fair die is thrown. Depending on the number of spots on the up face, the following random processes are generated. Sketch several examples of sample functions for each case.(a) (b) (c) 1 or 2 spots up 3 or 4 spots up 5 or 6 spots up 2A, X (t, 5) = { 0, -2A, 1 spot up 2 spots up ЗА,
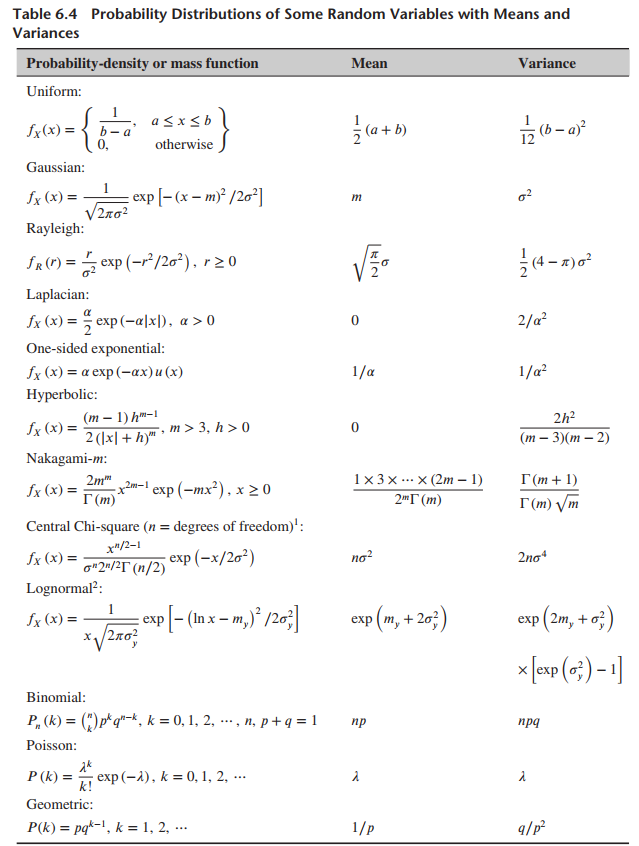
Find the probabilities of the following random variables, with pdfs as given in Table 6.4, exceeding their means. That is, in each case, find the probability that X ≥ mX, where X is the respective random variable and mX is its mean.(a) Uniform;(b) Rayleigh;(c) One-sided exponential.
Two Gaussian random variables, X and Y, are in dependent. Their respective means are 4 and 2, and their respective variances are 3 and 5.(a) Write down expressions for their marginal pdfs.(b) Write down an expression for their joint pdf.(c) What is the mean of Z1 = 3X + Y? Z2 = 3X - Y?(d) What is
Two Gaussian random variables, X and Y, are in dependent. Their respective means are 5 and 3, and their respective variances are 1 and 2.(a) Write down expressions for their marginal pdfs.(b) Write down an expression for their joint pdf.(c) What is the mean of Z1 = X + Y? Z2 = X - Y?(d) What is the
Two jointly Gaussian random variables, X and Y, have means of 1 and 2, and variances of 3 and 2, respectively. Their correlation coefficient is Pxy = 0.2. A new random variable is defined as Z = 3X + Y. Write down an expression for the pdf of Z.
Two jointly Gaussian zero-mean random variables, X and Y, have respective variances of 3 and 4 and correlation coefficient Pxy = -0.4. A new random variable is defined as Z = X + 2Y. Write down an expression for the pdf of Z.
Determine the cdf for a Gaussian random variable of mean m and variance σ2. Express in terms of the Q-function m = 0, σ = 0.5, 1, and 2.
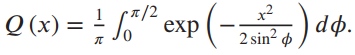
Prove that the Q-function may also be represented as S exp еxp (-т х2 dф. О() 3 2 sin? ф ф
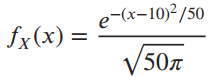
A random variable X has the probability-density functionExpress the following probabilities in terms of the Q-function and calculate numerical answers for each:(a) P(IXI ‰¤ 15);(b) P(10 < X ‰¤ 20);(c) P(5 < X ‰¤ 25);(d) P(20 < X ‰¤ 30).
(a) Prove Chebyshev ̓s inequality. Let Y = (X - mx) /σx and find a bound for P(IYI < k) in terms of k.(b) Let X be uniformly distributed over |x| ≤ 1. Plot P(IXI ≤ kσx) versus k and the corresponding bound given by Chebyshev ̓s inequality.
If the random variable X is Gaussian, with zero mean and variance σ2, obtain numerical values for the following probabilities:(a) P(IXI > σ);(b) P(IXI > 2σ);(c) P(IXI > 3σ).
Speech is sometimes idealized as having a Laplacian-amplitude pdf. That is, the amplitude is distributed according to fX(x) = (a/2) exp (-a|x|)(a) Express the variance of X, σ2, in terms of a. Show your derivation; don€™t just simply copy the result given in Table 6.4.(b)
Compare the Q-function and the approximation to it for large arguments given by (6.202) by plotting both expressions on a log-log graph. (Note: MATLAB is handy for this problem.)
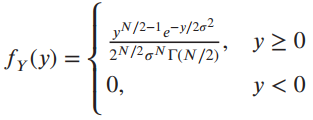
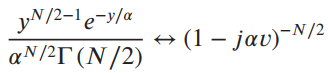
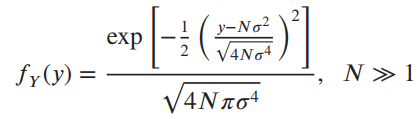
(Chi-squared pdf) Consider the random variable Y = ˆ‘N i = 1 where the Xi€™s are independent Gaussian random variables with pdfs n(0,σ).(a) Show that the characteristic function of X2i is MX2i (jv) = (1 - 2jvσ2)-1/2(b) Show that the pdf
Consider the Cauchy density functionfX(x) = K / 1 + x2 , -∞ ≤ x ≤ ∞(a) Find K.(b) Show that var {X} is not finite.(c) Show that the characteristic function of a Cauchy random variable is Mx(jv) = π Ke-|v|.(d) Now consider Z = X1 + ··· + XN where the Xi ’s are independent Cauchy random
Compare the binomial, Laplace, and Poisson distributions for(a) n = 3 and p = 1/5(b) n = 3 and p = 1/10(c) n = 10 and p = 1/5(d) n = 10 and p = 1/10
The random variable X has a probability-density function uniform in the range 0 ≤ x ≤ 2 and zero elsewhere. The independent variable Y has a density uniform in the range 1 ≤ y ≤ 5 and zero elsewhere. Find and plot the density of Z = X + Y.
An honest coin is flipped 10 times.(a) Determine the probability of the occurrence of either 5 or 6 heads.(b) Determine the probability of the first head occurring at toss number 5.(c) Repeat parts (a) and (b) for flipping 100 times and the probability of the occurrence of 50 to 60 heads
Passwords in a computer installation take the form X1, X2, X3, X4, where each character Xi is one of the 26 letters of the alphabet. Determine the maximum possible number of different passwords available for assignment for each of the two following conditions:(a) A given letter of the
Assume that 20 honest coins are tossed.(a) By applying the binomial distribution, find the probability that there will be fewer than 3 heads.(b) Do the same computation using the Laplace approximation.(c) Compare the results of parts (a) and (b) by computing the percent error of the Laplace
A digital data transmission system has an error probability of 10-5 per digit.(a) Find the probability of exactly 1 error in 105 digits. (b) Find the probability of exactly 2 errors in 105 digits.(c) Find the probability of more than 5 errors in 105 digits.
Assume that two random variables X and Y are jointly Gaussian with mx = my = 1, σ2x = σ2y = 4.(a) Making use of (6.194), write down an expression for the marginal pdfs of X and of Y.(b) Write down an expression for the conditional pdf f X | Y (x | y) by using the result of (a) and an expression
A random variable X is defined by fX(x) = 4e-8|x|The random variable Y is related to X by Y = 4 + 5X.(a) Determine E[X], E[X2], and σ2x.(b) Determine fY(y).(c) Determine E[Y], E[Y2], and σ2y. (The result of part (b) is not necessary to do this part, although it may be used.)
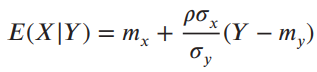
Using the definition of a conditional pdf given by Equation (6.62) and the expressions for the marginal and joint Gaussian pdfs, show that for two jointly Gaussian random variables X and Y, the conditional density function of X given Yhas the form of a Gaussian density with conditional mean and the
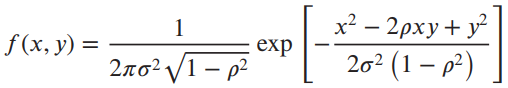
Two Gaussian random variables X and Y, with zero means and variances σ2, between which there is a correlation coefficient p, have a joint probability-density function given byThe marginal pdf of Y can be shown to be Find the conditional pdf fX|Y (X | Y). x² – 2pxy+ y f(x, y)
Two random variables X and Y have means and variances given below:mx = 1 σ2x = 4 my = 3 σ2y = 7A new random variable Z is defined as Z = 3X - 4YDetermine the mean and variance of Z for each of the following cases of correlation between the random variables X = Y:(a) PXY = 0(b)
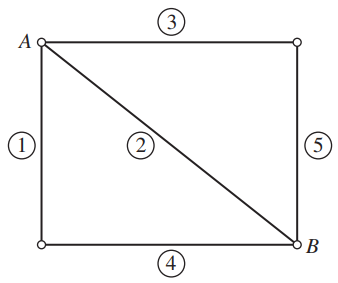
The random variable has pdfwhere u(x) is the unit step. Determine the mean and the variance of the random variable thus defined. fx(x) = ;5(x – 5) + lu(x – 4) – u(x – 8)]
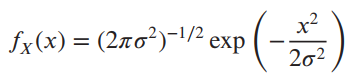
Ifshow that (a) E[X2n] = 1 · 3 · 5 ··· (2n - 1) σ2n, for n = 1,2,...(b) E[X2n-1] = 0 for n = 1,2,... fx(x) -(2π σ') exp 2σ2
A random variable X has the pdf fX(x) = Ae -bx [u(x) - u(x - B)]where u(x) is the unit step function and A, B, and b are positive constants.(a) Find the proper relationship between the constants A,b, and B. Express b in terms of A and B.(b) Determine and plot the cdf.(c) Compute E(X).(d)
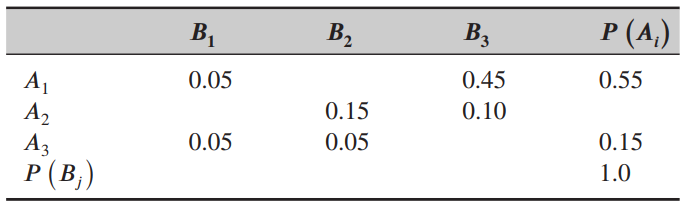
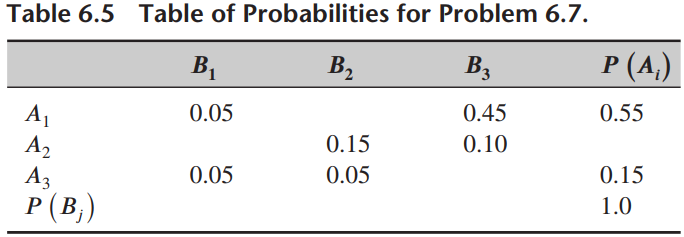
Verify the entries in Table 6.5 for the mean and variance of the following probability distributions:(a) Rayleigh;(b) One-sided exponential;(c) Hyperbolic;(d) Poisson;(e) Geometric.Table 6.5 P (A,) B, B, B3 0.05 A1 A2 A3 P (B,) 0.45 0.55 0.15 0.10 0.05 0.05 0.15 1.0
(a) Consider a random variable uniformly distributed between 0 and 2. Show that E(X2) > E2(X).(b) Consider a random variable uniformly distributed between 0 and 4. Show that E(X2) > E2(X).(c) Can you show in general that for any random variable it is true that E(X2) > E2(X) unless the
Let fX(x) = A exp (-bx) u(x - 2) for all x where A and b are positive constants.(a) Find the relationship between A and b such that this function is a pdf.(b) Calculate E(X) for this random variable.(c) Calculate E(X2) for this random variable.(d) What is the variance of this random variable?
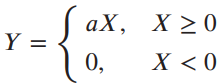
A nonlinear system has input X and output Y. The pdf for the input is Gaussian as given in Problem 6.16.Determine the pdf of the output, assuming that the nonlinear system has the following input/output relationship:(a) When X < 0, what is Y? How is this manifested in the pdf for Y?(b) Y =
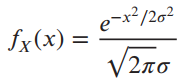
Given the Gaussian random variable with the pdfwhere σ > 0 is the standard deviation. If Y = X2, find the pdf of Y. Note that Y = X2 is symmetrical about X = 0 and that it is impossible for Y to be less than zero. e-x²/2o? fx(x) = V2πσ
(a) For what value of α > 0 is the function f(x) = αx-2u(x - α)a probability-density function? Use a sketch to illustrate your reasoning and recall that a pdf has to integrate to one. [u(x) is the unit step function.](b) Find the corresponding cumulative-distribution function.(c) Compute
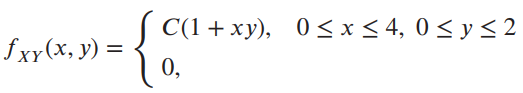
The joint pdf of two random variables isotherwise Find the following:(a) The constant C(b) fXY (1, 1.5)(c) fXY (x, 3) C(1+xy), 0
The joint pdf of two random variables isotherwise Find the following:(a) The constant C(b) fXY (1, 1.5)(c) fXY (x, 3)(d) fX|Y(x | 3) C(1+xy), 0
Test X and Y for independence if (a) fXY (x,y) = Ae-|x| -2|y| (b) fXY (x,y) = C(1 - x - y), 0 ≤ x ≤ 1- y and 0 ≤ y ≤ 1Prove your answer.
The following functions can be pdfs if the constants are chosen properly. Find the proper conditions on the constants so that they are. [A, B, C, D, α, β, γ, and τ are positive constant and u (x) is the unit step function.](a) f(x) = Ae-αx u(x), where u(x) is the unit step (b) f(x) =
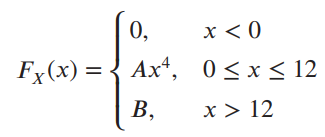
A certain continuous random variable has the cumulative-distribution function(a) Find the proper values for A and B.(b) Obtain and plot the pdf fX(x).(c) Compute P(X > 5).(d) Compute P(4 ‰¤ X < 6). х
Three fair coins are tossed simultaneously such that they don’t interact. Define a random variable X = 1 if an even number of heads is up and X = 0 otherwise. Plot the cumulative-distribution function and the probability-density function corresponding to this random variable.
Two dice are tossed.(a) Let X1 be a random variable that is numerically equal to the total number of spots on the up faces of the dice. Construct a table that defines this random variable.(b) Let X2 be a random variable that has the value of 1 if the sum of the number of spots up on both dice
Given the table of joint probabilities of Table 6.5,(a) Find the probabilities omitted from Table 6.5,(b) Find the probabilities P(A3 | B3), P(B2 | A1), and P(B3 | A2). Table 6.5 Table of Probabilities for Problem 6.7. P (A,) BỊ B, B3 A1 0.05 0.45 0.55 A2 Аз P (B,) 0.15 0.10 0.05 0.05 0.15
Given a binary communication channel where A = input and B = output, let P(A) = 0.45, P(B | A) = 0.95, and P(B̅ | A̅) = 0.65. Find P(A | B) and P(A | B̅).
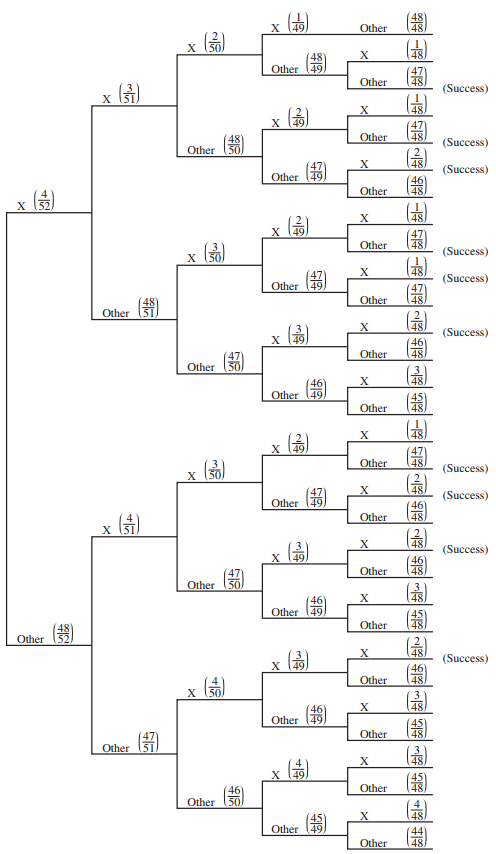
Figure 6.20 is a graph that represents a communication network, where the nodes are receiver/repeater boxes and the edges (or links) represent communication channels, which, if connected, convey the message perfectly. However, there is the probability q = 1 - p that it will be whole.Use a tree
Check the validity of the central-limit theorem by repeatedly generating n independent uniformly distributed random variables in the interval (-0.5,0.5), forming the sum given by (6.187), and plotting the histogram. Do this for N = 5, 10, and 20. Can you say anything qualitatively and
Using the results of Problem 6.26 and the Gaussian random number generator designed in Computer Exercise 6.2, design a Gaussian random number generator that will provide a specified correlation between adjacent samples.Let P(τ) = e-α|τ|and plot sequences of Gaussian random numbers for
Two events, A and B, have respective marginal probabilities P (A) = 0.2 and P(B) = 0.5, respectively. Their joint probability is P (A ∩ B) = 0.4.(a) Are they statistically independent? Why or why not?(b) What is the probability of A or B or both occurring?(c) In general, what must be true for two
What equations must be satisfied in order for three events A, B, and C to be independent? (They must be independent by pairs, but this is not sufficient.)
If five cards are drawn without replacement from an ordinary deck of cards, what is the probability that(a) Three kings and two aces result;(b) Four of a kind result;(c) All are of the same suit;(d) An ace, king, queen, jack, and ten of the same suit result;(e) Given that an ace, king, jack, and
Referring to Computer Example 4.4, draw the block diagram of the system represented by the simulation loop, and label the inputs and outputs of the various loop components with the names used in the simulation code. Using this block diagram, verify that the simulation program is correct. What are
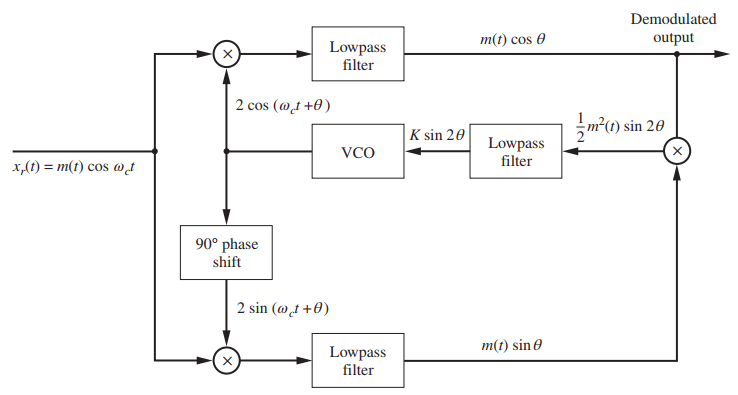
Using xr(t) = m(t) cos(2πfct) and e0(t) = 2 cos (2πfct + θ) for the assumed Costas PLL input and VCO output, respectively, verify that all signals shown at the various points in Figure 4.26 are correct. Assuming that the VCO frequency deviation is defined by
It is desired to transmit data at 9 kbps over a channel of bandwidth 7 kHz using raised-cosine pulses. What is the maximum value of the roll-off factor, β, that can be used?
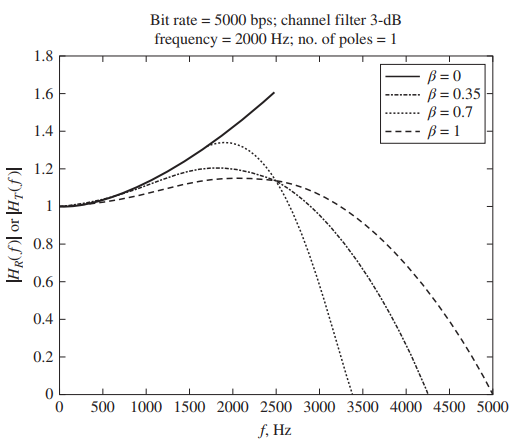
If |Hc (f)| = [1 + (f /5000)2] -1/2 , provide a plot for |HT (f)| = |HR (f)| assuming the pulse spectrum PRC(f) with 1/T = 5000 Hz for (a) β = 1; (b) β = 1/2
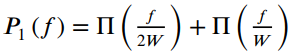
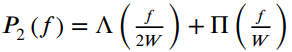
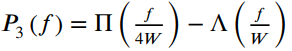
Sketch the following spectra and tell which ones satisfy Nyquist€™s pulse-shape criterion. For those that do, find the appropriate sample interval, T, in terms of W. Find the corresponding pulse-shape function p(t). (Recall that II(f/A) is a unit-high rectangular pulse from - A/2 to A/2,
Show that (5.31) and (5.32) are Fourier-transform pairs.
Show that (5.32) is an ideal rectangular spectrum for β = 0. What is the corresponding pulse-shape function?
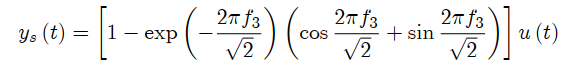
Using the superposition and time-in-variance properties of an RC filter, show that (5.27) is the response of a low pass RC filter to (5.26) given that the filter’s response to a unit step is [1 - exp (-t/RC)] u (t).
Given the step response for a second-order Butter worth filter as in Problem 2.65c, use the superposition and time-in-variance properties of a linear time-invariant system to write down the filter??s response to the input Problem 2.65c x(t) = u(t) - 2u (t - T) + u(t - 2T) where u(t) is the unit
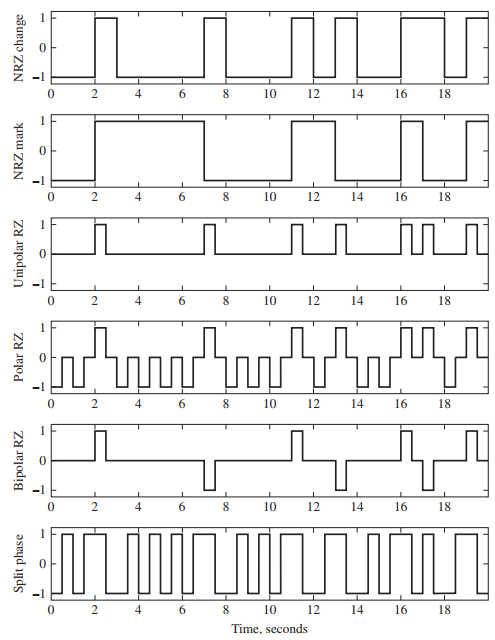
A channel of bandwidth 4 kHz is available. Determine the data rate that can be accommodated for the following line codes (assume a bandwidth to the first spectral null):(a) NRZ change;(b) Split phase;(c) Unipolar RZ and polar RZ(d) Bipolar RZ.
A symbol synchronizer uses a fourth-power device instead of a squarer. Modify the MATLAB program of Computer Example 5.3 accordingly and show that a useful spectral component is generated at the output of the fourth-power device. Rewrite the program to be able to select between square-law,
Write a MATLAB program that will compute the weights of a transversal-filter zero forcing equalizer for a given input pulse sample sequence.
Write a MATLAB program that will produce plots like those shown in Figure 5.10. The Butter worth channel filter poles and 3-dB frequency should be inputs as well as the roll-off factor, β.Figure 5.10 Bit rate = 5000 bps; channel filter 3-dB frequency = 2000 Hz; no. of poles = 1 1.8 B =
Given the channel features or objectives below. For each part, tell which line code(s) is (are) the best choice(s).(a) The channel frequency response has a null at f = 0 hertz.(b) The channel has a pass band from 0 to 10 kHz and it is desired to transmit data through it at 10,000 bits/s.(c) At
Write a MATLAB program that will produce plots like those shown in Figure 5.2 assuming a random binary data sequence. Include as an option a Butter worth channel filter whose number of poles and bandwidth (in terms of bit rate) are inputs.Figure 5.2 12 14 2. 6. 8. 10 16 18 6. 10 12 14 16 18 4. 6.
Assume that an FM demodulator operates in the presence of sinusoidal interference. Show that the discriminator output is a nonzero constant for each of the following cases: Ai = Ac, Ai = -Ac, and Ai >> Ac. Determine the FM demodulator output for each of these three cases.
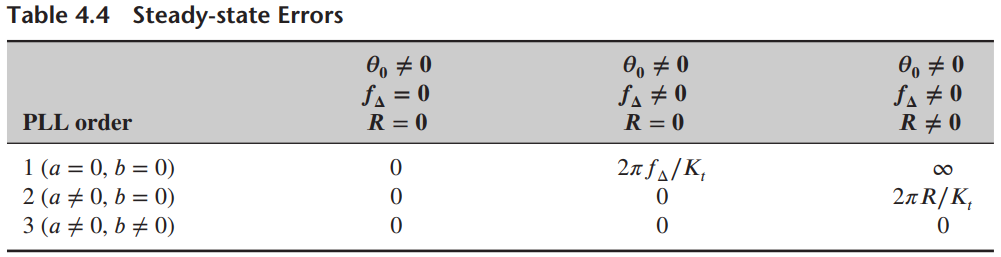
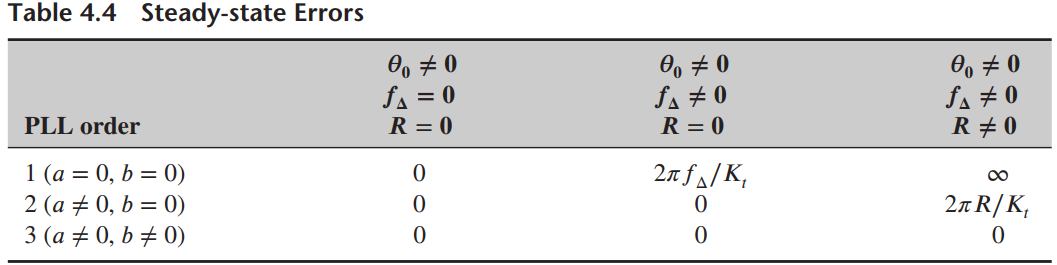
Assuming the loop filter model for an imperfect second-order PLL described in the preceding problem, derive the steady-state phase errors under the three conditions of θ0, fΔand R given in Table 4.4. Table 4.4 Steady-state Errors O, + 0 fa # 0 R + 0 O, + 0 fa = 0 O, + 0 fa
A first-order PLL is operating with zero frequency and phase error when a step in frequency of magnitude Δω is applied. The loop gain Kt is 2π(100). Determine the steady-state phase error, in degrees, for Δω = 2π(30), 2π(50), 2π(80), and 2π(80), rad/s. what happen if Δω = 2π(120) rad/s?
Starting with (4.117) verify the steady-state errors given in Table 4.4. Table 4.4 Steady-state Errors O, + 0 fa # 0 R = 0 O, + 0 fa = 0 0, + 0 fa # 0 R + 0 PLL order R = 0 1 (a = 0, b = 0) 2 (a + 0, b = 0) 3 (a + 0, b + 0) 2n f^/K, 00 2n R/K,
Repeat the preceding problem assuming that the transmitter outputs are defined by(a) xc (t) = cos[2π(1000)t2](b) xc (t) = cos[2π(900)t + 10√t]Data From Problem 9A transmitter uses a carrier frequency of 1000 Hz so that the unmodulated carrier is Ac cos(2πfct). Determine both the phase and
Modify the simulation program given in Computer Example 4.4 to allow the sampling frequency to be entered interactively. Examine the effect of using different sampling frequencies by executing the simulation with a range of sampling frequencies. Be sure that you start with a sampling frequency that
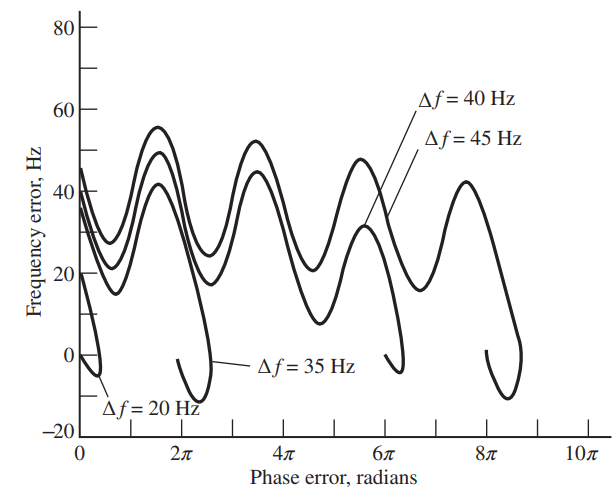
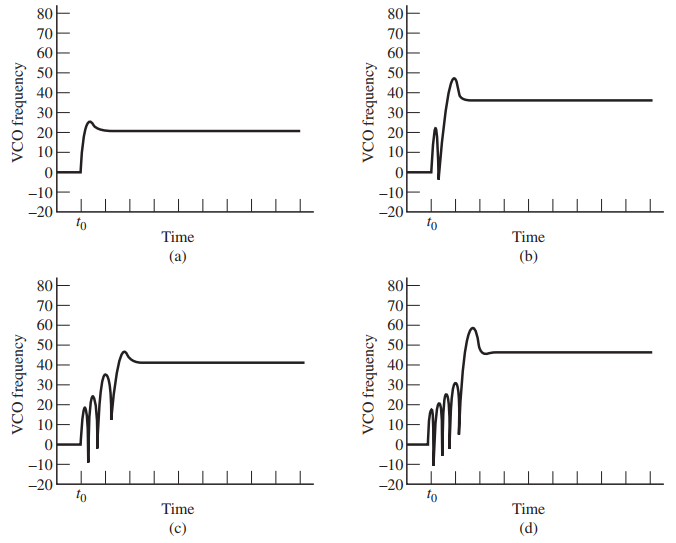
Develop a computer program and use the program to verify the simulation results shown in Figures 4.24 and 4.25.Figure 4.24Figure 4.25 80 Af = 40 Hz 60 ww Af = 45 Hz 20 ·Af = 35 Hz Af= 20 Hz -20 2л 4л бл 10л Phase error, radians Frequency error, Hz
Develop a computer program to generate the amplitude spectrum at the output of an FM modulator assuming a square-wave message signal. Plot the output for various values of the peak deviation. Compare the result with the spectrum of a PWM signal and comment on your observations
Reconstruct Figure 4.7 for the case in which 3 values of the modulation index (0.5, 1, and 5) are achieved by adjusting the peak frequency deviation while holding fmconstant. Figure 4.7 f2
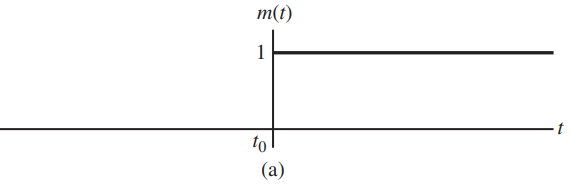
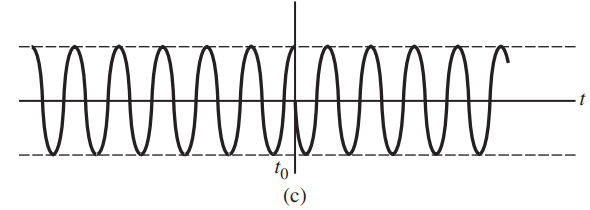
Let the input to a phase modulator be m(t) = u(t - t0), as shown in Figure 4.1(a). Assume that the unmodulated carrier is Accos(2πfct) and that fct0= n, where n is an integer. Sketch accurately the phase modulator output for kp= π and -3/8π was done in Figure 4.1(c)
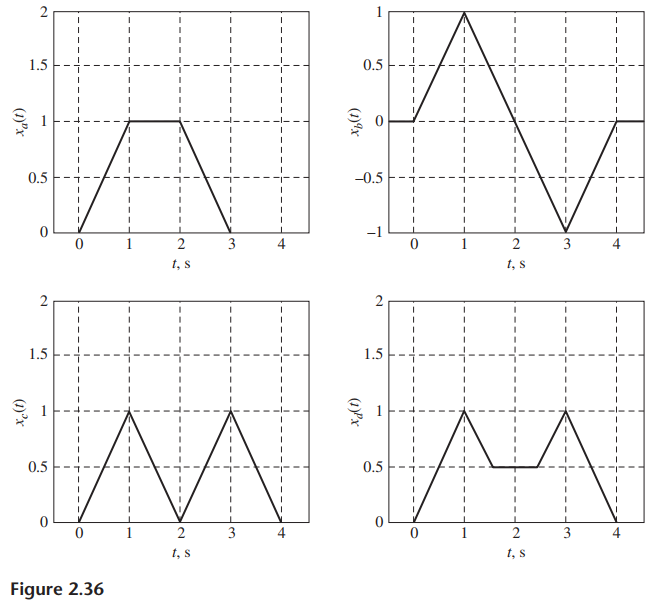
Using only the Fourier transform of the unit impulse function and the differentiation theorem, find the Fourier transforms of the signals shown in Figure 2.36.
Showing 700 - 800
of 1112
1
2
3
4
5
6
7
8
9
10
11
12
Step by Step Answers

![fx(x) = ;5(x – 5) + lu(x – 4) – u(x – 8)]](https://dsd5zvtm8ll6.cloudfront.net/si.question.images/images/question_images/1537/3/5/2/4295ba222ed06c6b1537334794358.jpg)