New Semester
Started
Get
50% OFF
Study Help!
--h --m --s
Claim Now
Question Answers
Textbooks
Find textbooks, questions and answers
Oops, something went wrong!
Change your search query and then try again
S
Books
FREE
Study Help
Expert Questions
Accounting
General Management
Mathematics
Finance
Organizational Behaviour
Law
Physics
Operating System
Management Leadership
Sociology
Programming
Marketing
Database
Computer Network
Economics
Textbooks Solutions
Accounting
Managerial Accounting
Management Leadership
Cost Accounting
Statistics
Business Law
Corporate Finance
Finance
Economics
Auditing
Tutors
Online Tutors
Find a Tutor
Hire a Tutor
Become a Tutor
AI Tutor
AI Study Planner
NEW
Sell Books
Search
Search
Sign In
Register
study help
statistics
elementary statistics a step by step approach
Elementary Statistics A Step By Step Approach 9th Edition Allan G. Bluman - Solutions
The three types of frequency distributions are_______ , _______ , and _______ .
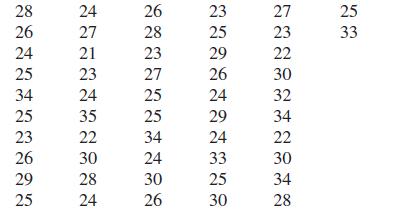
The data show the ages of the players of the New England Patriots in 2012. Construct a dot plot for the data, and comment on the distribution. 28 26 24 25 34 25 23 26 29 25 24 27 21 23 24 35 22 30 28 24 26 28 23 27 25 25 34 24 30 26 23 25 29 26 24 29 24 33 25 30 27 23 22 30 32 34 22 30 34 28 25 33
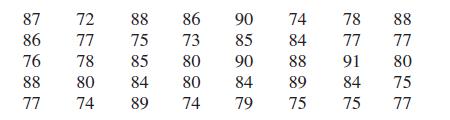
The number of patients seen at a walk-in medical care facility for each of 40 days is shown. Construct a dot plot for the data, and comment on the distribution. 87 86 76 88 77 72 88 86 77 75 73 78 85 80 80 84 74 89 80 74 90 85 90 84 79 74 78 84 77 88 91 89 84 75 75 88 77 80 75 77
In a frequency distribution, the number of classes should be between _______and_______ .
Data such as blood types (A, B, AB, O) can be organized into a(n) __________frequency distribution.
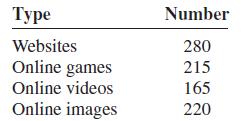
The number of teachers who use the types of technology in the classroom is shown. Construct a Pareto chart for the data. Type Websites Online games Online videos Online images Number 280 215 165 220
Data collected over a period of time can be graphed using a(n)_______ graph.
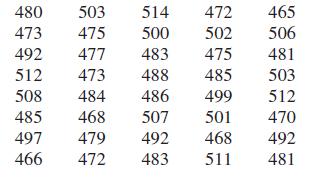
Forty plasma TVs were tested, and the number of watts per hour that they used while running for 4 hours per day were recorded. Construct a frequency distribution for the data. Use 6 classes. 514 472 500 502 480 503 473 475 492 477 483 512 473 508 484 485 468 475 488 485 486 499 507 501 497
A statistical device used in exploratory data analysis that is a combination of a frequency distribution and a histogram is called a(n)_______ .
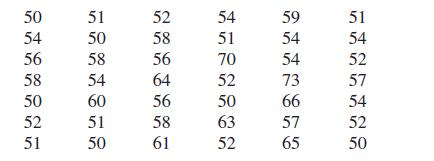
There are 42 Major League baseball players (as of 2011) that have hit 50 or more home runs in one season. Construct a stem and leaf plot and analyze the data. 50 54 56 58 50 52 51 51 50 58 54 60 51 50 52 58 56 64 56 58 61 54 51 70 52 50 63 52 59 54 54 73 66 57 65 51 54 52 57 54 52 50
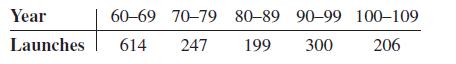
The data show the number of U.S. space launches for the 10-year periods from 1960 to 2009. Construct a time series graph for the data and analyze the graph. Year Launches 614 247 199 60-69 70-79 80-89 90-99 100-109 300 206
On a Pareto chart, the frequencies should be represented on the________ axis.
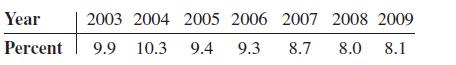
The data show the high school dropout rate for students for the years 2003 to 2009. Construct a time series graph and analyze the graph. Year Percent 2003 2004 2005 2006 2007 2008 2009 9.9 10.3 9.4 9.3 8.7 8.0 8.1
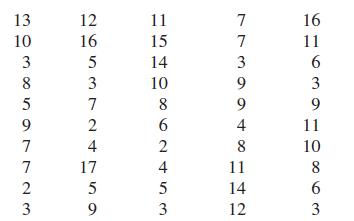
In a small city the number of quarters collected from the parking meters is shown. Construct a dot plot for the data. 13 10 3 8 5 9 7 7 2 3 12 16 5 3 7 2 4 17 5 9 11 15 14 10 8 6 2 4 5 3 7 7 3 9 9 4 8 11 14 12 16 11 6 3 9 11 10 8 6 3
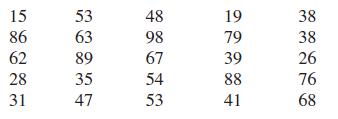
The number of visitors to the Historic Museum for 25 randomly selected hours is shown. Construct a stem and leaf plot for the data. 15 86 62 28 31 53 63 89 35 47 48 98 67 54 53 19 79 39 88 41 38 38 26 76 68
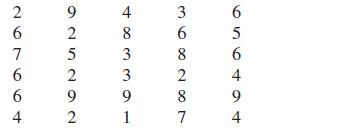
Construct a histogram, a frequency polygon, and an ogive for the data in Exercise 20.Data from in Exercise 20When 30 randomly selected customers left a convenience store, each was asked the number of items he or she purchased. Construct an ungrouped frequency distribution for the data. 2 6 7 6 6 4
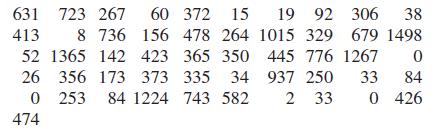
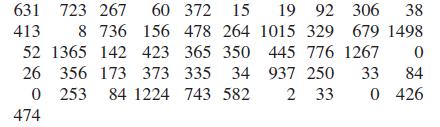
The following data represent the energy consumption of coal (in billions of Btu) by each of the 50 states and the District of Columbia. Use the data to construct a frequency distribution and a relative frequency distribution with 7 classes. 631 723 267 60 372 15 19 92 306 38 8 736 156 478 264 1015
Construct a histogram, frequency polygon, and ogive for the data in Exercise 22. Analyze the histogram.Data from in Exercise 22The following data represent the energy consumption of coal (in billions of Btu) by each of the 50 states and the District of Columbia. Use the data to construct a
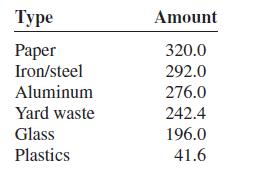
Construct a Pareto chart and a horizontal bar graph for the number of tons (in millions) of trash recycled per year by Americans based on an Environmental Protection Agency study. Туре Paper Iron/steel Aluminum Yard waste Glass Plastics Amount 320.0 292.0 276.0 242.4 196.0 41.6
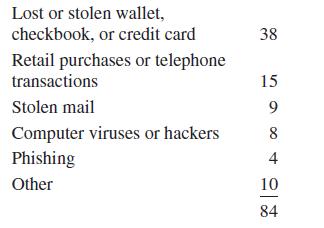
The results of a survey of 84 people whose identities were stolen using various methods are shown. Draw a pie chart for the information. Lost or stolen wallet, checkbook, or credit card Retail purchases or telephone transactions Stolen mail Computer viruses or hackers Phishing Other 38 15 9 84 10 84
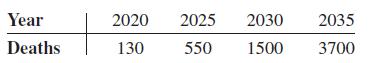
The New England Journal of Medicine predicted the number of needless deaths due to childhood obesity. Draw a time series graph for the data. Year Deaths 2020 2025 2030 130 550 1500 2035 3700
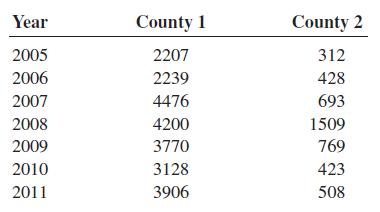
The numbers of concealed weapons licenses issued for two neighboring counties are listed below for the years 2005–2011. Compare the data with the time series graph(s), and comment on the accompanying headline of the story, “Gun sales increase as crime rate decreases.”
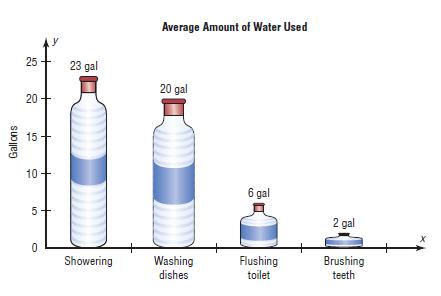
The graph shows the average number of gallons of water a person uses for various activities. Can you see anything misleading about the way the graph is drawn? Gallons 25+ 20 15 10 + 10 5 0 23 gal Showering Average Amount of Water Used 20 gal Washing dishes 6 gal Flushing toilet 2
Customers in the Sunrise Coffee Shop are asked how much they spend on coffee per week. For Exercises indentify the sampling method that
A research study stated that meditation helps people make more-rational decisions.In Exercises identify the independent variable and the dependent variable.
For Exercises give the boundaries of each value.25.8 yards
In a research study, participants should be assigned to groups using _______ methods, if possible.
For Exercises give the boundaries of each value.19 quarts
For each statement, decide whether descriptive or inferential statistics is used.a. The average life expectancy in New Zealand is 78.49 years (Source: World Factbook).b. A diet high in fruits and vegetables will lower blood pressure.c. The total amount of estimated losses for Hurricane Katrina was
For Exercises classify each as nominal-level, ordinal-level, interval level, or ratio-level measurement.Telephone numbers
Classify each as nominal-level, ordinal-level, interval-level, or ratio-level of measurement.a. Rating of movies as G, PG, and Rb. Number of candy bars sold on a fund drivec. Classification of automobiles as subcompact, compact, standard, and luxuryd. Temperatures of hair dryerse. Weights of
For Exercises classify each as nominal-level, ordinal-level, interval level, or ratio-level measurement.Leap years: . . . 2008, 2012, 2016, . . .
A researcher from the University of California found that gratitude can produce positive emotions that can lead to a longer, healthier life.For Exercises suggest some confounding variables that the researcher might want to consider when doing a study.
For Exercises classify each as nominal-level, ordinal-level, interval level, or ratio-level measurement.Amounts of money spent on a medical checkup
Investigate the types of data that are collected regarding stock and bonds, for example, price, earnings ratios, and bond ratings. Find as many types of data as possible. For each, identify the level of measurement as nominal, ordinal, interval, or ratio. For any quantitative data, also note if
Probability is used as a basis for inferential statistics.
The variable temperature is an example of a quantitative variable.
Name two areas where probability is used.
The height of basketball players is considered a continuous variable.
The boundary of a value such as 6 inches would be 5.9–6.1 inches.
Number of phone calls received during one day at a poison control centerFor Exercises determine whether the data are discrete or continuous.
Two uses of probability are_______ and_______ .
In a large city, a researcher decides to check the police department records for 2 months to determine what types of vehicles were stolen.For Exercises determine whether an observational study or an experimental study was used.
The group of all subjects under study is called a(n) _______.
In a public park, visitors were asked how many minutes a day they walked their dogs.For Exercises determine whether an observational study or an experimental study was used.
For Exercises give the boundaries of each value.7 feet
A group of subjects selected from the group of all subjects under study is called a(n) _______.
Subjects were randomly divided into two groups. One group was permitted 4 hours of sleep each night for one week. The other group was allowed to sleep at least 8 hours each night for one week. The blood pressures of both groups were taken at the end of the week and compared.For Exercises determine
For Exercises give the boundaries of each value.6.3 millimeters
Three reasons why samples are used in statistics:a. _______ b. _______ c. _______
For Exercises give the boundaries of each value.143 miles
The four basic sampling methods area. _______ b. _______ c. _______ d. _______
For Exercises give the boundaries of each value.3.25 pounds
A study that uses intact groups when it is not possible to randomly assign participants to the groups is called a(n) _______ study.
Give the boundaries of each.a. 32 minutesb. 0.48 millimeterc. 6.2 inchesd. 19 poundse. 12.1 quarts
For Exercises classify each variable as qualitative or quantitative.Different vitamins taken.
For Exercises classify each variable as discrete or continuous.Number of pizzas sold by Pizza Express each day.
For Exercises classify each as nominal-level, ordinal-level, interval-level, or ratio-level measurement.Ratings of fiction books—excellent, good, fair, poor
For Exercises classify each variable as discrete or continuous.Relative humidity levels in operating rooms at local hospitals.
For Exercises classify each variable as discrete or continuous.Number of bananas in a bunch at several local supermarkets.
For Exercises classify each as nominal-level, ordinal-level, interval level, or ratio-level measurement.Online spending
For Exercises classify each variable as discrete or continuous.Lifetimes (in hours) of 15 iPod batteries.
For Exercises classify each as nominal-level, ordinal-level, interval level, or ratio-level measurement.Number of flowers in a bouquet
For Exercises classify each variable as discrete or continuous.Blood pressures of runners in a marathon.
For the article that you used in Exercise 43, identify the independent variable(s) and dependent variable for the study.Data from in Exercise 43Find an article that describes a statistical study, and identify the study as observational or experimental.
For Exercises identify the independent and dependent variables for each study.Various types of coffees are selected from local coffee shops, and the number of milligrams of caffeine per ounce is determined.
For Exercises identify the independent and dependent variables for each study.It was found that laughing can reduce your aches and pains as much as taking a pain pill.
For Exercises explain why the claims of these studies might be suspect.In Greenville County there are 8324 deer.
For Exercises explain why the claims of these studies might be suspect.Nursing school graduates from Fairview University earn on average $33,456.
A study of the world’s busiest airports was conducted by Airports Council International. Describe three variables that one could use to determine which airports are the busiest. What units would one use to measure these variables? Are these variables categorical, discrete, or continuous?
Select a professional sport. Investigate the types of data that are collected about that sport, for example, in baseball, the level of play (A, AA, AAA, Major League), batting average, and home-run hits. For each, identify the level of measurement as nominal, ordinal, interval, or ratio. For any
For Exercises state whether descriptive or inferential statistics has been used.In a sample of 100 on-the-job fatalities, 90% of the victims were men.
When the sample does not represent the population, it is called a biased sample.
The results of a study published in Archives of General Psychiatry stated that male children born to women who smoke during pregnancy run a risk of violent and criminal behavior that lasts into adulthood. The results of this study were challenged by some people in the media. Give several reasons
Music organization programs on computers and music players maintain information about a song, such as the writer, song length, genre, and your personal rating. Investigate the types of data collected about a song. For each, identify the level of measurement as nominal, ordinal, interval, or ratio.
What is meant by a census?
The difference between a sampling measure and a population measure is called a nonsampling error.
When the population of college professors is divided into groups according to their rank (instructor, assistant professor, etc.) and then several are selected from each group to make up a sample, the sample is called a cluster sample.
Think about the types of data that can be collected about your health and wellness, things such as blood type, cholesterol level, smoking status, and body mass index. Find as many data items as you can. For each, identify the level of measurement as nominal, ordinal, interval, or ratio. For any
The results of a study published in Neurological Research stated that second-graders who took piano lessons and played a computer math game more readily grasped math problems in fractions and proportions than a similar group who took an English class and played the same math game. What type of
A study of 2958 collegiate soccer players showed that in 46 anterior cruciate ligament (ACL) tears, 36 were in women. Calculate the percentages of tears for each gender.a. Can it be concluded that female athletes tear their knees more often than male athletes?b. Comment on how this study’s
Every 10 years since 1790, the federal government has conducted a census of U.S. residents. Investigate the types of data that were collected in the 2010 census. For each, identify the level of measurement as nominal, ordinal, interval, or ratio. For any quantitative data, also note if they are
For Exercises determine whether the data are qualitative or quantitative.Color of football uniforms
For Exercises define a population that may have been used and explain how the sample might have been selected.In 2011, 25% of people did not engage in regular physical activity.
Read the article entitled “Anger Can Cause Snap Judgments” and answer the following questions.a. Is the study experimental or observational?b. What is the independent variable?c. What is the dependent variable?d. Do you think the sample sizes are large enough to merit the conclusion?e. Based on
Your school probably has a database that contains information about each student, such as age, county of residence, credits earned, and ethnicity. Investigate the types of student data that your college collects and reports. For each, identify the level of measurement as nominal, ordinal, interval,
For Exercises state whether descriptive or inferential statistics has been used.Drinking decaffeinated coffee can raise cholesterol levels by 7%
For Exercises define a population that may have been used and explain how the sample might have been selected.The number one automobile that vehicle thieves prefer is the Honda Accord.
Read the article entitled “Hostile Children Fight Unemployment” and answer the following questions.a. Is the study experimental or observational?b. What is the independent variable?c. What is the dependent variable?d. Suggest some confounding variables that may have influenced the results of
For Exercises state whether descriptive or inferential statistics has been used.The average stay in a hospital for 2000 patients who had circulatory system problems was 4.7 days.
For Exercises determine whether the data are qualitative or quantitative.Cholesterol counts for individuals
For Exercises define a population that may have been used and explain how the sample might have been selected.There are 78 million pet owners in the United States who have dogs.
Explain the Hawthorne effect.
For Exercises determine whether the data are qualitative or quantitative.Lightbulb wattage
The number of ads on a one-hour television show is what type of data?a. Nominalb. Qualitativec. Discreted. Continuous
For Exercises determine whether the data are qualitative or quantitative.Genders of movie stars
What are the boundaries of 25.6 ounces?a. 25–26 ouncesb. 25.55–25.65 ouncesc. 25.5–25.7 ouncesd. 20–39 ounces
For Exercises determine whether the data are qualitative or quantitative.Ratings of teachers
A researcher divided subjects into two groups according to gender and then selected members from each group for her sample. What sampling method was the researcher using?a. Clusterb. Randomc. Systematicd. Stratified
For Exercises, determine whether descriptive or inferential statistics were used.In 2011, there were 34 deaths from the avian flu.
Showing 1800 - 1900
of 1910
First
6
7
8
9
10
11
12
13
14
15
16
17
18
19
20
Step by Step Answers