New Semester
Started
Get
50% OFF
Study Help!
--h --m --s
Claim Now
Question Answers
Textbooks
Find textbooks, questions and answers
Oops, something went wrong!
Change your search query and then try again
S
Books
FREE
Study Help
Expert Questions
Accounting
General Management
Mathematics
Finance
Organizational Behaviour
Law
Physics
Operating System
Management Leadership
Sociology
Programming
Marketing
Database
Computer Network
Economics
Textbooks Solutions
Accounting
Managerial Accounting
Management Leadership
Cost Accounting
Statistics
Business Law
Corporate Finance
Finance
Economics
Auditing
Tutors
Online Tutors
Find a Tutor
Hire a Tutor
Become a Tutor
AI Tutor
AI Study Planner
NEW
Sell Books
Search
Search
Sign In
Register
study help
mathematics
statistics the art and science
Statistics The Art And Science Of Learning From Data 4th Edition Alan Agresti, Christine A. Franklin, Bernhard Klingenberg - Solutions
A 2013 article in the journal Adolescent Health stated that adding energy drinks to alcohol was associated with an elevated blood alcohol content compared to consuming alcohol without energy drinks in college students.a. Suppose this conclusion was based on a significance test comparing means.
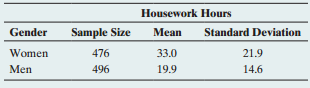
Refer to part c in the previous exercise.a. Show that a 99% confidence interval is (10.0, 16.2).b. Explain why this interval is wider than the 95% confidence interval.Previous exercisec. Calculate the 95% confidence interval comparing the population means for women and men. Interpret the result
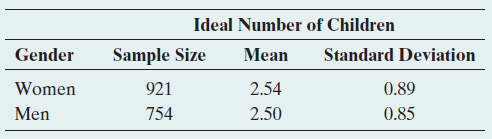
In 2014, the GSS asked, €œWhat is the ideal number of children for a family to have?€ For those giving a numerical response (and treating the response €œ7 or more€ as 7), the following table shows summary statistics. (You can reproduce these data by typing
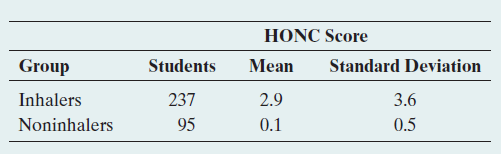
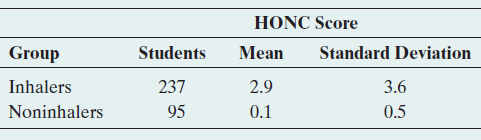
A study on nicotine dependence for teenage smokers obtained a random sample of seventh graders. The response variable was constructed from a questionnaire called the Hooked on Nicotine Checklist (HONC). This is a list of ten questions such as, €œHave you ever tried to quit but
Refer to Exercise 10.23 about studying nicotine dependence using a random sample of teenagers. Of those seventh graders in the study who had tried tobacco, the mean HONC score was 2.8 (s = 3.6) for the 150 females and 1.6 (s = 2.9) for the 182 males.a. Find a standard error for comparing the sample
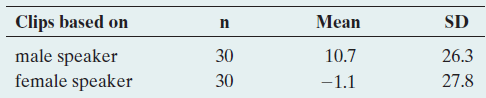
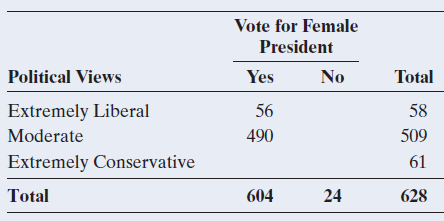
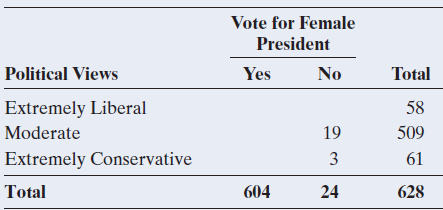
In an experiment investigating body language (M. Koppensteiner et al., Personality and Individual Differences, vol. 74, 2015, pp. 182€“185), researchers turned short video clips of randomly selected speeches by male and female politicians into an animated, gender-neutral stick figure
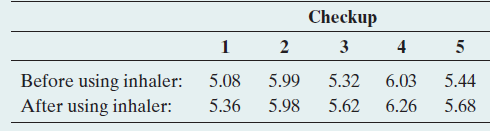
One of the authors of this book has his lung function checked every other year. At each checkup, his lung volume (called the forced vital capacity, or FVC) is measured before and after using an inhaler that contains medication against asthma. The last five checkups provided the following results
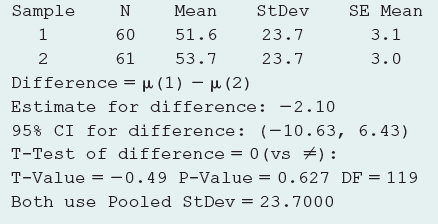
Refer to Example 10, €œArthroscopic Surgery.€ Here we show MINITAB output comparing mean knee pain scores for the placebo (Group 1) to lavage arthroscopic surgery (Group 2) assuming equal population standard deviations.a. State and interpret the result of the confidence
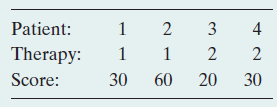
Refer to Exercise 10.38, which compared two therapies for depression patients. Suppose that in a different experiment, only four patients took part; two were randomly assigned to the group that received therapy 1 and the remaining two to the group that received therapy 2. The following table shows
Refer to the previous exercise comparing improvement scores under two therapies for depression patients.a. State the null hypothesis of equal population distributions in the context of this experiment.b. Argue that if the null hypothesis is true, the sampling distribution for the difference in
Refer to the previous exercise and the sampling distribution mentioned there. What is the permutation P-value for the two-sided test with alternative hypothesis that the mean improvement scores are different under therapies 1 and 2?
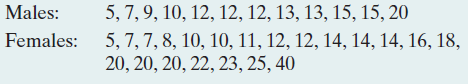
Exercise 10.31 considered the following data on the number of hours students spent on social network sites per week:Enter the observations (separated by spaces) into the Permutation Test web app. Let males be Group 1 and females be Group 2. We are interested in testing whether the population mean
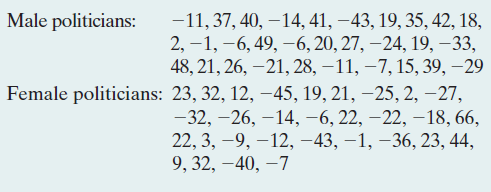
For a rating experiment, researchers translated short video clips of randomly selected speeches by 30 male and 30 female politicians into animated, gender-neutral stick-figures. These animated sequences were rated (on a scale from ˆ’100 to 100) by a panel of students on the perceived
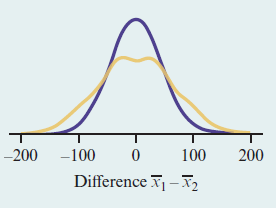
Refer to Example 12, which compared two groups of seven dogs each in terms of their time interacting with their owners. The following graph shows a smoothed version of the sampling distribution of xÌ…1- xÌ…2derived from the permutation approach. Superimposed (in blue) is the
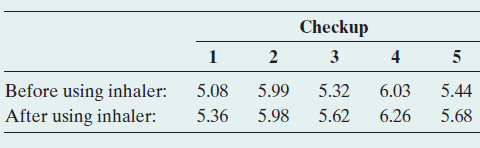
Refer to Exercise 10.34 about measuring the lung function (called the forced vital capacity, or FVC, measured in liters) before and after using an inhaler. The data are shown again in the following table.a. By how much, on average, did the FVC improve after using the inhaler?b. Find a 95%
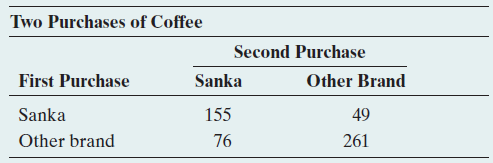
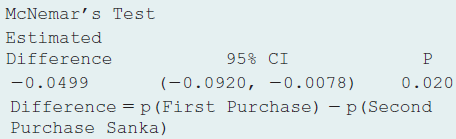
A study was conducted to see if an advertisement campaign would increase market share for Sanka instant decaffeinated coffee (R. Grover and V. Srinivasan, J. Marketing Research, vol. 24, 1987, pp. 139€“ 153). Subjects who use instant decaffeinated coffee were asked which brand they bought
Last month a random sample of 1000 subjects was interviewed and asked whether they thought the president was doing a good job. This month the same subjects were asked this again.The results are: 450 said yes each time, 450 said no each time, 60 said yes on the first survey and no on the second
Refer to the previous exercise. Results in this poll also depended strongly on the country in which the question was asked. For instance, the percentages believing in (heaven, hell) were (52%, 26%) in Ireland, (32%, 19%) in New Zealand, (28%, 22%) in Italy, (25%, 13%) in Great Britain, (21%, 11%)
A Pew Research Center survey of 2002 U.S. adults in August 2014 and a survey of 3748 scientists connected to the American Association for the Advancement of Science (AAAS) in September 2014 both asked the following question: "Do you favor or oppose the increased use of fracking?" In the Pew
The Centers for Disease Control (www.cdc.gov) periodically administers large randomized surveys to track health of Americans. In a survey of 4431 adults in 2003/2004, 66% were overweight (body mass index BMI Ú 25). In the most recently available survey of 5181 adults in 2011/2012, 69% were
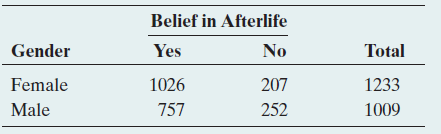
The table shows results from the 2014 General Social Survey on gender and whether one believes in an afterlife.a. Denote the population proportion who believe in an afterlife by p1 for females and by p2 for males. Estimate p1, p2, and (p1 - p2).b. Find the standard error for the estimate of (p1 -
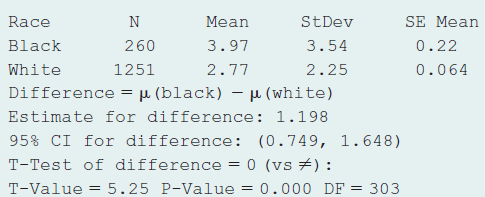
The 2014 GSS asked about the number of hours you watch TV per day. An analysis that evaluates this by race shows the results (note the codes: 1 = Black and 2 = White):a. Do you believe that TV watching has a normal distribution for each race? Why or why not? What effect does this have on inference
Geneticists hypothesized that one reason for a prolonged lifespan observed in yeast cells treated with the common drug ibuprofen stems from inhibiting the uptake of certain amino acids. In an experiment, they compared levels of amino acids in cells treated with ibuprofen to cells from an untreated
Explain why the correlation between x = number of years of education and y = annual income is likely to be smaller if we use a random sample of adults who have a Ph.D. than if we use a random sample of all adults.
What assumptions are needed to use the linear regression model to a. Obtain a meaningful fit that represents the true relationship wellb. To make inferences about the relationship. For part b, which assumption is least critical?
Exercise 12.57 about U.S. population growth showed a predicted growth rate of 13% per decade.a. Show that this is equivalent to a 1.23% predicted growth per year.b. Explain why the predicted U.S. population size (in millions) x years after 1900 is 81.137(1.0123)x.
One can interpret r = 0.30 or the corresponding r2 = 0.09 as follows:a. A 30% reduction in error occurs in using x to predict y.b. A 9% reduction in error occurs in using x to predict y compared to using y̅ to predict y.c. 9% of the time ŷ = y.d. y changes 0.3 unit for every one-unit increase in
The correlation is appropriate for describing association between two quantitative variablesa. Even when different people measure the variables using different units (e.g., kilograms and pounds).b. When the relationship is highly nonlinear.c. When the slope of the regression equation is 0 using
The slope of the least squares regression equation and the correlation are similar in the sense thata. They both must fall between -1 and +1.b. They both describe the strength of association.c. Their squares both have proportional reduction in error interpretations.d. They have the same t
The regression of y on x has a prediction equation of ŷ = -2.0 + 5.0x and a correlation of 0.3. Then, the regression of x on ya. Also has a correlation of 0.3.b. Could have a negative slope.c. Has r2 = √0.3.d. = 1/ (-2.0 + 5.0y).
University of Rochester economist Steven Landsburg surveyed economic studies in England and the United States that showed a positive correlation between height and income. The article stated that in the United States each one-inch increase in height was worth about $1,500 extra earnings a year, on
The variables y = annual income (thousands of dollars), x1 = number of years of education, and x2 = number of years experience in job are measured for all the employees having city-funded jobs in Knoxville, Tennessee. Suppose that the following regression equations and correlations apply:i) ŷ =
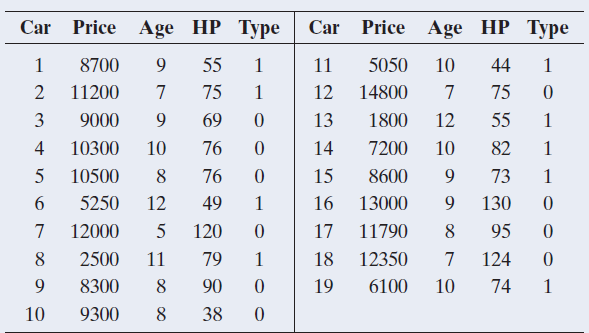
The following data (also available from the book€™s website) is from a random sample of campus newspaper ads on used cars for sale. Consider the age and horsepower (HP) of a car to predict its selling price. (The variable Type stands for whether the car is from the United States, coded as
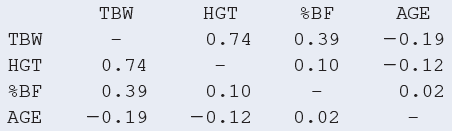
Let€™s use multiple regression to predict total body weight (TBW, in pounds) using data from a study of female college athletes. Possible predictors are HGT = height (in inches), %BF = percent body fat, and age. The display shows the correlation matrix for these variables.a. Which
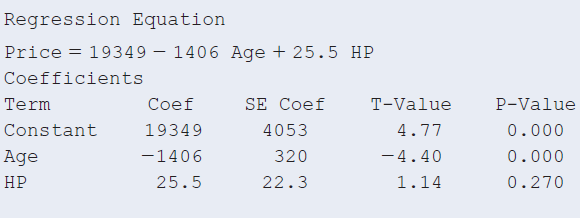
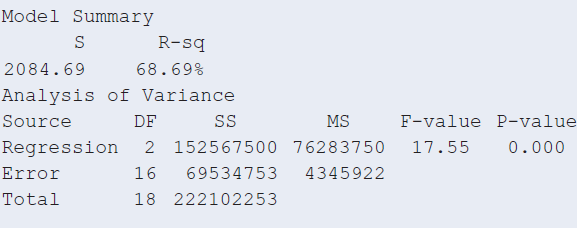
For the 19 used cars listed in the Used Cars data file on the book€™s website (see also Exercise 13.11), modeling the mean of y = used car price in terms of x1= age results in r2 = 0.66. Adding x2= horsepower (HP) to the model yields the results in the following display.a. Report R2 and
In the previous exercise, r2 = 0.66 when age is the predictor and R2 = 0.69 when both age and HP are predictors. Why do you think that the predictions of price don’t improve much when HP is added to the model? (The correlation between HP and price is r = 0.56, and the correlation between HP and
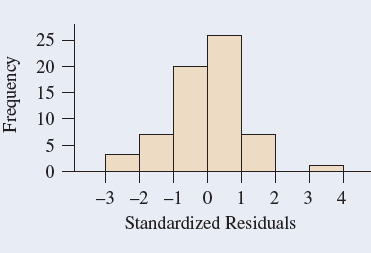
Examples 4€“7 used multiple regression to predict total body weight of college athletes in terms of height, percent body fat, and age. The following figure shows a histogram of the standardized residuals resulting from fitting this model.a. About which distribution do these give you
When we use multiple regression, what’s the purpose of doing a residual analysis? Why can’t we just construct a single plot of the data for all the variables at once to tell whether the model is reasonable?
Refer to the used car data file from Exercise 13.11. The prediction equation relating y = selling price of used car (in $) as a function of x1 = age of car and x2 = type of car (1 = US, 0 = Foreign) is ŷ = 20,493 - 1,185x1 - 2,379x2.a. Using this equation, find the prediction equation relating
Refer to Exercise 13.41, with ŷ = predicted selling price of used car and x1 = age of car. When equations are fitted separately for U.S. and foreign cars, we get ŷ = 23,417 - 1,715x1 for U.S. cars and ŷ = 15,536 - 557x1 for foreign cars.a. In allowing the lines to have different slopes, we
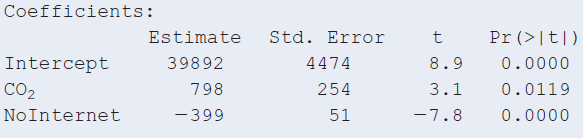
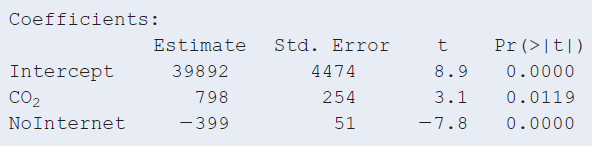
Consider predicting the per capita GDP (gross domestic product, in thousands of dollars), of a country, using x1= carbon dioxide emissions per capita (in metric tons) and x2= percent of country population not using the Internet. Based on data for several countries, the following computer output was
In the article, “Variation in cancer risk among tissues can be explained by the number of stem cell divisions” (Tomasetti and Vogelstein, Science, vol. 47, 2015), the authors stated: “A linear correlation equal to 0.804 suggests that 65% of the differences in cancer risk among different
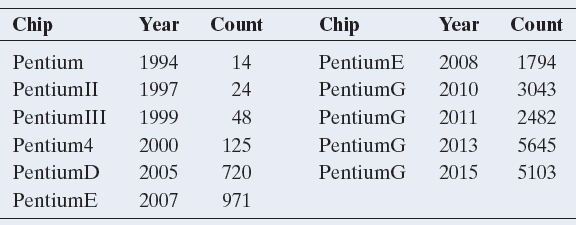
The following data show the number of components (per square inch, in millions) being packed on a Pentium-type chip, for years 1994 to 2015. Let x be the number of years since 1994 (e.g., x = 0 for 1994, x = 3 for 1997, €¦, x = 21 for 2015) and let y be the number of components on a
In the first round of a golf tournament, five players tied for the lowest round, at 65. The mean score of all players was 75. If the mean score of all players is also 75 in the second round, what does regression toward the mean suggest about how well we can expect the five leaders to do, on the
Using the context of the previous exercise, explain the difference between the purpose of a 95% prediction interval (PI) for an observation and a 95% confidence interval (CI) for the mean of y at a given value of x. Why would you expect the PI to be wider than the CI?
Refer to the cell phone data file on the book’s website. Regress y = weight on x = capacity of battery, excluding the outlier (phone no. 70).a. Stating the necessary assumptions, find a 95% confidence interval for the mean weight of cell phones with a battery capacity of 1500mAh. Interpret the
For the Georgia Student Survey data file on the book’s website, the correlation between daily time spent watching TV and college GPA is -0.35.a. Interpret r and r2. Use the interpretation of r2 that(i) refers to the prediction error(ii) the percent of variability explained.b. One student is 2
Last year you looked at all the financial firms that had stock growth funds. You picked the growth fund that had the best performance last year (ranking at the 99th percentile on performance) and invested all your money in it this year. This year, with its new investments, it ranked only at the
For the Male Athlete Strength data file on the book’s website, the correlation between weight (pounds) and percent body fat (BF%) equals 0.883.a. Interpret the sign and the strength of the correlation.b. Find and interpret r2.c. If weight were measured instead with metric units, would any results
Although the slope does not measure association, it is useful for comparing effects for two variables that have the same units. For the Internet Use data file of 32 nations on the book’s website, let x = GDP (thousands of dollars per capita). For predicting y = percentage of adults using the
If a slope is 1.50 when x = income in thousands of dollars, then what is the slope when x = income in dollars?
Refer to the cell phone data set from Exercise 12.9 about various specs of cell phones. Treat the weight of the phone as the response and the capacity of the battery as the explanatory variable. Remove the outlier (phone no. 70).a. Is there evidence for an association between these two variables?
Refer to the previous exercise, which mentioned a confidence interval of (64, 90) for the slope. The 100 houses included in the data set had sizes ranging from 370 square feet to 4,050 square feet.a. Interpret what the confidence interval implies for a one-unit increase in the size of the house.b.
Whether a young married woman becomes pregnant in the next year is a categorical variable with categories (yes, no). Another categorical variable to consider is whether she and her partner use contraceptives with categories (yes, no). Would you expect these variables to be independent or
Refer to the cell phone data set available on the book’s website, which shows various specs of a random sample of cell phones. Engineers would like to analyze how the weight (measured in grams) of a phone depends on the size of the battery, the heaviest component of a cell phone. Here, the size
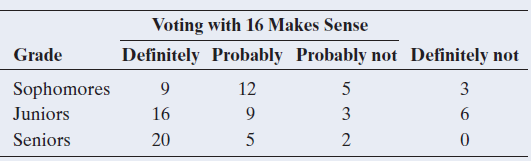
A recent survey of Austrian high school students asked whether it makes sense for 16-year-olds to be allowed to vote in the next parliamentary election. The following table shows results.a. Verify, using software, that X2 = 14.1 for this table.b. Can you use the chi-squared distribution to find a
For testing independence in a contingency table of size r × c, the degrees of freedom (df) for the chi-squared distribution equal df = (r - 1) × (c - 1). They have the following interpretation: Given the row and column marginal totals in an r × c contingency
Even when the sample conditional distributions in a contingency table are only slightly different, when the sample size is very large it is possible to have a large X2 statistic and a very small P-value for testing H0: independence.
Refer to a contingency table that cross-classifies subjects in tworows and two columns (labeled Success and Failure) and for which the odds ratio equals 4. True or False: Subjects in row 1 are 4 times as likely to have a success as subjects in row 2.
Interchanging the rows in a 2 × 2 contingency table has no effect on the value of the relative risk.
Interchanging two rows or interchanging two columns in a contingency table has no effect on the value of the X2 statistic.
The null hypothesis for the test of independence between two categorical variables is H0: X2 = 0 for the sample chi-squared statistic X2.
According to recent United Nations figures, the annual intentional homicide rate is 4.7 per 100,000 residents in the United States and 1.0 per 100,000 residents in Britain.a. Compare the proportion of residents of the two countries killed intentionally using the difference of proportions. Show how
Give an example of a contingency table for which the chi-squared test of independence should not be used.
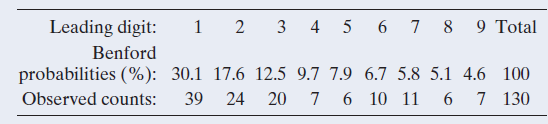
When looking at a collection of numbers, such as population sizes, the figures on tax returns or the charges on a credit card, one may think that the leading digit of the number is equally likely to be any of the numbers from 1 to 9. However, such data sets often show a distribution for the leading
Give an example of three variables for which you expect β ≠ 0 in the model μy = α + βx1 but β1 = 0 in the model μy = α + β1 x1 + β2 x2.
Multiple choice: Interpret parameter If ŷ = 2 + 3x1 + 5x2 - 8x3, then controlling for x2 and x3, the change in the estimated mean of y when x1 is increased from 10 to 20a. Equals 30.b. Equals 0.3.c. Cannot be given—depends on specific values of x2 and x3.d. Must be the same as when we
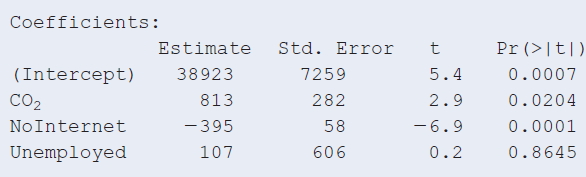
Refer to Exercise 13.67. When unemployment rate of a country is added as an additional predictor to the model already containing CO2 and percentage of population not using the Internet, we get the following output.a. Interpret the sign of the coefficient for unemployment. Is this the direction of
In the model μy = α + β1 x1 + β2 x2, suppose that x2 is an indicator variable for gender, equaling 1 for females and 0 for males.a. We set x2 = 0 if we want a predicted mean without knowing gender.b. The slope effect of x1 is β1 for males and β2 for females.c. β2 is the difference between
Multiple regression is used to model y = annual income using x1 = number of years of education and x2 = number of years employed in current job.a. It is possible that the coefficient of x2 is positive in a simple regression but negative in multiple regression.b. It is possible that the correlation
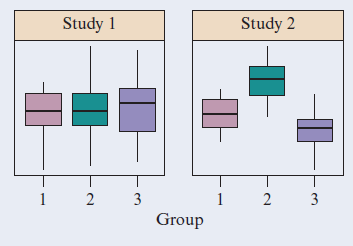
For two studies, each comparing three groups, the box plots below show results. (Each box plot is based on a random sample of size 40.)a. Judging from the box plots, which study will more likely lead to a rejection of the ANOVA null hypothesis of equal population means? Explain.b. Which study will
The restaurant guide Zagat compiles customer ratings on the quality of food on a 30-point scale. The data set French Cuisine on the book’s website contains a random sample of ratings of French cuisine restaurants in New York, London, and Paris, compiled in June 2015 from the zagat.com website.a.
The Anorexia data file on the book’s website shows weight change for 72 anorexic teenage girls who were randomly assigned to one of three psychological treatments (cognitive or family therapy and a control treatment). Use software to analyze these data. (The change scores are in the last three
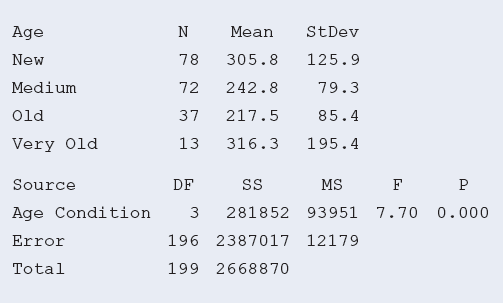
For the House Selling Prices OR data file on the book€™s website, the output shows the result of conducting an ANOVA comparing mean house selling prices (in $1000) by Age Category (New = 0 to 24 years old, Medium = 25 to 50 years old, Old = 51 to 74 years old, Very Old = 75 + years old ).
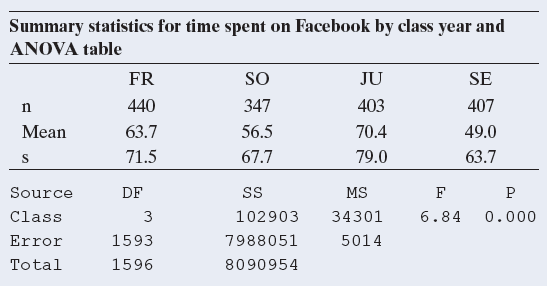
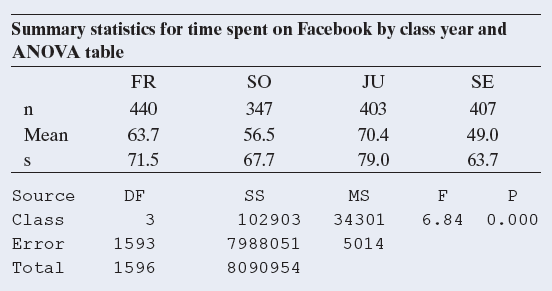
Do freshmen spent significantly more time on Facebook than other class ranks? A recent study (R. Junco, Journal of Applied Developmental Psychology, 2015, vol. 36, p. 18€“29) investigated the amount of time per day freshman, sophomores, juniors, and seniors spent on Facebook while doing
Refer to Exercise 14.13, which investigated the amount of time freshman, sophomores, juniors, and seniors spent on Facebook while doing schoolwork. The data from the study are available on the book€™s website, where time is measured in minutes.a. If you want to construct confidence
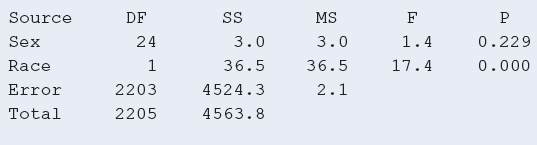
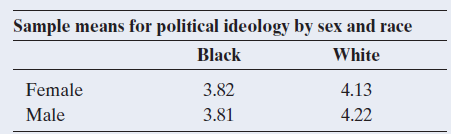
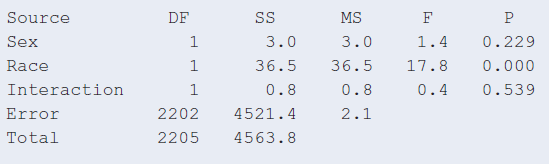
The GSS measures political ideology on a seven-point scale, starting with 1 = extremely liberal, to 4 = moderate, to 7 = extremely conservative. The following table shows results from an ANOVA analysis about political ideology, with sex (female, male) and race (black, white) as two factors, using
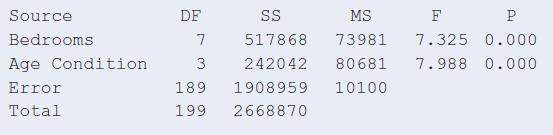
For the House Selling Prices OR data file on the book€™s website, the output shows the result of conducting a two-way ANOVA of house selling prices (in thousands) by the number of bedrooms in the house and the age (New, Medium, Old, Very Old€”see exercise 14.12) of the houses in
In 2012, the population mean hourly wage for males was $17 for high school graduates, $33 for college graduates and $43 for males with more advanced degrees. For females, the means were $14 for high school graduates, $24 for college graduates, and $32 for females with more advanced degrees.3a.
The 2014 General Social Survey asked 1475 subjects how many hours per day they watched TV, on average. Are there differences in population means according to the marital status of the subject (single, married, divorced)? The sample means were 3.27 for singles (n = 459), 2.64 for married subjects (n
Refer to the previous exercise.a. Using software, find the margin of error that pertains to each comparison, using the Tukey method for 95%multiple comparison confidence intervals.b. Using part a, determine which pairs of means, if any, are significantly different.Previous exerciseStudies of the
Refer to the House Selling Price OR data file on the book’s website.a. The variable “Garage” included in the data set is an indicator variable for whether a house has a garage (with 1 indicating that it does have one). Using software, put this as the sole predictor of house selling price (in
In a class experiment at Williams College, students were randomly assigned either to drink or abstain from drinking an energy drink before attempting a straightforward but tedious mathematical task. They were also randomly assigned to start the task at 11 P.M. at night or at 8 A.M. in the morning.
A study on the effects of prenatal exposure to smoke (by J. Nigg and N. Breslau, Journal of the American Academy of Child & Adolescent Psychiatry, vol. 46, 2009, pp. 362–369) indicated that mean birth weight was significantly lower for babies born to mothers who smoked during pregnancy. It
The first table shown summarizes responses on political ideology (where 1 = extremely liberal and 7 = extremely conservative) from the 2014 GSS by gender and race.a. From these sample means, is there evidence of a significant interaction? Explain what this means in the context of this example.b.
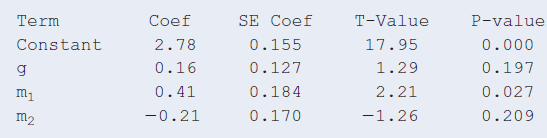
When we use the 2014 GSS and regress y = number of hours per day watching TV on g = gender (1 = male, 0 = female) and marital status (m1= 1 for singles, 0 otherwise, m2= 1 for married subjects, 0 otherwise), we get the following outputa. Write down the corresponding regression model for the
Using the GSS website sda.berkeley.edu/GSS, analyze whether the number of good friends (the variable NUMFREND) depends on the subject’s highest degree (the variable DEGREE). To do so, click the MEANS tab (next to the default TABLES tab) and enter the variable names. Under Output Options, deselect
In multiple comparisons following a one-way ANOVA with equal sample sizes, the margin of error with a 95% confidence interval for comparing each pair of means equals 10. Give three sample means illustrating that it is possible that Group A is not significantly different from Group B and Group B is
Analysis of variance and multiple regression have many similarities. Which of the following is not true? a. The response variable is quantitative for each.b. They both have F tests for testing that the response variable is statistically independent of the explanatory variable(s).c. For
One-way ANOVA provides relatively more evidence that H0: μ1 = ...= μg is false:a. The smaller the between-groups variation and the larger the within-groups variation.b. The smaller the between-groups variation and the smaller the within-groups variation.c. The larger the between-groups
For four means, it is planned to construct Tukey 95% multiple comparison confidence intervals for the differences between the six pairs.a. For each confidence interval, there is a 0.95 chance that the interval will contain the true difference.b. The probability that all six confidence intervals
There is interaction in a two-way ANOVA model whena. The two factors are associated.b. Both factors have significant effects in the model without interaction terms.c. The difference in true means between two categories of one factor varies among the categories of the other factor.d. The mean square
For subjects aged under 50, there is little difference in mean annual medical expenses for smokers and nonsmokers. For subjects aged over 50, there is a large difference. Is it true or false that there is interaction between smoking status and age in their effects on annual medical expenses?
An experiment used four groups of five individuals each. The overall sample mean was 60.a. What did the sample means look like if the one-way ANOVA for comparing the means had test statistic F = 0?b. What did the data look like in each group if F = infinity?
Present a situation for which it’s preferable to use a nonparametric method instead of a parametric method and explain why.
For a one-sided significance test comparing two means with small samples from highly skewed population distributions, it’s safer to use a t test than a Wilcoxon test. This is because the Wilcoxon test assumes normal population distributions and is not robust if that assumption is violated.
Describe the advantages of an experiment using a crossover design instead of independent samples to compare the tanning methods.
The t test for comparing two means is to the one-way ANOVA F test as the Wilcoxon test is to the __________ test.
The t test for comparing two means is to the Wilcoxon test (for independent samples) as the matched pairs t test is to the __________ (for dependent samples in matched pairs).
Nonparametric statistical methods are useda. Whenever the response variable is known to have a normal distribution.b. Whenever the assumptions for a parametric method are not perfectly satisfied.c. When the data are ranks for the subjects rather than quantitative measurements or when it’s
Showing 1900 - 2000
of 2108
First
8
9
10
11
12
13
14
15
16
17
18
19
20
21
22
Step by Step Answers